Category War by Numbers

The History of the DuWar Data Bases

The original databases of battles was developed by Trevor Dupuy and HERO (Historical Evaluation and Research Organization) back in the 1980s. They were published in a six volume work in 1983 as the HERO Land Warfare Data Base. This is back in the days when a data base did not have to be computerized (paper database – how quaint) and database was two words. It is report number 95 listed here: TDI – The Dupuy Institute Publications. Descriptive link is here: Analysis of Factors that have Influenced the Outcomes of Battles and Wars (dupuyinstitute.org). Of significance, there is a detailed description of each engagement in these paper reports. It was republished in 1984, 1985 and 1986 as report numbers 100, 103 and 111 here: TDI – The Dupuy Institute Publications. The final publication named the database as CHASE. 

This effort was funded by CAA and was before my time. I came to work for HERO in 1987. There was then some back and forth between CAA, where HERO and CAA got to fighting over details of the content. One analyst at CAA sent 16 engagements out for comment. I did analyze that effort, although that file is now buried on an old Word Perfect DOS-era disk. He had four outside independent historians each analyze four engagements. The end result is the comments made corrections/improvements to 25% of the engagements, the comments did really did not change anything in 25% of the engagements, and the comments actually, if implemented, would have added error the engagements in 50% of the cases. This is fairly typical of outside comments, with 1-out-of-3 or 1-out-of-4 being helpful, and half of them would degrade the product. At that point, the project came to a griding halt, with much animosity between the arguing parties.

Then both HERO and CAA decided to independently computerize their databases. HERO added about four new engagements to their database, maybe corrected a few others, and the programmed it in a flat file called Reflex. It was 603 engagements (working off memory here) and called the LWDB (Land Warfare Data Base). CAA decided to computerize its version of 598 or 599 engagements and it was called the CHASE database. This became the CBD-90 that some people are still using. Neither of these versions included the extensive battle narratives as databases at that time could not handle large text files.

The computerized Reflex version of the LWDB was later purchased by Oak Ridge National Laboratories and published in the book by Dr. Dean Harley. It is a better version than the CBD-90. I did review the CBD-90 over twenty years ago. In the original database, there were a series of factors that were coded as to what degree they influenced the battle. In the CBD-90 about one-third of those factors (or one-third of the engagements that had those factors) – they were blanked out or mis-coded. It was a simple coding error, that as far as I know has never been corrected. 

In the meantime, around 1995 I decided we needed to reorganize and reprogram the database. We had a new database created by Jay Karamales in Access. It included text files. We loaded the old Reflex engagements in the database and then Susan Rich and I proofed the entire database back to the paper copies. Susan Rich then entered in all the narratives into the database. So this was now a complete and proofed version of the 1986 paper database. 

I then broke the database up. One of the problems with the original database is that it has engagements from 1600 next to engagements from 1973 next to a series of day-long division-level engagements from WWII next to some six-month long army-level engagements from the Great War next to battalion-level actions. While there are definitely some historical trends across all these, in some cases, depending on what you are analyzing, it is comparing apples to oranges. So, I took at mostly one-day battles from 1600-1900 and put them in a separate database (243 engagements – the  BaDB. I took all the large army-level engagements (like Battle of Verdun, Battle of the Somme) and put them into a Large Action Data Base – LADB. Basically, moved them out of the way. They were later used in part to help create the CaDB (Campaign Data Base). I put the smaller battalion-sized engagements into a separate battalion-level data base (BLODB). They left us with a core of around 300 engagements in a division-level database, mostly of 1-day engagements. All this work was done outside and independent of any contracted effort and therefore became a Dupuy Institute proprietary product. As with any proprietary product, you have to protect it.

We then expanded all these databases. In the case of the division-level database (the DLEDB), we ended up doing a series of studies for CAA on Enemy Prisoner of War capture rates in 1998-2001. We coded the division-level engagements by outcome and then using that to analyze capture rates based upon the outcomes of the battle. This effort included getting counts of the number captured and the number of deserters in each engagement. This is reports E-1 to E-8 here:  TDI – The Dupuy Institute Publications. The data used (but not the complete listing of the engagement) was included in appendices to these reports. CAA and the U.S. Army is still using these new rates.

We also added engagements to it from our urban warfare studies (CAA), reports U-1 to U-3. We used the database to analyze the urban versus non-urban combat. It was during that study we added engagements from the Channel Ports, Aachen and the three battles of Kharkov (1943). This study is discussed in two chapters in my book War by Numbers. We also took the time and put in 192 engagements from the Battle of Kursk (1943) based upon our work on the Kursk Data Base. All these Kursk engagements are listed (abbreviated) in my big Kusk: The Battle of Prokhorovka book. We also did a study on situational awareness for OSD Net Assessment (Andy Marshall’s old office). This is report SA-1 and also two chapters in my book War by Numbers. We ended up coding 295 division-level engagements based upon their knowledge of the enemy (by reviewing their intel reports of the divisions involved). We then reviewed what was the measurable combat advantage of improved situation awareness based upon real-world combat data. So, as in the EPW study, we took our original database and added additional filled-in fields so as to be able to do properly analyze the issue. This last expansion of the database was completed in 2004.

At that point, the division-level database had 752 cases in it. We had done some additional work on the old Italian Campaign engagements to clean them up and revise them. In particular Richard Anderson collected UK records from PRO and we cross-checked and revised all the UK engagements in the database and expanded the number of Italian Campaign engagements from about 70 to around 140. We then stopped work on the database in 2004.

During that time, we also expanded the battalion-level database to around 200 actions. We also had created a Campaign Data Base as part of our work, to examine operations above division-level and that last more than a few days. This was recently used for my presentation on Force Ratios that I gave at the second HAAC and in Norway in early November. See: The Schedule for the Second Historical Analysis Annual Conference (HAAC), 17 – 19 October 2023 | Mystics & Statistics (dupuyinstitute.org). In 2010 we created a small draft company-level database under contract with Boeing of 100 cases. A listing of most of these databases is here: TDI – The Dupuy Institute Publications. It does not include the company-level database, the Battle of Britain database nor the Dupuy Insurgency Spread Sheets (DISS) as we have not updated that page.

Obviously, people are going to ask: how can they get access to these databases. The answer is that you cannot until someone is willing to purchase them at a price that I willing to release them for. With the internet any single sale of the database will result in the release of the entire database to the world. So, any price would have to address the fact that these powerful and unique databases, which are proprietary to The Dupuy Institute, would be shared with the world. This includes potential business competitors. We still rely on contracts for our funding and these databases are part of our “product.” So, cost of giving away an exclusive competitive advantage? We would be willing to sell them to an organization if the price is right and they could then be publicly released. So far no one has made a significant concrete offer to us.


So other links:

Some Background on TDI Data Bases | Mystics & Statistics (dupuyinstitute.org)

Dupuy Institute Data Bases | Mystics & Statistics

Cost of Creating a Data Base | Mystics & Statistics (dupuyinstitute.org)

The Division Level Engagement Data Base (DLEDB) | Mystics & Statistics (dupuyinstitute.org)

Battalion and Company Level Data Bases | Mystics & Statistics (dupuyinstitute.org)

Other TDI Data Bases | Mystics & Statistics (dupuyinstitute.org)

Using the DLEDB:

Average Losses per Day in Division-level Engagements on the Eastern Front in 1943 | Mystics & Statistics (dupuyinstitute.org)

Density of Deployment in Ukraine | Mystics & Statistics (dupuyinstitute.org)

The U.S. Army Three-to-One Rule versus the 752 Case Division-level Data Base 1904-1991 | Mystics & Statistics (dupuyinstitute.org)

Comparing Force Ratios to Casualty Exchange Ratios | Mystics & Statistics (dupuyinstitute.org)

Comparing the RAND Version of the 3:1 Rule to Real-World Data | Mystics & Statistics (dupuyinstitute.org)

Summation of Force Ratio Posts | Mystics & Statistics (dupuyinstitute.org)

Amphitheater, 9 – 11 September 1943 | Mystics & Statistics (dupuyinstitute.org)

Amphibious and River Crossing Engagements in the Italian Campaign 1943-44 | Mystics & Statistics (dupuyinstitute.org)

The World War I Cases from the Division-level Database | Mystics & Statistics (dupuyinstitute.org)

The World War II Cases from the Division-level Database | Mystics & Statistics (dupuyinstitute.org)

Post-World War II Cases from the Division-level Database | Mystics & Statistics (dupuyinstitute.org)

Force Ratios in the Arab-Israeli Wars (1956-1973) | Mystics & Statistics (dupuyinstitute.org)

Other discussion:

Battles versus Campaigns (for Validation) | Mystics & Statistics (dupuyinstitute.org)

Validation Data Bases Available (Ardennes) | Mystics & Statistics (dupuyinstitute.org)

Validation Data Bases Available (Kursk) | Mystics & Statistics (dupuyinstitute.org)

Other Validation Data Bases | Mystics & Statistics (dupuyinstitute.org)

The Use of the Two Campaign Data Bases | Mystics & Statistics (dupuyinstitute.org)

Measuring the Effects of Combat in Cities, Phase II – part 1 | Mystics & Statistics (dupuyinstitute.org)

Presentations from HAAC – Urban Warfare | Mystics & Statistics (dupuyinstitute.org)

The Battle of Britain Data Base | Mystics & Statistics (dupuyinstitute.org)

Presentations from HAAC – Data for Wargames | Mystics & Statistics (dupuyinstitute.org)

The U.S. Army Three-to-One Rule versus 243 Battles 1600-1900 | Mystics & Statistics (dupuyinstitute.org)

The U.S. Army Three-to-One Rule versus 49 U.S. Civil War battles | Mystics & Statistics (dupuyinstitute.org)

Using the CBD:

The Key to Victory: Machine Learning the Lessons of History | Mystics & Statistics (dupuyinstitute.org)

Presentations from HAAC – Machine Learning the Lessons of History | Mystics & Statistics (dupuyinstitute.org)

There is more….

Phalanx Article: What We Have Learned from Doing Historical Analysis | Mystics & Statistics (dupuyinstitute.org)

Current book release schedule

I have four books in process or about to be released. They are:

The Battle for Kyiv:
– UK release date: 28 November
– U.S. release date: 18 January 2024

Aces at Kursk:
– UK release date: 30 January 2024
– U.S. release date: posted as 18 January 2024, but suspect release date will be in March 2024.

Hunting Falcon:
– UK release date: 28 February 2024
– U.S. release date: posted as 29 February 2024, but suspect released date will be in April 2024.

The Siege of Mariupol:
– UK release date: sometime in 2024
– U.S. release date: sometime in 2024

Books under consideration for 2024/2025:
The Battle for the Donbas
The Battle of Tolstoye Woods (from the Battle of Kursk)
More War by Numbers

Third video posted to our YouTube site

We have now published the third video from the first Historical Analysis Annual Conference (HAAC) to our YouTube site. It is here: (1) Data for Wargames: Lawrence – YouTube
The briefing in this third video goes for most of the video, as discussion and comments were made mostly during the briefing. The briefing ends at 55:30 the video ends at 59:27.

A few discussions of note:

At 10:10 – A discussion of what TDI does

At 18:52 – A discussion of Breakpoints

At 32:54 – A discussion of Suppression

At 37:18 – A discussion of what we don’t know

There were some issues with sound from virtual attendees, but one of these was Robert Helmbold, so, please bear with us.


The viewgraphs for these briefings were previous posted here: Presentations from HAAC – Data for Wargames | Mystics & Statistics (dupuyinstitute.org)

The schedule for our next conference is here: Schedule for the Second Historical Analysis Annual Conference (HAAC), 17 – 19 October 2023 | Mystics & Statistics (dupuyinstitute.org)

Bigger Fleets Win

This article just came across my desk courtesy of a friend: Bigger Fleets Win | Proceedings – January 2023 Vol. 149/1/1,439 (usni.org) 

I will avoid discussing the article, instead I will only discuss the two references to me (A little bit of vanity here).

First there is footnote 24, which references my book War by Numbers. There problem is that the discussion that he is footnoting does not something I recall writing. He may be paraphrasing me, but I do really recall making that point. Still, I appreciate the shout out.

The next paragraph also repeats footnote 24 following the sentence “Why bother discussing such ancient history when ‘everything is different now?’. I actually do not recall making such a statement, but maybe I did somewhere. Between a thousand+ blog posts, 60+ reports, 7+ books, etc. I could have said that. I don’t remember saying that. The article having two footnotes 24 and no footnote 25 leads me to suspect that the footnoting got garbled.

Later on in the article, they claim that “the DuPuy Institute finds it difficult to validate models of future combat based on past data because ‘there are no real-world examples in the past twenty-five years of combat between conventional armed forces with similar levels of advanced technology and military competence.'”

The first part of this…the “finds it difficult” part really does not sound like anything I have said. My attitude it that you go ahead and test a model to the past, because if it cannot predict the past, if it cannot predict the actions of lower tech weapons; then you can be pretty damn sure it is not also predicting modern combat. So this does not seem to be a claim I would make. 

Now the quote that is attached to that sounds exactly like something I would say or did say. I kind of remembering saying that in a phone interview. I don’t remember when or where. The reference is to footnote 30, an article on F-35s published in Breaking Defense two years ago. It is here: HASC Chair Slams F-35, 500-Ship Fleet; Highlights Cyber – Breaking Defense. Now, I don’t see any references to The Dupuy Institute there. Perhaps it is in one of the linked articles.

Anyhow, nice to be referenced and quoted. Would be nicer if it was in proper context. 

Update: Found the quote from my book. The article says:

“The Dupuy Institute, one of the most notable independent centers of operational research on land warfare, and one that models combat outcomes based on historical data, expressed this concern in 2017:

“Many have postulated… a revolution in warfare created by the synergetic effects of increased weapons accuracy… [etc., see above]. Recent U.S. conventional operations have increased this perception due to our opponents being technologically inferior, not particularly well trained, or simply incompetent, while the United States had enjoyed air supremacy and the luxury of outgunning our opponents.”

Now this is something I have said. It is footnote 29, the Freedberg article quoted above, which does not quote me. So, clearly the footnotes have gotten garbled.

I do have to thank Captain Tangredi, who I have never met, for calling us “one of the most notable independent centers of operational research on land warfare.” The quote from 2017 is clearly referring to War by Numbers (published 2017).

Wounded-to-killed ratios in Chiraq

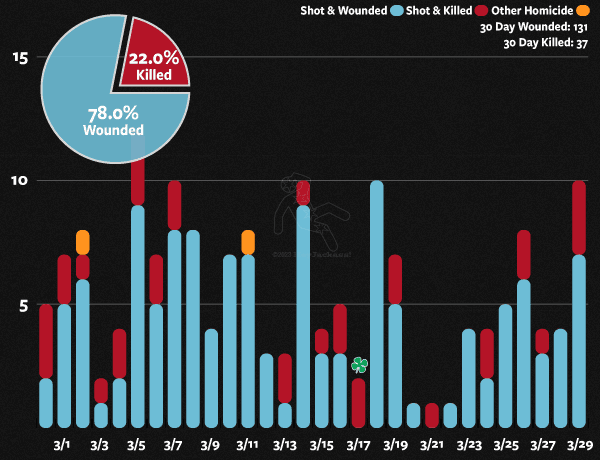
Probably going a little astray here but was looking at reports of the number of civilians killed and wounded in the gun violence in Chicago.

It is reported that in the last 30 days, 37 people were killed and 131 were wounded. This comes out to a wounded-to-killed ratio of 3.54-to-1 or a lethality figure of 0.22. This is kind of a high wounded-to-kill ratio for direct fire weapons.


Playing with the database (see: Chicago Crime, Murder & Mayhem | Criminal Infographics | HeyJackass! | Illustrating Chicago Values) show that in 2022 there were 665 shot and killed and 2937 shot and wounded for a wounded to killed ratio of 4.42 or lethality of 0.23.

For example, in War by Numbers, pages 184-187, I have various reports from WWII of lethality of rifles of 0.32, for infantry projections of 0.30, for gunshot of 0.39, for small arms of 0.34 or 0.38 included died of wounds, of small arms in Korea of 0.26, of small arms in Vietnam of 0.49 or 0.30 including carded-for-record, of “low-velocity bullets”: in Northern Ireland of 0.08, of “high-velocity bullets” in Northern Ireland of 0.37, of bullets in 1982 Israeli-Lebanon War of 0.31, of small arms in the 1982 Israeli-Lebanon War of 0.28. Weighing all ten data sets equal: let’s say: 0.314. This is a wounded-to-killed ratio of 3.18 as caused by small arms. 

Now, a civilian environment is different that a combat zone. To start with the mix of weapons used is different. Lots of pistols, Second, the people tend to receive medical attention quicker than on a battlefield. On the other hand, some people are shot multiple times on the street, and some shootings end with a “kill shot.” Still, the wounded to killed ratio is 3.54-to-1. Of course, not sure if all the wounded are counted either. Are the wounded who do not need hospital attention counted? Are some of the wounded who need hospital attention also not counted because they choose to avoid the hospital (and the authorities)?

Artillery (fragmentation wounds) tend to have a higher wounded-to-kill ratio that wounds from gunfire (for example 0.11, 0.19, 0.27 or 0.18, 0.22 or 0.26, 0.34, 0.14 or 0.07, 0.13, 0.11 and 0.21 for an average of 0.196 or a wounded-to-killed ratio of 5.11-to-1). In convention combat, artillery tends to be the cause of the majority of wounds.

I do not know the accuracy or providence of the data I am accessing. It is discussed on the website I am referencing (Chicago Crime 2022 Archives – Criminal Infographics – HeyJackass!). Does killed only include those who are dead when they have arrived in the hospital, or does that database include those who died after they arrived (including days or weeks after they arrived)?


Thanks to Abdulelah Almarri for pointing me to the Chiraq data.

Return-to-Duty (RTDs)

I have never really done any work on RTDs. I have an entire chapter on Casualties (Chapter 15) in War by Numbers, but nothing really on RTDS.

Anyhow, more than one person has asked me about this, so let me outline what I/we know:

1). The rule of thumb Trevor Dupuy developed on RTDs was in his “Handbook on Ground Forces Attrition in Modern Warfare,” September 1986, page 90. It says:

“Finally, there is a general rule of thumb for estimating returns to duty from casualties. For each 100 personnel casualties (battle casualty, disease, or injury) 75 will be returned to duty at the end of 20 days at a rate of five per day between the 6th and 20th days after admission, and 25 will never be returned to duty as a result of death, evacuation to the Zone of the Interior, or discharge. This will vary widely from situation to situation, depending in large part upon the theater evacuation policy.”

It is also in his book Attrition, pages 53-54, stated the exact same way. We still have copies of Attrition for sale: TDI Books For Sale (dupuyinstitute.org).
 

2). A report done by several people, including Ron Bellamy, who I have worked with, provides the following table:

This chart is from this report: ADA480496.pdf (dtic.mil). I am indebted to Alex Roslin for this research.

Note that RTDs here is those that are returned within 72 hours. So, 752,396 WIA in WWII. Of those, 20% are RTD within 72 hours (and 2.8% are DOW). For Vietnam 235,398 WIA. Of those, 35% are RTD within 72 hours (and 2.1% are DOW). Note that these RTDs within 72 hours are probably all casualties “carded for record only.”

Note that the wounded-to-killed ratio for the WWII data is 4.94-to-1 or 4.22-to-1 if DOW is counted as KIA vice WIA and 3.36-to-1 if DOW is counted as KIA and RTD is not counted as WIA. The wounded-to-killed ratio for Vietnam data is 6.15-to-1 or 5.33-to-1 if DOW is counted as KIA vice WIA or 3.43-to-1 is RTD is not counted.

For the Iraq/Afghanistan data there are 16,235 WIA. Of those, 51% were RTD within 72 hours (and 2.4% are DOW).The wounded-to-killed ratio is 12.82-to-1 or 9.61-to-1 if DOW is counted at KIA vice WIA and 4.58-to-1 is RTD is not counted.

Now, I suspect some of the figures are skewed by how casualties are counted. In World War I and II, you were counted as wounded if you spent the night in a hospital. In Vietnam at one point the U.S. Army counted 96,900 wounded and maybe 104,000 carded-for-record only, meaning over 100,000 soldiers were not counted as wounded, but were allowed to receive the Purple Heart (my father got one that way). I may need to do a blog post about “carded for record” or WIANE (wounded-in-action, not evacuated).

See our report: “C-1 Combat Mortality: Why is Marine Combat Mortality Less than That of the Army (JCS) (March 1998),” page 19. This was done as a joint project with Ron Bellamy. 

3). Now, where the “rule of thumb” that Trevor Dupuy came from is not known. In an attempt to find them, I pulled up three of the old HERO reports 1) 14. Historical Analysis of Wartime Replacement Requirements (26 July 1966), 2) 48. German and Soviet Replacement Systems in World War II (July 1975), and 3) 86. Analytic Survey of Personnel Replacement Systems in Modern War (Apil 1981).

In the second report, page 24 they do have a table “Table 3. German Replacement Army Strength, NCOs and Men, 1 September 1944” which has a total of 2,137,973 with “convalescents” making up 178.456 of that replacement army strength (8%). On 4 December 1944 (page 45) they show for November 1944 342,000 replacements of which 40,000 are convalescents (12%). And then on page 54 there are four tables, three which show convalescents. The most interesting is “Table 20: Losses and Arrivals, German Field Army. From July 1943 to March 1944.” It shows arrivals by month to the Eastern Front as 930,000, of which 421,000 are convalescents, 478,500 are replacements and 30,500 are FTDs (recruits sent to Feild Training Divisions). For “Other Fronts,” the numbers are much smaller: 24,000 convalescents and 50,000 replacements. What is interesting, but not surprising, is that the number of convalescents increase over time. From July through October 1943 it is 34,000 to 46,000 convalescents for each month, by February and March 1944 it is 60,000 convalescents a month. 

For the Russians (page 90), the Germans estimated that 200,000 Russian convalescents were returned monthly to combat as replacements. The Germans estimated (page 91) that in 1942 ten Soviets armies received 764,000 replacements. Of them, new conscripts formed 56.5% of the total, 22.5% were convalescents, 10% were from labor battalions, 9.5% had been non-combat troops, and 1.5% had formerly had occupational deferments. Over 44,000, about 6%, were former convicts, released from prions and concentration camps. 

For 1 January-31 August 1943 for sixteen Soviet armies the Germans estimated that 89% of the replacements were new conscripts, 9% were convalescents, and 2% were former non-combat and survivors of units destroyed. Also of interest is that the Germans estimated that 28% had training of less than 10 days, 49.6% had training of up to one month, and 22.4% had training of over one month. I will avoid the temptation to equate this with the current war in Ukraine.

A third report indicates that in June 1943, 34,384 Soviet replacements reached units (probably the Bryansk Army Group) facing the German Ninth Army as follows: 82% were new conscripts, 7% were convalescents, 11% were former non-combat. Their training was reported as 26% less than 10 days, 49% up to one month, and 11% were former non-combat.  

Now, none of this actually answers my questions on RTD rates, but I still found it pretty damn interesting.

Finally, there is the report “Analytic Survey of Personnel Replacement Systems in Modern War.” This last report was primarily written by C. Curtiss Johnson (in case he is reading this blog). 

It provides a few snippets of useful data. For example (page 48), it states for the 6695 and 6706 Conditional Companies (U.S. Army, Italy) that between 1 July 1944 and 10 June 1945 the two companies process approximately 12,400 patients, of whom nearly 10,400 were rehabilitated sufficiently to return to unit. This is 84% returned-to-duty.

In the case of the Vietnam War, the 90th Replacement battalion from the quarter ending 31 Jan 1969 through 31 October, processed 172,585 replacements and 175,346 returnees. Not sure this tells us much.

 But this does… to quote (starting from page C-2):

Table 20, based on data compile by the Office of the Surgeon, MTOUSA, in December 1944, shows… the sample included 71,378 patients, 29,727 of whom had been injured and 41,651 of whom were battle casualties. Of the injured patients, 26,174 or 88.05% were returned to duty after hospitalization, 799 or 2,69% died, and 2,754 or 9.26% were evacuated to ZI hospitals. Of battle casualty patients (WIA), 29,860 or 71.69% were returned to duty, 1,130 or 2.71% died, and 10,661 or 25.60% were evacuate to ZI hospitals.

Experience during 1943-1944 showed that 86.69% of injury patients who were returned to duty became General Assignment personnel, and the remainder (13.31%) became Limited Assignment. The same figures for battle casualty patients were 83.89% General Assignment personnel and 16.11% Limited Assignment personnel.  

…The General Board, ETO,… finding may be expressed in tabular form as follows:

Percentage of Returns Correlated to Theater Evacuation Policy

Days after Admission     Battle Casualties (2,090)   Non-Battle Cas. (100,000)

  60                                    50.7                                        90.6

  90                                    59.5                                        93.0

120                                    64.8                                        93.4

Of the total returned to duty, 28.6% of the battle casualties and 5.3% of the non-battle casualties were estimated to be Limited Assignment personnel. While no comparison can be made between the injuries surveyed by the Office of the Surgeon, MTOUSA, and the non-battle casualties surveyed by the General Board, ETO, the data for battle casualties in the two reports can be compared. This comparison shows that the MTO return rate (71.69%) much exceeded the greatest rate reported for the ETO (64.8%) and that the percentage of returned who became Limited Duty personnel was greater for the ETO (28.6%) than for the MTO (16.11%). The probable explanation for the disparity in these rates was the size of the populations surveyed: the ETO battle casualty sample was 2,090; the MTO sample was 41,651.

The Report of the Army’s postwar Replacement Board provides qualitative and quantitative assessments of the replacement value of hospitalized casualties. In Volume V, Annex 14, p. 1, Major General Russell B. Reynolds, who was ACS, G-1, SPA, stresses the replacement value of hospital returnees and comments:

When you sustain 10 battle casualties, you’ll bury 3, evacuate 2 to the US, find 4 suitable for return to duty in branch, and have to retrain, either in a training center, or on the job, 1. In the case of non-battle casualties, for each 10 you’ll evacuate about 4/10 of a man, bury 1/10 of a man, and find 8 2/4 suitable for return to duty in branch, and face a retraining job on 3/4 of a man. 

These numbers may be expressed on a percent basis as follows: of surviving battle casualties, 28.6% will be evacuees and 71.4% will be returnees; of surviving non-battle casualties, 4.0% will be evacuees and 96% will be returnees. It is interesting to note that when these figures are compared to the same figures derived from MTO and ETO data, there is a remarkable degree of correlation. 

The World War II data presented above may be compared to data developed from the statistical records of World War I by Colonel Albert G. Love of the US Army’s Medical Corps in 1931. Love found that in any typical group of AEF disease and non-battle injury (DNBI) patients, 3.70% would die, 7.52% would have to be evacuated (total lost 11.22%), and 88.78% would be returned to duty. For AEF battle casualty patients, excluding gas wounds, 8.12% would die, 29.58% would have to be evacuated (total lost 37.70%), and 61.88% would be returned to duty. The return rates for World War I DNBI casualties are very close to those of World War II, while World War I BC return rate is smaller than the smallest World War II BC return rate (ETO, General Board: 64.8%). The small World War I BC return rate undoubtedly reflects the less advanced medical treatment available in the earlier conflict (notice, for example, the greater percentage of BC patients dying in hospital).

Expressed in terms of AEF theater evacuation policies, Love’s data reveals the following:

Percentage of Returns Correlated to Theater Evacuation Policy

                                               Percentage Returned to Duty

Days after Admission          Battle Casualties        DNBI

  30                                        24.88                            67.40

  60                                        46.17                            81.74

  90                                        55.73                            86.38

120                                        59.53                            87.95   

…The best, most recent set of data on the replacement value of hospitalized personnel is the data developed from the Korean conflict by Frank A. Reister… Reister’s Table 13, p. 14, shows the final disposition of 248,946 US Army patients from division units originating in Korea during July 1950 – July 1953. Of this number 72,961 were battle casualties (WIA) and 175,985 were non-battle casualties. The distribution of final disposition for battle casualties originating in division units was as follows: 2.2% (1,574) died of wounds, 87.9% (64,159) returned to duty, 8.5% (6,239) were separated for disability, and 1.4% (989) wee administrative separations. The distribution of final dispositions for division non-battle casualties was as follows: 0.3% (485) died, 98.6% (173,525) returned to duty, 0.9% (1,625) were separated for disability, and 0.2% (35) were administrative separations.  

The return to duty figures developed by Reister may be compared to the same figures from Love’s compilation and the various World War II sets to indicate the relative increase in percentage of returns in the two admission categories since World War I and to underscore the value of hospital returnees as a source of replacements in future wars.

Bolding is mine. I suspect the bolded sentence was the basis of the Trevor Dupuy rule of thumb on RTDs.

In the end, there are over 140 old HERO, TNDA, DMSI and Trevor Dupuy reports. None that I have looked at clearly show where his “rule of thumb” on RTDs comes from, although it appears to have come from the last report referenced. I do have more old Dupuy files than I have time to look through them. 

4) There is probably more material out there of value. If so, please post it to the comments in this blog.

5) Proselytizing note: I really did try a couple of years ago to get a probably study done on wounded-to-killed ratios and weapon lethality over time. Could never quite get the funding. Not sure why. See: Two proposals on Combat Casualties | Mystics & Statistics (dupuyinstitute.org)

If someone really wants the answers to these types of questions, then someone needs to start funding proper research.

Presentations from HAAC – Urban Warfare

The sixth presentation of Day 2 in the Einstein Conference Room was supposed to be virtual presentation on Artillery Suppression. This was cancelled due the presenter’s workload. Maybe next HAAC. As we had gathered all the participants back into the main conference room, I choose to skip the seventh presentation on Urban Warfare that was planned for the Einstein Conference Room. It is discussed in some depth in two chapters of my book War by Numbers. But the presentation is here: Urban I & II & III.1

This ends all the presentations for Day 2 of the First Annual Historical Analysis Annual Conference. Next will be the day 3 presentations. We are tentatively planning the next conference for 17-19 October 2023). It will be at the same locale and similarly structured.


In the Pike and Gallows Conference Center, day 2:

The first presentation of the day was my monstrosity, Iraq, Data, Hypotheses and Afghanistan (which I later turned into the book America’s Modern Wars): NIC Compilation 3.1

The second presentation of the day was Lessons Learned from Haiti 1915-1934 by Dr. Christopher Davis of UNCG: History as an Enemy and Instructor

The third presentation of the day was Estimating War Deaths (in Iraq) by Dr. Michael Spagat of Royal Holloway University of London: Iraq Deaths

We then had a group discussion on whether we could have won the war in Afghanistan. I opened the discussion with a brief 12-slide presentation, built from my original presentation that morning. It is here: Could We Have Won

This was followed by presentation by Joe Follansbee (Col. USA, ret) on a proposed Close Combat Overmatch Weapon.

The sixth presentation of the second day was Contentious Issues in Syria: the Alawi Religion, their Political Struggles, Chemical Warfare in Syria and a Hypothesized Religicide of the Alawis by Jennifer Schlacht: Temporarily deleted.

The seventh presentation of the second day was The Silent Killers: A Quick Historical Review of Biological Threats by Dr. Douglas A. Samuelson: HAAC Bio Threats 09282.


In the Einstein Conference Room, day 2:

The first presentation was A Statistical Analysis of Historical Land Battles: What is Associated with Winning? by Dr. Tom Lucas of the Naval Post-Graduate School: Historical Battles what is associated with winning.

The second presentation was The Combat Assessment Technique by William Sayers: The Combat Assessment Technique.

The third presentation was Machine Learning the Lessons of History by Dr. Robert Helmbold: The Key To Victory-0017A. His supporting text is here: TEXT-0031.

The fourth presentation was Penetration Division: Theory, History, Concept by LtC. Nathan A. Jennings, PhD: HAAC Presentation_LTC Jennings.

The fifth presentation was Learning from History: The Army’s Future Study Program by LtC. Adam L. Taliaferro: HAAC_Presentation.

——

We had a total of 30 presentations given at the first Historical Analysis Annual Conference (HAAC). We have the briefing slides from most of these presentations. Over the next few weeks, we are going to present the briefing slides on this blog, maybe twice a week (Tuesdays and Thursday). In all cases, this is done with the permission of the briefer. We may later also post the videos of the presentations, but these are clearly going to have to go to another medium (Youtube.com). We will announce when and if these are posted.

The briefings will be posted in the order given at the conference. The conference schedule is here: Schedule for the Historical Analysis Annual Conference (HAAC), 27-29 September 2022 – update 16 | Mystics & Statistics (dupuyinstitute.org).

The nine presentations given on the first day are all here: Presentations from HAAC – Air Combat Analysis on the Eastern Front in 1944-45 | Mystics & Statistics (dupuyinstitute.org).

TLIs and Gun Control

Well, Trevor Dupuy’s work on the Theoretical Lethality Index (TLI) that was done back in 1964 has entered into the U.S. gun control debate, not by our choice.

We discussed an earlier work that addressed this at Common Use, Lineage, and Lethality | Mystics & Statistics (dupuyinstitute.org). This first came to our attention through an article posted by CNN that generated thousands of pingbacks to our site: Opinion: Now that guns can kill hundreds in minutes, Supreme Court should rethink the rights question | CNN.

Even though I have my doubts about the utility of using the Theoretical Lethality Index for discussing gun control, I did attend and present at the conference “Current Perspectives on the History of Guns and Society” in mid-October. See: Conference: Current Perspectives on the History of Guns and Society | Mystics & Statistics (dupuyinstitute.org)

Attending this conference did lead to some useful discussions about collecting data on lethality and weapons effects in a civilian environment, similar in some respects to what I had in Chapter 15 (Casualties) in War by Numbers. This has been discussed before on this blog: Wounded-to-killed ratios in Ukraine in 2022 | Mystics & Statistics (dupuyinstitute.org) and Two proposals on Combat Casualties | Mystics & Statistics (dupuyinstitute.org). I am currently not actively trying to market an effort to further explore wounded-to-killed ratios in modern combat (although I think this is sorely needed) and I am not marketing any efforts to look at lethality in a civilian environment.

Now, there is an article contesting the original articles on the subject on the website The Volokh Conspiracy by David Kopel called “The Theoretical Lethality Index is useful for military history but not for gun control policy.” This blog post, which is rather long, is here: The Theoretical Lethality Index is useful for military history but not for gun control policy (reason.com).

Part IV of the article actually “estimates” the TLI of an assault rifle at 640. This seems a little low. It is clear that TLIs of assault rifles are 800-900 or higher, depending on the model of the rifle and how they are calculated. David Kopel’s article provides the following figures:

18th Century Flintlock: 43
1903 Springfield bolt-action magazine-fed rifle: 495
Modern AR semiautomatic rifle: 640
Modern 9mm semiautomatic handgun: 295

Not sure why they needed to “estimate” the TLI of an assault rifle (AR), as it can be calculated using the formulae in Numbers, Predictions and War. We do have lists of various TLIs for a wide variety of weapons. We do have a complete list on the DOS version of the TNDM which I am too lazy or too busy right now to get up and running. But, we did do have some old listings and spreadsheet calculations sitting around on my computer from past model validation runs. So, let me quote some figures from those efforts:

From Excel spreadsheet:
Soviet Tula-Tokarev 33 Pistol = 297.36 (7.62mm)

From WPN_LIST-WWII:
Soviet AK-47 Assault Rifle = 831.685
7.92mm FG 42 Assault Rifle: 789.823
7.92mm MP 43/StG 44 Assault Rifle: 904.045

We did check back with Chip Sayers who keeps his own listings he has calculated, and they show:

Tokarev TT-33 semi-auto 7.62mm pistol – 265 
9mm Parabellum-Pistole Luger P08 – 228
9mm Walther P.38 – 229
AK 7.92mm Assault Rifle – 813
Sturmgewehr 44 – 868
 
Calculations vary a little from using to user depending how they determine what the practical sustained rate of fire for a weapon on a per-hour basis, maximum effective range and accuracy (often an estimation) of the weapon is (see pages 187-199 of Numbers, Predictions and War).
 
I guess we could go back and do the calculations for a whole range of assault rifles, but I have a lot on my plate at the moment. Certainly, someone else could do this with a little investment of time. The formulas for the TLI are public.
 
Anyhow, I am not going to enter this gun debate. The TLIs were designed for use in analyzing combat. While they are not directly applicable to the civilian world, they are illustrative. How relevant they are for discussions on gun control I will leave for others to argue. That is not our business.
 
But… there is one statement is David Kopel’s argument I must take issue with, which is “Extrapolating from the historic arms that Dupuy studies to present-day arms is questionable.”
 
Now, we have used the TNDM, which uses the formulae for the TLIs, as part of our effort to both analyze combat in the past and to analyze combat in the present. This construct developed in 1964 was used as part of our predictions for the Gulf War in 1991 (see: Forecasting the 1990-1991 Gulf War | Mystics & Statistics (dupuyinstitute.org) and Assessing the TNDA 1990-91 Gulf War Forecast | Mystics & Statistics (dupuyinstitute.org) and Assessing the 1990-1991 Gulf War Forecasts | Mystics & Statistics (dupuyinstitute.org). Needless to say, these predictions did better than most predictions at the time, and certainly did better the recent U.S. “intelligence communities” predictions for Afghanistan in 2021 or Ukraine in 2022. As I note: I like to claim that we are three-for-three in our predictions… | Mystics & Statistics (dupuyinstitute.org) or maybe four-for-four: Does this mean that we are four-for-four in our predictions? | Mystics & Statistics (dupuyinstitute.org).


The TNDM was also used for part of our prediction efforts on Bosnia in 1995 (see Forecasting U.S. Casualties in Bosnia | Mystics & Statistics (dupuyinstitute.org), reports B-0 and B-1 here TDI – The Dupuy Institute Publications and America’s Modern Wars) and has been used for others for a number of their own efforts in 2022 (see An Independent Effort to Use the QJM to Analyze the War in Ukraine | Mystics & Statistics (dupuyinstitute.org) and A Second Independent Effort to use the QJM/TNDM to Analyze the War in Ukraine | Mystics & Statistics (dupuyinstitute.org)). So, we are using TLIs for present day armies. We also did studies comparing proposed modern armor brigades with WWII armor divisions, which we have never blogged about (see FCS-1 and FSC-2 TDI – The Dupuy Institute Publications), although the corps and division-level model validation charts from that effort are in Chapter 19 (Validation of the TNDM) of War by Numbers and is reference here: Validating Trevor Dupuy’s Combat Models | Mystics & Statistics (dupuyinstitute.org). Some of our discussions on model validation are here: Summation of our Validation Posts | Mystics & Statistics (dupuyinstitute.org).

But, there is also Dr. Alexander Kott’s work which extrapolates weapons developments into the future, using a set of formulas similar to the TLI. This is discussed here The Evolution of Weapons and Warfare? | Mystics & Statistics (dupuyinstitute.org) and here Data Used for the ARL Paper | Mystics & Statistics (dupuyinstitute.org) and here Data Used of the ARL Paper – post 2 | Mystics & Statistics (dupuyinstitute.org) and here Technological Advancement Lessons from History? | Mystics & Statistics (dupuyinstitute.org) and here Two ARL Reports | Mystics & Statistics (dupuyinstitute.org). So, if David Kopel’s statement is correct, then the work Dr. Alexander Kott is doing at the Army Research Lab (ARL) is not valid. Dr. Kott did present his work at the Historical Analysis Annual Conference (HAAC) in late September and his briefing will be posted to this blog.

Presentations from HAAC – Data for Wargames

The second presentation of the first day was given by me. It is here (45 slides): Data for Wargames (Summary) – 2. This presentation was originally prepared for a conference in Norway in December 2021. It was based upon my books America’s Modern Wars and  War by Numbers.

—————

We had a total of 30 presentations given at the first Historical Analysis Annual Conference (HAAC). We have the briefing slides from most of these presentations. Over the next few weeks, we are going to present the briefing slides on this blog, maybe twice a week (Tuesdays and Thursday). In all cases, this is done with the permission of the briefer. We may later also post the videos of the presentations, but these are clearly going to have to go to another medium (Youtube.com). We will announce when and if these are posted.

The briefings will be posted in the order given at the conference. The conference schedule is here: Schedule for the Historical Analysis Annual Conference (HAAC), 27-29 September 2022 – update 16 | Mystics & Statistics (dupuyinstitute.org)

The conference opened with a brief set of introductory remarks by me. The seven supporting slides are here: Opening Presentation

It was then followed by a briefing by Dr. Shawn Woodford on Studying Combat; The “Base of Sand” Problem: 20220927 HAAC-Studying Combat