Category Kursk Data Bases

The History of the DuWar Data Bases

The original databases of battles was developed by Trevor Dupuy and HERO (Historical Evaluation and Research Organization) back in the 1980s. They were published in a six volume work in 1983 as the HERO Land Warfare Data Base. This is back in the days when a data base did not have to be computerized (paper database – how quaint) and database was two words. It is report number 95 listed here: TDI – The Dupuy Institute Publications. Descriptive link is here: Analysis of Factors that have Influenced the Outcomes of Battles and Wars (dupuyinstitute.org). Of significance, there is a detailed description of each engagement in these paper reports. It was republished in 1984, 1985 and 1986 as report numbers 100, 103 and 111 here: TDI – The Dupuy Institute Publications. The final publication named the database as CHASE. 

This effort was funded by CAA and was before my time. I came to work for HERO in 1987. There was then some back and forth between CAA, where HERO and CAA got to fighting over details of the content. One analyst at CAA sent 16 engagements out for comment. I did analyze that effort, although that file is now buried on an old Word Perfect DOS-era disk. He had four outside independent historians each analyze four engagements. The end result is the comments made corrections/improvements to 25% of the engagements, the comments did really did not change anything in 25% of the engagements, and the comments actually, if implemented, would have added error the engagements in 50% of the cases. This is fairly typical of outside comments, with 1-out-of-3 or 1-out-of-4 being helpful, and half of them would degrade the product. At that point, the project came to a griding halt, with much animosity between the arguing parties.

Then both HERO and CAA decided to independently computerize their databases. HERO added about four new engagements to their database, maybe corrected a few others, and the programmed it in a flat file called Reflex. It was 603 engagements (working off memory here) and called the LWDB (Land Warfare Data Base). CAA decided to computerize its version of 598 or 599 engagements and it was called the CHASE database. This became the CBD-90 that some people are still using. Neither of these versions included the extensive battle narratives as databases at that time could not handle large text files.

The computerized Reflex version of the LWDB was later purchased by Oak Ridge National Laboratories and published in the book by Dr. Dean Harley. It is a better version than the CBD-90. I did review the CBD-90 over twenty years ago. In the original database, there were a series of factors that were coded as to what degree they influenced the battle. In the CBD-90 about one-third of those factors (or one-third of the engagements that had those factors) – they were blanked out or mis-coded. It was a simple coding error, that as far as I know has never been corrected. 

In the meantime, around 1995 I decided we needed to reorganize and reprogram the database. We had a new database created by Jay Karamales in Access. It included text files. We loaded the old Reflex engagements in the database and then Susan Rich and I proofed the entire database back to the paper copies. Susan Rich then entered in all the narratives into the database. So this was now a complete and proofed version of the 1986 paper database. 

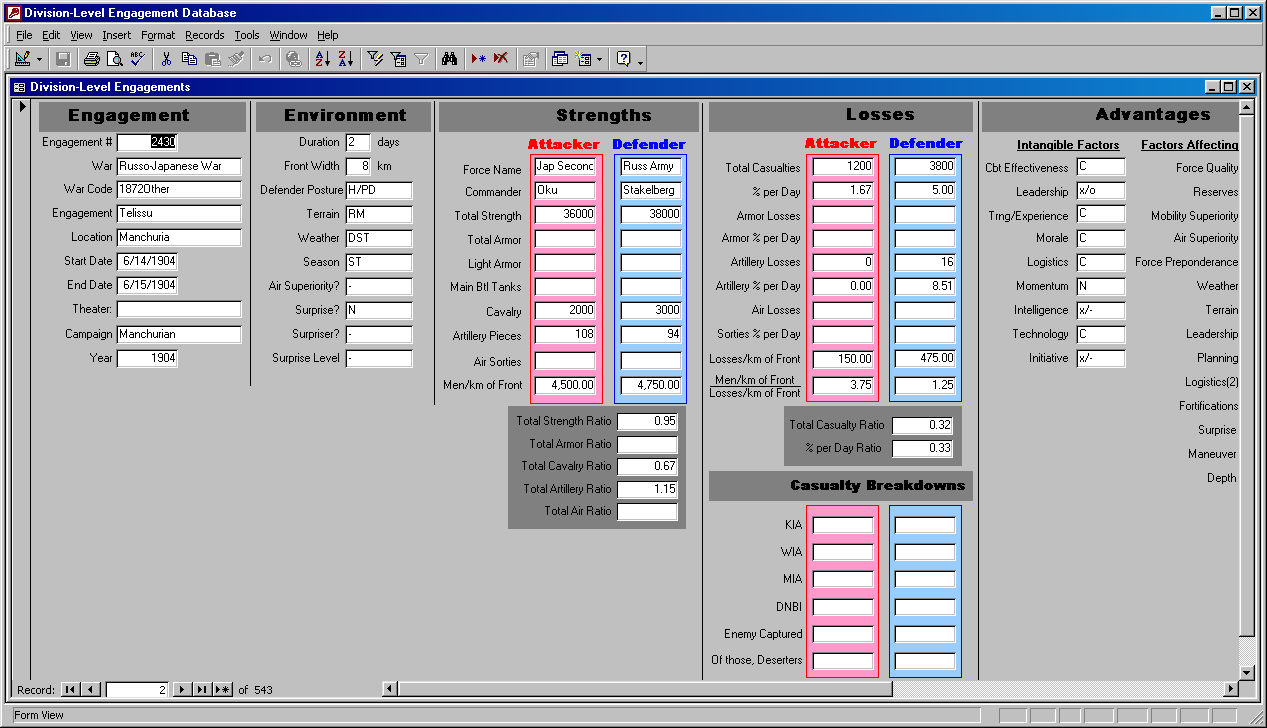
I then broke the database up. One of the problems with the original database is that it has engagements from 1600 next to engagements from 1973 next to a series of day-long division-level engagements from WWII next to some six-month long army-level engagements from the Great War next to battalion-level actions. While there are definitely some historical trends across all these, in some cases, depending on what you are analyzing, it is comparing apples to oranges. So, I took at mostly one-day battles from 1600-1900 and put them in a separate database (243 engagements – the  BaDB. I took all the large army-level engagements (like Battle of Verdun, Battle of the Somme) and put them into a Large Action Data Base – LADB. Basically, moved them out of the way. They were later used in part to help create the CaDB (Campaign Data Base). I put the smaller battalion-sized engagements into a separate battalion-level data base (BLODB). They left us with a core of around 300 engagements in a division-level database, mostly of 1-day engagements. All this work was done outside and independent of any contracted effort and therefore became a Dupuy Institute proprietary product. As with any proprietary product, you have to protect it.

We then expanded all these databases. In the case of the division-level database (the DLEDB), we ended up doing a series of studies for CAA on Enemy Prisoner of War capture rates in 1998-2001. We coded the division-level engagements by outcome and then using that to analyze capture rates based upon the outcomes of the battle. This effort included getting counts of the number captured and the number of deserters in each engagement. This is reports E-1 to E-8 here:  TDI – The Dupuy Institute Publications. The data used (but not the complete listing of the engagement) was included in appendices to these reports. CAA and the U.S. Army is still using these new rates.

We also added engagements to it from our urban warfare studies (CAA), reports U-1 to U-3. We used the database to analyze the urban versus non-urban combat. It was during that study we added engagements from the Channel Ports, Aachen and the three battles of Kharkov (1943). This study is discussed in two chapters in my book War by Numbers. We also took the time and put in 192 engagements from the Battle of Kursk (1943) based upon our work on the Kursk Data Base. All these Kursk engagements are listed (abbreviated) in my big Kusk: The Battle of Prokhorovka book. We also did a study on situational awareness for OSD Net Assessment (Andy Marshall’s old office). This is report SA-1 and also two chapters in my book War by Numbers. We ended up coding 295 division-level engagements based upon their knowledge of the enemy (by reviewing their intel reports of the divisions involved). We then reviewed what was the measurable combat advantage of improved situation awareness based upon real-world combat data. So, as in the EPW study, we took our original database and added additional filled-in fields so as to be able to do properly analyze the issue. This last expansion of the database was completed in 2004.

At that point, the division-level database had 752 cases in it. We had done some additional work on the old Italian Campaign engagements to clean them up and revise them. In particular Richard Anderson collected UK records from PRO and we cross-checked and revised all the UK engagements in the database and expanded the number of Italian Campaign engagements from about 70 to around 140. We then stopped work on the database in 2004.

During that time, we also expanded the battalion-level database to around 200 actions. We also had created a Campaign Data Base as part of our work, to examine operations above division-level and that last more than a few days. This was recently used for my presentation on Force Ratios that I gave at the second HAAC and in Norway in early November. See: The Schedule for the Second Historical Analysis Annual Conference (HAAC), 17 – 19 October 2023 | Mystics & Statistics (dupuyinstitute.org). In 2010 we created a small draft company-level database under contract with Boeing of 100 cases. A listing of most of these databases is here: TDI – The Dupuy Institute Publications. It does not include the company-level database, the Battle of Britain database nor the Dupuy Insurgency Spread Sheets (DISS) as we have not updated that page.

Obviously, people are going to ask: how can they get access to these databases. The answer is that you cannot until someone is willing to purchase them at a price that I willing to release them for. With the internet any single sale of the database will result in the release of the entire database to the world. So, any price would have to address the fact that these powerful and unique databases, which are proprietary to The Dupuy Institute, would be shared with the world. This includes potential business competitors. We still rely on contracts for our funding and these databases are part of our “product.” So, cost of giving away an exclusive competitive advantage? We would be willing to sell them to an organization if the price is right and they could then be publicly released. So far no one has made a significant concrete offer to us.


So other links:

Some Background on TDI Data Bases | Mystics & Statistics (dupuyinstitute.org)

Dupuy Institute Data Bases | Mystics & Statistics

Cost of Creating a Data Base | Mystics & Statistics (dupuyinstitute.org)

The Division Level Engagement Data Base (DLEDB) | Mystics & Statistics (dupuyinstitute.org)

Battalion and Company Level Data Bases | Mystics & Statistics (dupuyinstitute.org)

Other TDI Data Bases | Mystics & Statistics (dupuyinstitute.org)

Using the DLEDB:

Average Losses per Day in Division-level Engagements on the Eastern Front in 1943 | Mystics & Statistics (dupuyinstitute.org)

Density of Deployment in Ukraine | Mystics & Statistics (dupuyinstitute.org)

The U.S. Army Three-to-One Rule versus the 752 Case Division-level Data Base 1904-1991 | Mystics & Statistics (dupuyinstitute.org)

Comparing Force Ratios to Casualty Exchange Ratios | Mystics & Statistics (dupuyinstitute.org)

Comparing the RAND Version of the 3:1 Rule to Real-World Data | Mystics & Statistics (dupuyinstitute.org)

Summation of Force Ratio Posts | Mystics & Statistics (dupuyinstitute.org)

Amphitheater, 9 – 11 September 1943 | Mystics & Statistics (dupuyinstitute.org)

Amphibious and River Crossing Engagements in the Italian Campaign 1943-44 | Mystics & Statistics (dupuyinstitute.org)

The World War I Cases from the Division-level Database | Mystics & Statistics (dupuyinstitute.org)

The World War II Cases from the Division-level Database | Mystics & Statistics (dupuyinstitute.org)

Post-World War II Cases from the Division-level Database | Mystics & Statistics (dupuyinstitute.org)

Force Ratios in the Arab-Israeli Wars (1956-1973) | Mystics & Statistics (dupuyinstitute.org)

Other discussion:

Battles versus Campaigns (for Validation) | Mystics & Statistics (dupuyinstitute.org)

Validation Data Bases Available (Ardennes) | Mystics & Statistics (dupuyinstitute.org)

Validation Data Bases Available (Kursk) | Mystics & Statistics (dupuyinstitute.org)

Other Validation Data Bases | Mystics & Statistics (dupuyinstitute.org)

The Use of the Two Campaign Data Bases | Mystics & Statistics (dupuyinstitute.org)

Measuring the Effects of Combat in Cities, Phase II – part 1 | Mystics & Statistics (dupuyinstitute.org)

Presentations from HAAC – Urban Warfare | Mystics & Statistics (dupuyinstitute.org)

The Battle of Britain Data Base | Mystics & Statistics (dupuyinstitute.org)

Presentations from HAAC – Data for Wargames | Mystics & Statistics (dupuyinstitute.org)

The U.S. Army Three-to-One Rule versus 243 Battles 1600-1900 | Mystics & Statistics (dupuyinstitute.org)

The U.S. Army Three-to-One Rule versus 49 U.S. Civil War battles | Mystics & Statistics (dupuyinstitute.org)

Using the CBD:

The Key to Victory: Machine Learning the Lessons of History | Mystics & Statistics (dupuyinstitute.org)

Presentations from HAAC – Machine Learning the Lessons of History | Mystics & Statistics (dupuyinstitute.org)

There is more….

Phalanx Article: What We Have Learned from Doing Historical Analysis | Mystics & Statistics (dupuyinstitute.org)

Three books to be published this year

I have been quiet about the books that I am working on and publishing because some of them have been slower to release than expected.

I have three books coming out this year. The UK hardcover release dates are:

Aces at Kursk: 30 July 2023
The Battle of Kyiv: 30 August 2023
The Hunting Falcon: 30 September 2023

The U.S. hardcover release dates according to Amazon.com are:

Aces at Kursk: 30 September 2023
The Battle of Kyiv: 30 October 2023
The Hunting Falcon: 31 October 2023

So for a brief moment in time I will be pumping out a book a month. I am currently working on two other books (they might be released in 2023) and I have one other listed on Amazon.com (UK) called “The Other Battle of Kursk” with a release date of 16 July 2024. This is the book “The Battle of Tolstoye Woods.” This has been discussed with the publisher and I may get it published in 2024.

Of course, the only way one gets a book done is to ignore everything else. If some people feel I should be responding in a timely manner to their emails or requests, there is a reason I have not been. Sorry. Three books coming out in one year is evidence that there is some validity to that.

Some relevant links related to Aces at Kursk:

Aces at Kursk – Chapter Listing | Mystics & Statistics (dupuyinstitute.org)

Aces at Kursk | Mystics & Statistics (dupuyinstitute.org)

Is this my last Kursk book? | Mystics & Statistics (dupuyinstitute.org): The answer is no. I will be working on (and maybe completing) The Battle of Tolstoye Woods in 2024.

145 or 10? | Mystics & Statistics (dupuyinstitute.org)

So did Kozhedub shoot down 62, 64 or 66 planes? | Mystics & Statistics (dupuyinstitute.org)

5th Guards Fighter Regiment, 7 July 1943 | Mystics & Statistics (dupuyinstitute.org)

The 728th Fighter Regiment on 16 July 1943 | Mystics & Statistics (dupuyinstitute.org)

Soviet versus German kill claims at Kursk | Mystics & Statistics (dupuyinstitute.org)

So What Was Driving the Soviet Kill Claims? | Mystics & Statistics (dupuyinstitute.org)

Aces at Kursk – Chapters | Mystics & Statistics (dupuyinstitute.org)

And related to The Battle for Kyiv: most of this blog from December 2021 through April 2022:

December | 2021 | Mystics & Statistics (dupuyinstitute.org)

January | 2022 | Mystics & Statistics (dupuyinstitute.org)

February | 2022 | Mystics & Statistics (dupuyinstitute.org)

March | 2022 | Mystics & Statistics (dupuyinstitute.org)

April | 2022 | Mystics & Statistics (dupuyinstitute.org)

And related to Hunting Falcon:

Award Dates for the Blue Max (1916) | Mystics & Statistics (dupuyinstitute.org)


Advance Rates in Combat

M4A3E2

Advance Rates in Combat:

                Units maneuver before and during a battle to achieve a more favorable position. This maneuver is often unopposed and is not the subject of this discussion. Unopposed movement before combat is often quite fast, although often not as fast as people would like to assume. Once engaged with an opposing force, the front line between them also moves, usually moving forwards if the attacker is winning and moving backwards for the defender if he is losing or choosing to withdraw. These are opposed advance rates. This section is focused on discussing opposed advance rates or “advance rates in combat.”

            The operations research and combat modeling community have often taken a short-hand step of predicting advance rates in combat based upon force ratios, so that a force with a three-to-one force ratio advances faster than a force with a two-to-one force ratio. But, there is not a direct relationship between force ratios and advance rates. There is an indirect relationship between them, in that higher forces ratios increased the chances of winning, and winning the combat and the degree of victory helps increase advance rates. There is little analytical work that has been done on this subject.[1]

            Opposed advance rates are very much influenced by 1) terrain, 2) weather and 3) the degree of mechanization and mobilization, in addition to 4) the degree of enemy opposition. These four factors all influence what the rates will be.

            In a study The Dupuy Institute did on enemy prisoner of war capture rates, we ended up coding a series of engagements by outcome. This has proven to a useful coding for the examination of advance rates. Engagements codes as outcomes I and II (limited action and limited attack) are not of concern for this discussion. The engagement coded as attack fails (outcome III) is significant, as these are cases where the attacker is determined to have failed. As such they often do not advance at all, sometimes have a very limited advance and sometimes are even pushed back (have a negative advance). For example, in our work on the subject, of our 271 division-level engagements from Western Europe 1943-45 the average advance rate was 1.81 kilometers per day. For Eastern Europe in 1943 the average advance rate was 4.54 kilometers per day based upon 173 division-level engagements.[2] These advance rates are irrespective of what the force ratios are for an engagement.

            In contrast, in those engagements where the attacker is determined to have won and is coded as attacker advances (outcome IV) the attacker advances an average of 2.00 kilometers in the 142 engagements from Western Europe 1943-45. The average force ratio of these engagements was 2.17. In the case of Eastern Europe in 1943, the average advance rate was 5.80 kilometers based upon 73 engagements. The average force ratio of these engagements was 1.62.

            We also coded engagements where the defender was penetrated (outcome V). These are those cases where the attacker penetrated the main defensive line of the defending unit, forcing them to either withdraw, reposition or counterattack. This penetration is achieved by either overwhelming combat power, the end result of an extended operation that finally pushes through the defenses, or a gap in the defensive line usually as a result of a mistake. Superior mechanization or mobility for the attacker can also make a difference. In those engagements where the defender was determined to have been penetrated the attacker advanced an average of 4.12 kilometers in 34 engagements from Western Europe 1943-45. The average force ratio of these engagements was 2.31. In the case of Eastern Europe in 1943, the average advance rates was 11.28 kilometers based upon 19 engagements. The average force ratio of these engagements was 1.99.

            This clearly shows the difference in advance rate based upon outcome. It is only related to force ratios to the extant the force ratios are related to producing these different outcomes.


            Also of significance is terrain and weather. Needless to say, significant blocking obstacles like bodies of water, can halt an advance and various rivers and creeks often considerably slow them, even with engineering and bridging support. Rugged terrain is more difficult to advance through and easier to defend and delay then smoother terrain. Closed or wooded terrain is more difficult to advance through and easier to defend and delay then open terrain. Urban terrain tends to also slow down advance rates, being effectively “closed terrain.” If it is raining then advance rates are slower than in clear weather. Sometimes considerably slower in heavy rain. The season it is, which does influence the amount of daylight, also affects the advance rate. Units move faster in daylight than in darkness. This is all heavily influenced by the road network and the number of roads in the area of advance.

            No systematic study of advance rates has been done by the operations research community. Probably the most developed discussion of the subject was the material assembled for the combat models developed by Trevor Dupuy. This included addressing the effects of terrain and weather and road network on the advance rates. A combat model is an imperfect theory of combat.

            Even though this combat modeling effort is far from perfect and fundamentally based upon quantifying factors derived by professional judgment, tables derived from this modeling effort have become standard presentations in a couple of U.S. Army and USMC planning and reference manuals. This includes U.S. Army Staff Reference Guide and the Marine Corps’ MAGTF Planner’s Reference Manual.[3]

The original table, from Numbers, Predictions and War, is here:[4]


STANDARD (UNMODIFIED) ADVANCE RATES


                                                                                    Rates in km/day

                                                Armored          Mechzd.          Infantry           Horse Cavalry

                                                Division           Division           Division           Division or

                                                                                                or Force           Force

Against Intense Resistance

    (P/P: 1.0-1.1O)

Hasty defense/delay                4.0                   4.0                   4.0                   3.0

Prepared defense                    2.0                   2.0                   2.0                   1.6

Fortified defense                     1.0                   1.0                   1.0                   0.6


 Against Strong/Intense Resistance

    (P/P: 1-11-125)

Hasty defense/delay                5.0                   4.5                   4.5                   3.5

Prepared defense                    2.25                 2.25                 2.25                 1.5

Fortified defense                     1.25                 1.25                 1.25                 0.7


Against Strong Defense

    (P/P: 1.26-1.45)

Hasty defense/delay                6.0                   5.0                   5.0                   4.0

Prepared defense                    2.5                   2.5                   2.5                   2.0

Fortified defense                     1.5                   1.5                   1.5                   0.8


Against Moderate/Strong Resistance

    (P/P: 1.46-1.75)

Hasty defense                         9.0                   7.5                   6.5                   6.0

Prepared defense                    4.0                   3.5                   3.0                   2.5

Fortified defense                     2.0                   2.0                   1.75                 0.9


Against Moderate Resistance

    (P/P: 1.76-225)

Hasty defense/delay                12.0                 10.0                 8.0                   8.0

Prepared defense                    6.0                   5.0                   4.0                   3.0

Fortified defense                     3.0                   2.5                   2.0                   1.0


Against Slight/Moderate Resistance

    (P/P:2.26-3.0)

Hasty defense/delay                16.0                 13.0                 10.0                 12.0

Prepared defense                    8.0                   7.0                   5.0                   6.0

Fortified defense                     4.0                   3.0                   2.5                   2.0


Against Slight Resistance

    (P/P: 3.01-4.25)

Hasty defense/delay                20.0                 16.0                 12.0                 15.0

Prepared defense                    10.0                 8.0                   6.0                   7.0

Fortified defense                     5.0                   4.0                   3.0                   4.0


Against Negligible/Slight Resistance

    (P/P:4.26-6.00)

Hasty defense/delay                40.0                 30.0                 18.0                 28.0

Prepared defense                    20.0                 16.0                 10.0                 14.0

Fortified defense                     10.0                 8.0                   6.0                   7.0


Against Negligible Resistance

    (P/P: 6.00 plus)

Hasty defense /delay               60.0                 48.0                 24.0                 40.0

Prepared/fortified defense      30.0                 24.0                 12.0                 12.0


*Based on HERO studies: ORALFORE, Barrier Effectiveness, and Combat Data Subscription Service.

** For armored and mechanized infantry divisions, these rates can be sustained for 10 days only; for the next 20 days standard rates for armored and mechanized infantry forces cannot exceed half these rates.


                This is a modeling construct built from historical data. These are “unmodified” rates. The modifications include: 1) General Terrain Factors (ranging from 0.4 to 1.05 for Infantry (combined arms) Force and from 0.2 to 1.0 for Cavalry or Armored Force, 2) Road Quality Factors (addressing Road Quality from 0.6 to 1.0 and Road Density from 0.6 to 1.0), 3) Obstacles Factors (ranging from 0.5 to 0.9 for both a River or steam and for Minefields), 4) Day/Night with night advance rate one-half of daytime advance rate and 5) Main Effort Factor (ranging from 1.0 to 1.2). These last five sets of tables are not shown here, but can be found in his writings.[5]


[1] The most significant works we are aware of is Trevor Dupuy’s ORALFORE study in 1972: Opposed Rates of Advance in Large Forces in Europe (ORALFORE), (TNDA, for DCSOPS, 1972); Trevor Dupuy’s 1979 book Numbers, Predictions and War; and a series of three papers by Robert Helmbold (Center for Army Analysis): “Rates of Advance in Land Combat Operations, June 1990,” “Survey of Past Work on Rates of Advance, and “A Compilation of Data on Rates of Advance.”

[2] See paper on the subject by Christopher A. Lawrence, “Advance Rates in Combat based upon Outcome,” posted on the blog Mystics & Statistic, April 2023. In the databases, there were 282 Western Europe engagements from September 1943 to January 1945. There were 256 Eastern Front engagements from February, March, July and August of 1943.

[3] See U.S. Army Staff Reference Guide, Volume I: Unclassified Resources, December 2020, ATP 5-0.2-1, pages xi and 220; and MAGTF Planner’s Reference Manual, MSTF pamphlet 5-0.3, October 2010, page 79. Both manuals include a table for division-level advances which is derived from Trevor Dupuy’s work, and both manuals contain a table for brigade-level and below advances which are calculated per hour that appear to also be derived from Trevor Dupuy’s division-level table. The U.S. Army manual gives the “brigade and below” advance rates in km/hr while the USMC manual, which appears to be the same table, gives the “brigade and below” advance rates in km/day. This appears to be a typo.

[4] Numbers, Predictions and War, pages 213-214. The sixth line of numbers, three numbers were changes from 1.85 to 1.25 as this was obviously a typo in the original.

[5] See Numbers, Predictions and War, pages 214-216.


The actual paper this was drawn from is here: Advance Rates in Combat

Average Losses per Day in Division-level Engagements on the Eastern Front in 1943

Trevor N. Dupuy, among his 56 verities of combat, states that “Average World War II division engagement casualty rates were 1-3% a day.”[1]

This was based primarily on his research on the Western Front during World War II. For example, just to draw from data from real world experience, the average losses per U.S. division in 82 selected engagements was 1.2% per day in 1943-44. The average strength of these divisions was 14,000. The average loss per German division in 82 selected engagements was 1.8% per day. The average strength of these divisions was 12,000. These engagements were all from the Italian Campaign and the European Theater of Operations (primarily France).[2]

Now for Germany versus the Soviet Union, the loss rates in 1943 were higher for both sides. We do have daily unit records and have assembled them into a series of 192 division-level engagements for the southern part of Battle of Kursk in July 1943 and 64 division-level engagements for the battles around Kharkov in February, March and August of 1943. They show the following statistics:[3]

Battle of Kursk:

                                                            Average Losses:            Average           Average

                                             Cases     Mean     Median             Strength          Force Ratio

Germans attacking               124         0.99        0.78                21,487               1.44

Germans defending                68         0.68        0.52               16,945                0.91

Soviets attacking                    68         3.25        1.67               18,631                1.10

Soviets defending                 124         4.31        3.82               14,930                0.69


Battles for Kharkov:

Germans attacking                 35         0.58        0.48                17,326                2.77

Germans defending                29         0.64        0.50                14,834                0.87

Soviets attacking                    29         2.18        1.56                 17,001               1.15

Soviets defending                   35         5.21        3.05                  6,837                0.36


Slightly different figures will be created using differing selection criteria, but out of the 124 cases of the Germans attacking at Kursk, in only two cases were German losses greater than 3% [4]. They were both cross-river attacks done on 5 July 1943 by the 106th and 320th Infantry Divisions. German losses at Kursk while defending never exceeded 3%. German losses in the Kharkov engagements never exceeded 2% a day.

Soviet losses exceeded 3% per day in 24 cases while attacking at Kursk and exceeded 6% in ten of those cases. Soviet losses exceeded 3% per day in 67 cases while defending at Kursk (in over half the cases) and exceeded 6% in 39 of those cases. Soviet losses exceeded 3% a day in only two cases while attacking at Kharkov and in 16 cases while defending, of which in seven of those cases Soviet losses exceeded 6% per day.


[1] See Colonel Trevor N. Dupuy, Understanding War: History and Theory of Combat (Paragon House Publishers, New York, 1987), page 179.

[2] See Dupuy, Understanding War, page 169. Note that all these WWII engagements were tagged with the note that the data was approximate, more research required. The Dupuy Institute has 282 division-level engagements from the Italian Campaign and ETO that are created from the unit records of both sides. We have not done this comparison using our further developed and more extensive data collection, but suspect the results would be similar.

[3] The data used for this calculation is presented for the Battle of Kursk in a series of 192 engagement sheets in the book by Lawrence, Kursk: The Battle of Prokhorova. This work can be cross-checked by others. The data used for the battles around Kharkov have not been published yet. It might be at some point in the future. The data is currently company proprietary of The Dupuy Institute.

[4] More precise would be to remove all the engagements coded as limited action and limited attack, leaving only those coded as failed attack, attack advances, defender penetrated, defender enveloped and other. In the 124 Kursk cases of the German attacking this would remove 15 cases of limited action, 14 cases of limited attack, and 26 cases where the outcome has not been coded yet. The force ratio is now up to 1.56-to-1 and the average German percent losses are 1.25% while the average Soviet percent losses are 5.83%. Conversely, in the 68 cases where the Soviet are attacking, there are 7 cases are limited action, 9 cases are limited attack and 33 cases where the outcome has not been coded yet. The force ratio for these remaining 19 cases is 1.27 and average Soviet percent losses are 4.05 while the average German percent losses are 0.86.

 In all cases, the mean is calculated as a weighted mean, meaning that it is based upon total strengths compared to total losses. The median is calculated, naturally, by finding the midpoint of all 124 or 68 engagements.


The actual paper this was drawn from is here: Average Losses per Day

Presentations from HAAC – Fitting Lanchester Equations

The third presentation of the first day was given by Dr. Tom Lucas of the Naval Post-Graduate School (49 slides):  Fitting Lanchester equations to time-phased battle data

The two of the databases used for this work were the Ardennes Campaign Simulation Data Base (ACSDB) and the Kursk Data Base (KDB). I was the program manager for both of these efforts.

———-

We had a total of 30 presentations given at the first Historical Analysis Annual Conference (HAAC). We have the briefing slides from most of these presentations. Over the next few weeks, we are going to present the briefing slides on this blog, maybe twice a week (Tuesdays and Thursday). In all cases, this is done with the permission of the briefer. We may later also post the videos of the presentations, but these are clearly going to have to go to another medium (Youtube.com). We will announce when and if these are posted.

The briefings will be posted in the order given at the conference. The conference schedule is here: Schedule for the Historical Analysis Annual Conference (HAAC), 27-29 September 2022 – update 16 | Mystics & Statistics (dupuyinstitute.org)

The conference opened with a brief set of introductory remarks by me. The seven supporting slides are here: Opening Presentation

It was then followed by a briefing by Dr. Shawn Woodford on Studying Combat; The “Base of Sand” Problem: 20220927 HAAC-Studying Combat

The second presentation of the first day was given by me. It is here (45 slides): Data for Wargames (Summary) – 2

Some Background on TDI Data Bases

The Dupuy Institute (TDI) are sitting on a number of large combat databases that are unique to us and are company proprietary. For obvious reasons they will stay that way for the foreseeable future.

The original database of battles came to be called the Land Warfare Data Base (LWDB). It was also called the CHASE database by CAA. It consisted of 601 or 605 engagements from 1600-1973. It covered a lot of periods and lot of different engagement sizes, ranging from very large battles of hundreds of thousand a side to small company-sized actions. The length of battles range from a day to several months (some of the World War I battles like the Somme).

From that database, which is publicly available, we created a whole series of databases totaling some 1200 engagements. There are discussed in some depth in past posts.

Our largest and most developed data is our division-level database covering combat from 1904-1991 of 752 cases: It is discussed here: The Division Level Engagement Data Base (DLEDB) | Mystics & Statistics (dupuyinstitute.org)

There are a number of other databases we have. They are discussed here: Other TDI Data Bases | Mystics & Statistics (dupuyinstitute.org)

The cost of independently developing such a database is given here: Cost of Creating a Data Base | Mystics & Statistics (dupuyinstitute.org)

Part of the reason for this post is that I am in a discussion with someone who is doing analysis based upon the much older 601 case database. Considering the degree of expansion and improvement, including corrections to some of the engagements, this does not seem a good use of their time., especially as we have so greatly expanded the number engagements from 1943 and on.

Now, I did use some of these databases for my book War by Numbers. I am also using them for my follow-up book, currently titled More War by Numbers. So the analysis I have done based upon them is available. I have also posted parts of the 192 Kursk engagements in my first Kursk book and 76 of them in my Prokhorovka book. None of these engagements were in the original LWDB. 

If people want to use the TDI databases for their own independent analysis, they will need to find the proper funding so as to purchase or get access to these databases. 

The Soviet General Staff study on Kursk compared to Unit Records (part 3 of 3 – Conclusions)

What we did was a simple comparison of the Soviet General Staff study data on the air fighting in the south compared to the daily records we gathered from the Second and Seventeenth Air Armies. What we found was their were minor differences in the sortie counts, but overall that was close to what was reported in the unit records we had.

On the other hand, the reports on casualties was not. There were outrageously incorrect estimations of enemy losses, which is typical of Soviet accounts. But as significant, the reports of their own losses were low. In particular, our count of Second Air Army losses from 5-18 July was 481, their count was 371. This Soviet General Staff study only reported 77% of their losses. Does this mean that if I draw losses reports from the Sixteenth Air Army from the Soviet General Staff study (as I don’t have the unit records), should I “inflate” them by 30%? (the inverse of 0.77).

Added to that, they simply left out the Seventeenth Air Army losses (182 aircraft). It may have been an oversight or a deliberate effort to downplay their losses.

But, just to focus on the Second Air Army losses, the staff study has the total losses for the 5th – 18th as 371: 172 fighters, 31 bombers, and 168 assault. We have the Second Air Army’s losses for 5 to 18 July 1943, taken from their daily reports, as 481 (See Table IV.32 of Kursk: The Battle of Prokhorovka). This includes 248 fighters, 48 bombers, 180 assault and 5 night bombers. So actual losses of the Second Air Army were 30% higher than what was reported in the Soviet General Staff study, or 28% if one leaves out the night bombers.

One does wonder about the process where even the internal classified post-operation staff studies understate their losses (in addition to many other errors). They did have the unit records available to them. In particular, their table is vastly off on the 5th of July when the Second Air Army lost 114 planes and the Soviet General Staff study reports only 78, but it consistently underreports for every single day. They also do not report the losses for the Seventeenth Air Army, which according to our count was another 182 or 221 planes lost (see Tables IV.34 and Tables IV.35). This does argue that the reported losses for the Sixteenth Air Army may be low compared to reality.

In the bigger picture, the Soviet General Staff studies are secondary sources, not primary sources. Furthermore they are secondary sources with considerable bias and errors. They invariably (grossly) overplay German losses and seemed to try to minimize their own losses. Furthermore their narrative of accounts often downplays certain aspects of their operations. They do have be used with extreme caution, as opposed to treating them as somewhat authoritative.

Now, Niklas Zetterling & Anders Frankson offer a similar discussion of the problems of relying on the Soviet General Staff studies in their book The Korsun Pocket: The Encirclement and Breakout of a German Army in the East, 1944. It is clear that these are secondary sources with biases that must be used with considerable caution.

The Soviet General Staff study on Kursk compared to Unit Records (part 2 of 3 – Airplane Losses)

This is the second part of my comparison of the data provided in the Soviet General Staff study on Kursk that was prepared in March-April 1944 compared to the Second and Seventeenth Air Army records that I have.

Losses:

            There are one table on losses in the Soviet General Staff study on Kursk that relate to the Second and Seventeenth Air Army. They are provided below. I have broken it into two tables for this blog:

The Air Struggle Along the Enemy’s Main Axis

                             Air          Enemy Losses:

                             Battles   Fighter   Bomber  Total

5 July                       81           71           83         154

6 July                       64           40           65         105 

7 July                       74           44           78         122  

8 July                       65           54           52         106

9 July                       62           49           22           71

10-14 July              152         112           93         205

15-18 July               43           45           27           72

Totals                     541         415         420         835


                            Second Air Army Losses:   

                            Fighter  Bomber  Assault   Total

5 July                       36           15           27           78

6 July                       23           —             22           45

7 July                       24           —             13           37

8 July                       24             1           16           41

9 July                       16             1           15           32

10-14 July                49           14           75         138

15-18 July              (the figures in the line above cover from 10-18 July)  

Totals                       172           31         168         371

            Now, these figures have been discussed before. The losses of the German VIII Air Corps was 111 planes, vice the 835 claimed here. The losses of the Second Air Army according to the records we reviewed was 481 planes from 5 to 18 July: see Appendix IV, Table II.32 (page 1424) of Kursk: The Battle of Prokhorovka), vice the 371 reported here. This report also does not include Seventeenth Air Army claims or losses. The Seventeenth Air Army’s losses were significant (182 planes). So, it does appear that the Soviet General Staff study basically leaves out 292 out of their 663 airplanes losses (44% of their losses), effectively under reporting their air losses by almost half.

       This is concerning, for it does appear that Soviet General Staff study is understating the Second Air Army losses, omitting the considerable losses from the Seventeenth Air Army and of course, grossly overclaiming the number of German aircraft shot down. This was in an internal classified report that was supposed to be an analysis of the battle. Hard to properly analyze if your data is not correct.

The Soviet General Staff study on Kursk compared to Unit Records (part 1 of 3 – Sortie Counts)

Yak-9 at war memorial, northeast of Yakovlevo, Belrorod-Oboyan road

For my on-going Aces at Kursk book I was asked by the publishers to include a Chapter on the air war in the north from 5-11 July 1943. For the original Kursk project we were able to access the Second and Seventeenth Air Army records in the south. We did not attempt to obtain the Sixteenth Air Army records at that time (1993-1995). Therefore I was forced to rely on the Soviet General Staff study on Kursk that was prepared in March-April 1944 for the count of sorties and losses. As the staff study also reported the sorties and losses from the south, and I had the records for the air armies involved in that, I decided to do a little comparison and added a write-up of this to an appendix of the book.

Sortie Counts (I left out the table of the sortie count from Soviet General Staff study) :

          The Soviet General Staff study data on sortie counts is similar to the data we have assembled. The data we have for the Second and Seventeenth Air Armies operations are taken directly from the daily air army reports as drawn from the archives. The Soviet General Staff study may used these same reports, or used higher level reports or other assembled reports for their study. But there are minor differences between ours and their reports, so most likely they used other higher level or assembled reports for their study. For example, we have the Second Air Army flying 1,296 daytime sorties on 5 July. The Soviet General Staff study has them flying 1,274. There are also minor differences the next two days, but the two sets of counts are the same for 8 and 9 July and then vary slightly for most of the subsequent days (except for the 15th and 16th, where they again match). After the 5th, the largest difference is on the 12th, where our reports record 10 more daytime sorties. These are very minor differences. The Second Air Army nighttime sorties match in all cases between the counts we assembled from the air army daily reports and what the Soviet General Staff study reports.

            The Seventeenth Air Army is a little more complex as some of their missions were flown into the battle area while other of their missions were flown completely out of the battle area defended by the Voronezh Front. For the Kursk database project, I ended up reviewing each reported mission as to where it operated and made a judgment as to whether this mission was in the area of the Belgorod offensive or not. It does not appear that the Soviet General Staff study did that. For the 5th through the 16th, their estimate more closely matches with the total number of sorties flown by the Seventeenth Air Army than it does with my lower count of the number of sorties flown in the battle area. On eight of those 12 days in question, their totals matches the total we drew from the Seventeenth Air Army daily reports. The day they most differ was on 7 July when they reported 50 more sorties than we counted. We did re-check the original report and our total is 639. Suspect their number of 689 is a typo. As the Soviet General Staff study may have been drawn from a later aggregate report, there are multiple opportunities for typos.

           On the other hand, in the table we assembled of Seventeenth Air Army daytime sorties we had a lower count for “only those that were in the Belgorod Area or attacked the VIII Air Corps” (see table in Chapter Four). It is consistently lower from the 5th through the 16th, which the worse variance being on the 7th, where we count 588 as valid sorties in the battle area, whereas the Soviet General Staff study reports 689. On the 17th we count none in the area and on the 18th we count 12 sorties.

           Still there are a couple of observations we can make from this comparison. First, is that the Soviet General Staff study reports of Soviet sorties flown is fairly accurate in that it matches with records we have from the Second and Seventeenth Air Armies. This is important to note as we rely on the Soviet General Staff study for the count of sorties for the Sixteenth Air Army.

TDI and the TNDM

The Dupuy Institute does occasionally make use of a combat model developed by Trevor Dupuy called the Tactical Numerical Deterministic Model (TNDM). That model is a development of his older model the Quantified Judgment Model (QJM). 
 
There is an impression, because the QJM is widely known, that the TNDM is heavily involved in our work. In fact, over 90% of our work has not involved the TNDM. Here a list of major projects/publications that we done since 1993.
 
Based upon TNDM:
Artillery Suppression Study – study never completed (1993-1995)
Air Model Historical Data feasibility study (1995)
Support contract for South African TNDM (1996?)
International TNDM Newsletter (1996-1998, 2009-2010)
TNDM sale to Finland (2002?)
FCS Study – 2 studies (2006)
TNDM sale to Singapore (2009)
Small-Unit Engagement Database (2011)
 
Addressed the TNDM:
Bosnia Casualty Estimate (1995) – used the TNDM to evaluate one possible scenario
Casualty Estimation Methodologies Study (2005) – was two of the six methodologies tested
Data for Wargames training course (2016)
War by Numbers (2017) – addressed in two chapters out of 20
 
Did not use the TNDM: 
Kursk Data Base (1993-1996)
Landmine Study for JCS (1996)
Combat Mortality Study (1998)
Record Keeping Survey (1998-2000)
Capture Rate Studies – 3 studies (1998-2001)
Other Landmine Studies – 6 studies (2000-2001)
Lighter Weight Armor Study (2001)
Urban Warfare – 3 studies (2002-2004)
Base Realignment studies for PA – 3 studies (2003-2005)
Chinese Doctrine Study (2003)
Situational Awareness Study (2004)
Iraq Casualty Estimate (2004-2005)
The use of chemical warfare in WWI – feasibility study (2005?)
Battle of Britain Data Base (2005)
1969 Sino-Soviet Conflict (2006)
MISS – Modern Insurgency Spread Sheets (2006-2009)
Insurgency Studies – 11 studies/reports (2007-2009)
America’s Modern Wars (2015)
Kursk: The Battle of Prokhorovka (2015)
The Battle of Prokhorovka (2019)
Aces at Kursk (2021)
More War by Numbers (2022?)
 
 
Our bread and butter was all the studies that “did not use the TNDM.” Basically the capture rate studies, the urban warfare studies and the insurgencies studies kept us steadily funded for year after year. We would have not been able to maintain TDI on the TNDM. We had one contract in excess of $100K in 1994-95 (the Artillery Suppression study) and our next TNDM related contract that was over $100K was in 2005.