(Standard rate in percent*) x (factor based on force size) x (factor based upon mission) x (opposition factor based on force ratios) x (day/night) x (special conditions**) = percent losses.
* Different for attacker (2.8%) and defender (1.5%)
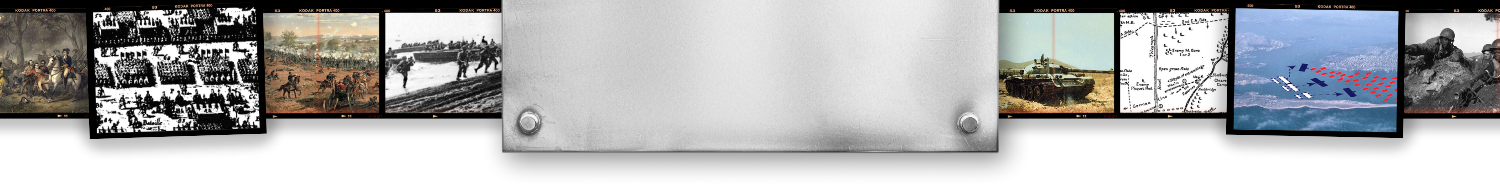
** WWI and certain forces in WWII and Korea
For the attacker the highest this percent can be in one day is 13.44% not counting the special conditions, and the highest it can be for the defender is 5.76%.
The current Tactical Numerical Deterministic Model (TNDM) methodology is:
(Standard personnel loss factor*) x (number of people) x (factor based upon posture/mission) x (combat effectiveness value (CEV) of opponent. up to 1.5) x (factor for surprise) x (opposition factor based on force ratios) x (factor based on force size) x (factor based on terrain) x (factor based upon weather) x (factor based upon season) x (factor based upon rate of advance) x (factor based upon amphibious and river crossings) x (day/night) x (factor based upon daily fatigue) = Number of casualties
* Different for attacker (.04) and defender (.06)
The special conditions mentioned in Numbers, Predictions, and War are not accounted for here, although it is possible to insert them, if required.
All these tables have been revised and refined from Numbers, Predictions, and War.
In Numbers, Predictions and War, the highest multiplier for size was 2.0, and this was for forces of less than 5,000 men. From 5,000 to 10,000 is 1.5 and from 10,000 to 20,000 is 1.0. This formulation certainly fit the data to which the model was validated.
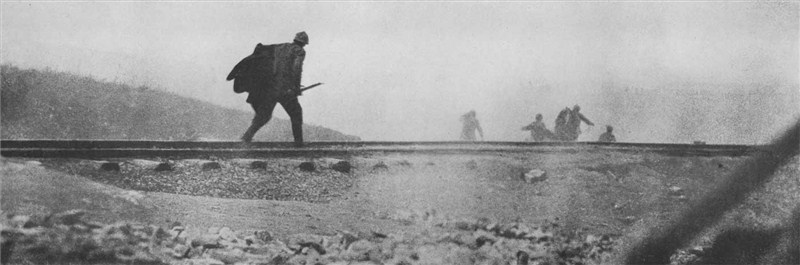
The TNDM has the following table for values below 15,000 men (which is 1.0):
The highest percent losses the attacker can suffer in a force of greater than 15,000 men in one day is “over” 100%. If one leaves out three large multipliers for special conditions—surprise, amphibious assault, and CEV—then the maximum percent losses is 18%. The multiplier for complete surprise is 2.5 (although this degraded by historical period), 2.00 for amphibious attack across a beach, and 1.5 for enemy having a noticeable superior CEVs In the case of the defender, leaving out these three factors, the maximum percent casualties is 21.6% a day.
This means at force strengths of less than 2,000 it would be possible for units to suffer 100% losses without adding in conditions like surprise.
The following TNDM tables have been modified from the originals in Numbers, Predictions, and War to include a casualty factor, among other updates (numbers in quotes refer to tables in the TNDM, the others refer to tables in Numbers, Predictions, and War):
As far as I can tell, Table “20”: Maximum Depth Factor has a very limited impact on the model outcomes. Table “1”: OLIs, has no impact on model outcomes
I have developed a bad habit, if I want to understand or know something about the TNDM, to grab my copy of Numbers, Predictions, and War for reference. As shown by these attrition calculations, the TNDM has developed enough from its original form that the book is no longer a good description of it. The TNDM has added in an additional level of sophistication that was not in the QJM.
The TNDM does not have any procedure for calculating combat from before 1900. In fact, the TNDM is not intended to be used in its current form for any combat before WWII.
I just heard that Charles Hawkins, or Chuck Hawkins, passed away September 13, 2019 in Ninilchik Alaska. He was born in 1946.
Chuck Hawkins joined Trevor Dupuy’s Data Memory Systems Inc. (DMSI) as a vice-president in 1988. He was a former army captain who fought in Vietnam with a strong interest in analysis of combat. He came into the organization while it was at its peak but was about to crash due to the deep budget cuts that occurred at the end of the Cold War. He struggled on with the collapsing DMSI until around 1992 and closed it down. He then continued work in the industry with a number of efforts, eventually becoming an expert on the North Korea. He spent some time at their border, which always produced a great slide show.
He also worked briefly with me in 1993 on the report I did on Federally Funded Research and Development Centers (FFRDCs) for the Congressional Office of Technology Assessment (OTA). A copy is here:
As a result of a comment by Tom from Cornwall, we ended up adding three posts to this discussion that looked at terrain and amphibious operations and river crossings in Italy:
The previous posts on this discussion on force ratios are presented here. These were the posts examining the erroneous interpretation of the three-to-one rule as presented in Army FM 6-0 and other publications:
We are going to end this discussion for now. There is some additional data from the European Theater of Operations (ETO) and Ardennes that we have assembled, but it presents a confusing picture. This is discussed in depth in War by Numbers (pages 32-48).
I am assembling these discussions on force ratios and terrain into the opening chapters for a follow-on book to War by Numbers.
This is Russia’s only carrier. It is in dock in Siberia undergoing refitting. It is supposed to be done in 2021…but this is doubtful. The Russian fleet is still extremely limited in capability.
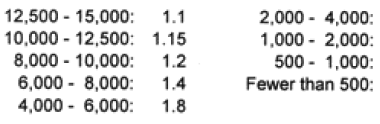
Polish Sherman III after battle on Gothic Line, Italy, September 1944
Having looked at casualty exchanges from my book War by Numbers and in the previous post, it is clear that there are notable differences between the German and Soviet armies, and between the Israeli and Arab armies. These differences show up in the force ratio tables, in the percent of wins, and in the casualty exchange ratios. As shown above, there is also a difference between the German and the U.S. and UK armies in Italy 1943-44, but this difference is no where to the same degree. These differences show up in the casualty exchange ratios. They also will show up in the force ratio comparisons that follow.
The Italian Campaign is an untapped goldmine for research into human factors. In addition to German, American and British armies, there were Brazilian, Canadian, French, French Algerian, French Moroccan, Greek, Indian, Italian, New Zealander, Polish, and South African forces there, among others like the Jewish brigade. There was also an African-American Division and a Japanese-American battalion and regiment actively engaged in this theater. Also the German records are much better than they were in the second half of 1944. So, the primary source data these engagements are built from are better than the engagements from the ETO.
We have 137 engagements from the Italian Campaign. There are 136 from 9 September to 4 June 1944 and one from13-17 September 1944. Of those, 70 consisted of the Americans attacking, 49 consisted of armed forces of the United Kingdom in the offense, and 18 consisted of the Germans attacks, often limited and local counterattacks (eight attacks against the United States and ten attacks against the UK). So, let us compare these based upon force ratios.
American Army attacking the German Army, Italy 1943-44
(70 cases in the complete data set, 62 cases in the culled data set)
Force Ratio……………Percent Attacker Wins………………..Number of Cases
There were seven cases of engagements coded as “limited attacks” and one case of “other”. These eight cases are excluded in the table above on those lines in italics.
Needless to say, this is a fairly good performance by the American Army, with them winning more than 40% the attacks below two-to-one and pretty winning most of them (86%) at odds above two-to-one.
British Army attacking the German Army, Italy 1943-44
(49 cases in the complete data set, 39 cases in the culled data set)
Force Ratio………………..Percent Attacker Wins………………..Number of Cases
There were five cases of limited action and five cases of limited attack. These ten cases are excluded in the table above on those lines in italics.
This again shows the difference in performance between the American Army and the British Army. This is always an uncomfortable comparison, as this author is somewhat of an anglophile with a grandfather from Liverpool; but data is data. In this case they won 44% of the time at attacks below two-to-one, which is similar to what the U.S. Army did. But then, they only won only 63% of the time at odds above two-to-one (using the culled data set). This could just be statistical anomaly as we are only looking at 30 cases, but is does support the results we are seeing from the casualty data.
What is interesting is the mix of attacks. For the American Army 77% of the attacks were at odds below two-to-one, for the British Army only 23% of the attacks were at odds below two-to-one (using the culled data sets). While these 99 cases do not include every engagement in the Italian Campaign at that time, they include many of the major and significant ones. They are probably a good representation. This does probably reflect a little reality here, in that the British tended to be more conservative on the attack then the Americans. This is also demonstrated by the British lower average loss per engagement.[7]
The reverse, which is when the Germans are attacking, does not provide a clear picture.
German Army attacking the American and British Army, Italy 1943-44 – complete data set (18 cases)
Force Ratio…………………..Percent Attacker Wins…………………Number of Cases
0.72 to 0.84………………………….0%………………………………………………7
1.17 to 1.48………………………..50…………………………………………………6
1.89…………………………………….0…………………………………………………1
2.16 to 2.20………………………..50…………………………………………………2
Gap in data
3.12 to 3.24………………………..50…………………………………………………2
The Germans only win in 28% of the cases here. They win in 13% of the engagements versus the U.S. (8 cases) and 40% of the engagements the UK (10 cases). Still, at low odds attacks (1.17 to 1.48-to-1) they are winning 50% of the time. They are conducting 78% of their attacks at odds below two-to-one.
In the end, the analysis here is limited by the number of cases. It is hard to draw any definitive conclusions from only 18 cases of attacks. Clearly the analysis would benefit with a more exhaustive collection of engagements from the Italian Campaign. This would require a significant investment of time (and money).[8]
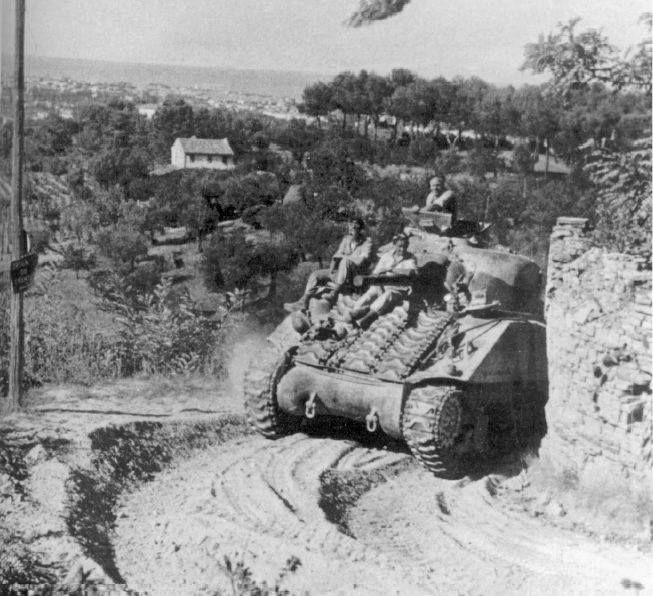
Regiment de Trois-Rivieres tanks entering the ruins of Regabuto, August 4th, 1943. Source: http://www.sfu.ca/tracesofthepast/wwii_html/it.htm
————————–
[1] There were four limited attacks that resulted in three defender wins and a draw. There was one “other” that was an attacker win.
[2] There three limited attacks that resulted in two defender wins and a draw.
[3] There were four “limited actions” that were defender wins and one “limited attack” that was a defender win.
[4] There as one “limited action” that was a defender win and two “limited attacks” that were defender wins.
[5] There were two “limited attacks” that were defender wins.
[6] The author’s grandfather was born in Liverpool and raised in Liverpool, England and Ryls, Wales. He served in the British merchant marine during World War I and afterwards was part of the British intervention at Murmansk Russia in 1918-1919. See the blog post:
[7] See War by Numbers, pages 25-27. The data shows that for the Americans in those 36 cases where their attack was successful they suffered an average of 353 casualties per engagement. For the 34 American attacks that were not successful they suffered an average of 351 casualties per engagement. For the UK, in the 23 cases where their attack was successful, the UK suffered an average of 213 casualties per engagement. Of the 26 cases where the UK attacks were not successful, they suffered an average of 137 casualties per engagement.
[8] Curt Johnson, the vice-president of HERO, estimated that it took an average of three man-days to create an engagement. He was involved in developing the original database that included about half of the 137 Italian Campaign engagements. My estimation parameter, including the primary source research required to conduct this is more like six days. Regardless, this would mean that just to create this 137 case database took an estimated 411 to 822 man-days, or 1.6 to 3.3 man-years of effort. Therefore, to expand this data set to a more useful number of engagements is going to take several years of effort.
Now, there were a few amphibious operations and major river crossing operations during the Italian Campaign. These are significant enough that we should examine them separately. Among the 141 Italian Campaign engagements there are three amphibious operations and 16 river crossing operations. These are outlined in our previous post:
This is a small number of cases, but does seem to show that the defender has an advantage when defending against amphibious assaults and river crossings. To compare them to the rest of the engagements:
Amphibious Operations Comparison – Italian Campaign 1943-44:
UK Attacking – River Crossing……8………….63………….67………..169………154
UK Attacking – other FM…………….6………….50………….67………..306………284
U.S. Attacking – River Crossing…..6…………67………….67…………388……..112
U.S. Attacking – Other RM………..17…………59………….76…………374……..477
German Attacking – River Crossing..2……….50………..100…………955………507
German Attacking – Other FM………5………..40………….40…………756………805
………………………………………….……………Force….Exchange
………………………………….……..Cases…….Ratio…..Ratio
UK Attacking – River Crossing……8……………2.20…….1.10-to-1
UK Attacking – other FM…………….6……………1.71…….1.08-to-1
U.S. Attacking – River Crossing…..6…………..1.47…….3.47-to-1
U.S. Attacking – Other RM………..17…………..1.72…….0.78-to-1
German Attacking – River Crossing..2…………1.96…….1.88-to-1
German Attacking – Other FM………5…………1.39……..0.94-to-1
Now this is a very small number of cases for comparison, and just for balance I tried to match it across similar terrain types.[1] Still, even with this very limited data, there appears to be a clear pattern. In every case the exchange ratio more favors the defender. In the case of amphibious operations, this either 2.51-to-1 or 0.79-to-1 compared to 3.98-to-1 for amphibious operations. For river crossings this is 1.08-to-1 compared to 1.10-to-1 for UK river crossings, 0.78-to-1 compared to 3.47-to-1 for U.S. river crossings (or 0.78-to-1 compared to 0.82-to-1 if the two Rapido River engagements are left out), and 0.94-to-1 compared to 1.88-to-1 for German river crossings. Obviously a whole lot more cases would need to be examined to establish anything with certainty, but there are not a lot of amphibious operations over river crossings coded in the ETO or Kursk/Kharkov sections of the database. It would require a significant research effort to assemble such data.
Of course, what this really all points to is that the data needs to be more tightly prescribed and a whole lot more cases need to be assembled.
———
[1] In the case of U.S./UK Attacking – Amphibious, one engagement was done by the U.S. and the other two by the UK. In the case of UK Attacking – River Crossing there were 7 cases in flat mixed terrain and 1 case of rolling mixed terrain. In the case of U.S. Attacking – River Crossing there were 3 cases of rolling mixed terrain, one case of Rugged Mixed, and two cases codes as FB/M, meaning the terrain varied from flat bare to flat mixed. In the case of German Attacking – River Crossing, both engagements were in flat mixed terrain but one was against the U.S. and the other was against the UK. In the case of German Attacking – Other FM two engagements were against the U.S. and three were against the UK.
In a previous post, there is an extended discussion of how much the terrain was influencing the results. One reader asked about amphibious operations and river crossings.
Among the 141 Italian Campaign engagements there are three amphibious operations and 16 river crossing operations.
Amphibious Operations – Italian Campaign 1943-44:
…………………………………………..Average..Average
………………………………Percent…Percent…Attacker..Defender
…………………..Cases….Wins…….Advance..Losses…Losses
UK attacking…3………..100……….100…………417………105
.
…………………………………Force….Exchange
…………………..Cases…….Ratio…..Ratio
UK attacking….3……………3.45…….3.98-to-1
River Crossings – Italian Campaign 1943-44:
…………………………………………..Average..Average
………………………………Percent…Percent…Attacker..Defender
…………………..Cases….Wins…….Advance..Losses…Losses
UK Attacking….8………..63…………67…………169……….154
US Attacking….6………..67…………67…………388……….112
….Less two ……………..100……….100………..122……….150
German………..2…………50……….100………..955……….507
.
…………………………………..Force….Exchange
…………………….Cases…….Ratio…..Ratio
UK Attacking……8…………..2.20…….1.10-to-1
U.S. Attacking….6…………..1.47…….3.47-to-1
….Less two…………………….1.63…….0.82-to-1
German…………..2…………..1.96…….1.88-to-1
The description of the headers is given in the previous post. The “Less two” row is less the two Rapido River engagements by the 36th Infantry Division on the 20th and 21st of January 1944. These were particularly bloody and lopsided engagements (exchange ratios of 12-to-1 and 48-to-1 respectively).
Again, this is a small number of cases, but does seem to show that the defender has an advantage when defending against amphibious assaults and river crossings.
I have done some analysis of the terrain involved. Below are some figures for the German attacks based upon terrain:
Germans Attacking U.S. – Italian Campaign 1943-44:
…………………………………………..Average..Average
………………………………Percent…Percent…Attacker..Defender
…………………..Cases….Wins…….Advance..Losses…Losses
Rugged Mixed…..1………..0…………..0…………..250……….1617
Rolling Mixed……1…………0…………..0…………..769……….525
Flat Mixed………..3…………0…………33…………..647……….672
.
…………………………………Force….Exchange
…………………..Cases…….Ratio…..Ratio
Rugged Mixed…..1…………..0.72…….0.15-to-1
Rolling Mixed……1…………..0.84…….1.46-to-1
Flat Mixed………..3………….1.60……..0.96-to-1
.
Germans Attacking UK – Italian Campaign 1943-44:
……………………………………………………….Average..Average
………………………………Percent…Percent…Attacker..Defender
…………………..Cases….Wins…….Advance..Losses…Losses
Rugged Mixed…..3……….33…………33…………312……….623
Rolling Mixed…….3………..0…………..0………….250……….689
Flat Mixed…………4………75…………75………….938………755
.
……………………………..Force….Exchange
…………………Cases…..Ratio…..Ratio
Rugged Mixed…..3…………0.82…….0.50-to-1
Rolling Mixed…….3………..0.78…….0.36-to-1
Flat Mixed…………4……….1.38……..1.24-to-1
This is material that I am developing for a new book tentatively called More War by Numbers.
Anyhow, the terrain is as defined by Trevor Dupuy. What is interesting to look at is the flat mixed terrain compared to rugged and rolling.
Cases is the number of engagements. Needless to say, the number of cases in each category is way too low to be statistically significant….and this is from a data base of 141 cases (for Italy alone). Percent wins is based upon analyst coding of engagements. Percent advance is based upon a different analyst coding of engagements. In it possible that an engagement can be coded as “Attack Advances” and a “Defender” win. It does not happen in these 15 cases. Average attacker and defender losses is based upon the average losses per day (so losses in a multi-day engagement is divided by the number of days). The force ratio is the total strength of the attackers in all these selected engagements divided by the total strength of the defenders in all these selected engagements. The exchange ratio is the total losses of the attackers in all these selected engagements divided by the total losses of the defender in all these selected engagements.
So, for example, in flat mixed terrain there are three cases of the Germans attacking the Americans. The force ratio is 1.60-to-1 (averaged across these attacks) and the exchange ratio is less than one-to-one (0.96-to-1). On the other hand, in the four cases of the Germans attacking the Americans in flat mixed terrain, the weighted force ratio is 1.38-to-1 and the weighted loss ratio is 1.24-to-1, meaning the German attacker lost more than British defender.
I do have similar data for the Americans. It is also pretty confusing to interpret.