Mystics & Statistics

A blog on quantitative historical analysis hosted by The Dupuy Institute

Obscure Major Tank Battle on 9 July 1943

There is an extended discussion in my Kursk book called “The Reinforced 6th Panzer Division Crashes Forward” on pages 766-768.

There was a significant fight around the towns of Melikhovo and Shlyakhovoye in the III Panzer Corps sector on 9 July. The 6th Panzer Division had attached to it the panzer regiment from the 19th Panzer Division, the 503rd Heavy Panzer Battalion (Tiger) and the 228th Assault Gun Battalion.The Soviet defenders included the 305th Infantry Division, 92nd Guards Rifle Division and 96th Tank Brigade.

To quote:

This fighting must have been extremely deadly for the 6th Panzer Division, for it appears to have lost 38 of 73 tanks this day…The attached Tiger Battalion fared no better, with a loss of 19 of 33 tanks….The 228th Assault Gun Battalion was clearly in the middle of the fight also, indicating a loss of 12 Sturmgeschuetz IIIs of 23. The Panzer Group Westhoven, attached from the 19th Panzer Division, would also fair poorly, losing 30 tanks this day. This was a devastating loss of almost 100 tanks in one day!…

The unheralded day of fighting appears to have cost the III Panzer corps over 100 tanks and assault guns. This was not only the worst day of combat for the corps, but one of the worst for the Germans in the attack in the south….

To put this in perspective, the SS Panzer Corps’ worst day had been fewer than 80 tanks lost (on the 6th)…..Even at the famed Battle of Prokhorovka on the 12th of July, the SS Panzer Corps lost fewer tanks. While Rotmistrov and the Fifth Guards Tank Army became renown for this action, the fighting today (9 July) between Andreyevskiye and Melikhovo was truly unheralded, yet not mentioned in major histories of the battles and the Soviet defenders have not been singled out. 

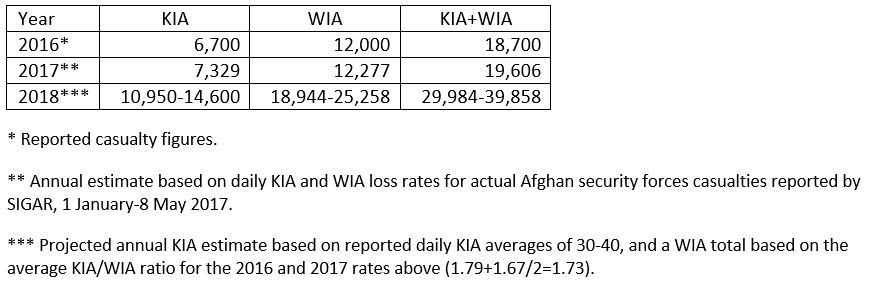
A few photos of the area:

The first is of the area northeast of Belgorod, showing where the Lipovyii and Severnyii Donets meet, 2 June 1943. The railroad on the left (west) goes to Prokhorovka. The two large villages in the south are Staryii Gorod and Blizhnyaya Igumenka while the three lrager villages in the north are Belomestnaya, Petrpavllovka, and Dalnayaya Igumenka  (see page 580). The small town of Andreyevskiye is on the river just to the north-northeast (1 km) of Blizhnyaya Igumenka. It is in the river just west of the woods north of Blizhnyaya Igumenka (the woods almost in the center of the map). Melikhovo is 4+ km to the northeast of the those woods. It is in the northeast corner of the picture, but hard to see in the darkened section. Shlyakhovoye is just beyond it.

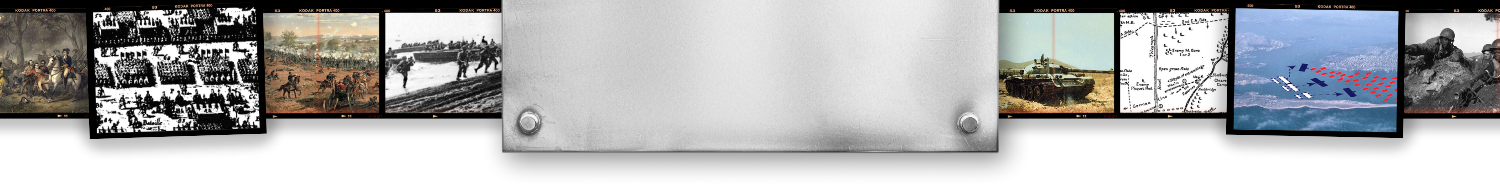
Next is Stayii Gorod, 3 July 1943. Note the trench works in the while area and elsewhere (see page 572).

Finally there is the close-up photo of the woods just south of Blizhnyaya Igumenka and east of Staryii Gorod, 7 July 1943. Note the trenchworks. This would be a second echelon defensive position. The same woods is visible in the previous photo east of Staryii Gorod (see page 573).


I have four engagement sheets covering the operation of the III Panzer Corps for this day (pages 770-773):

German        German        Soviet         German      Soviet    German       Soviet

Unit               Strength       Strength     Armor         Armor     Artillery       Artillery

168th ID          8,077           9,342          6                 0             48             111

19th PzD       19,347        10,179         13                0              161           107

6th PzD         22,792        16,241        158               54            143           151

7th PzD         19,355        19,658          52               28            127           171

Total              69,571        55,420        229               82            479           540


German        German        Soviet          German         Soviet

Unit               Casualties    Casualties  Tank Losses   Tank Losses

168th ID          98                 193                0                      0

19th PzD        472                935                6                      0

6th PzD          177             1,476               97                   13

7th PzD          367                270                 5                     0

Total            1,114             2,874             108                   13


This was very heavy tank losses for a single day of combat, yet there is no one who discusses it. Is there something about this day that I have mis-interpreted?

Population over Time (US vs USSR)

Over last decades, the population of major countries like China, India, Soviet Union/ Russia, Japan, Germany and the United States have changed. This has clearly changed the balance of power between them and will continue to as we move forward into the future. For example:

Unite States versus Soviet Union:

                                              Soviet Union/

Year           United States      Russia                    Ratio

1950/51      151.3 (1950)        182.3 (1951)           0.83-to-1

1980/82      226.5 (1980)        270.0 (1982)           0.84-to-1

2018           308.7                    142.9                      2.16-to-1

2050           402                       132                         3.05-to-1


Now, this is certainly the biggest change we will look at. Russia went from almost being a world power to being a pale reflection of its past power and glory (I am willing to argue that the Soviet Union was never really a world power….it just pretended to be one). Added to that is the economic changes over time. I hesitate to even discuss what the GDP of the Soviet Union was, as the ruble was artificially inflated. When it was floated in the 1990s, it went from one ruble per 1.11 dollars (it always was worth more than a dollar in the Soviet era, of course)…to something like 3,000 rubles to a dollar. They then shaved off two the zeros for the new ruble to make it less than 30 rubles to a dollar. The current exchange rate is 65 rubles to a dollar.

The current Russian GDP is 1.5 trillion (IMF 2017). This is compared to the United States GDP of 19.4 trillion (IMF 2017). So, right now, Russia has less than half the population and less than a tenth of the economy of the United States. In 2050 it will have only a third of the population of the U.S. Who knows what the economy will be. The Russia economy might still be pretty dependent on the price of oil.

With its population declining, its work force aging, its economy built upon export of oil and gas, with wide spread corruption, and an entrenched leadership; it is hard to imagine that Russia’s economy will have an extended economic growth that will return it to being a great power. Its economic growth last year (2017) was 1.5%. Russia is currently the 11th or 12th richest country in the world. It is behind Canada. My seat-of-the-pants estimate is that Russia will still not be among the 10 richest countries in 2050.

For Russia to return to its old glory, it really sort of needs to re-constitute the Soviet Union or the old Russian Empire to some degree. Some would argue that this has indeed been part of Putin’s plan. I will examine this in a future post.

Status Update On U.S. Long Range Fires Capabilities

Soldiers fire an M777A2 howitzer while supporting Iraqi security forces near al-Qaim, Iraq, Nov. 7, 2017, as part of the operation to defeat the Islamic State of Iraq and Syria. [Spc. William Gibson/U.S. Army]

Earlier this year, I noted that the U.S. is investing in upgrading its long range strike capabilities as part of its multi-domain battle doctrinal response to improving Chinese, Russian, and Iranian anti-access/area denial (A2/AD) capabilities. There have been a few updates on the progress of those investments.

The U.S. Army Long Range Fires Cross Functional Team

A recent article in Army Times by Todd South looked at some of the changes being implemented by the U.S. Army cross functional team charged with prioritizing improvements in the service’s long range fires capabilities. To meet a requirement to double the ranges of its artillery systems within five years, “the Army has embarked upon three tiers of focus, from upgrading old school artillery cannons, to swapping out its missile system to double the distance it can fire, and giving the Army a way to fire surface-to-surface missiles at ranges of 1,400 miles.”

The Extended Range Cannon Artillery program is working on rocket assisted munitions to double the range of the Army’s workhouse 155mm guns to 24 miles, with some special rounds capable of reaching targets up to 44 miles away. As I touched on recently, the Army is also looking into ramjet rounds that could potentially increase striking range to 62 miles.

To develop the capability for even longer range fires, the Army implemented a Strategic Strike Cannon Artillery program for targets up to nearly 1,000 miles, and a Strategic Fires Missile effort enabling targeting out to 1,400 miles.

The Army is also emphasizing retaining trained artillery personnel and an improved training regime which includes large-scale joint exercises and increased live-fire opportunities.

Revised Long Range Fires Doctrine

But better technology and training are only part of the solution. U.S. Army Captain Harrison Morgan advocated doctrinal adaptations to shift Army culture away from thinking of fires solely as support for maneuver elements. Among his recommendations are:

  • Increasing the proportion of U.S. corps rocket artillery to tube artillery systems from roughly 1:4 to something closer to the current Russian Army ratio of 3:4.
  • Fielding a tube artillery system capable of meeting or surpassing the German-made PZH 2000, which can strike targets out to 30 kilometers with regular rounds, sustain a firing rate of 10 rounds per minute, and strike targets with five rounds simultaneously.
  • Focus on integrating tube and rocket artillery with a multi-domain, joint force to enable the destruction of the majority of enemy maneuver forces before friendly ground forces reach direct-fire range.
  • Allow tube artillery to be task organized below the brigade level to provide indirect fires capabilities to maneuver battalions, and make rocket artillery available to division and brigade commanders. (Morgan contends that the allocation of indirect fires capabilities to maneuver battalions ended with the disbanding of the Army’s armored cavalry regiments in 2011.)
  • Increase training in use of unmanned aerial vehicle (UAV) assets at the tactical level to locate, target, and observe fires.

U.S. Air Force and U.S. Navy Face Long Range Penetrating Strike Challenges

The Army’s emphasis on improving long range fires appears timely in light of the challenges the U.S. Air Force and U.S. Navy face in conducting long range penetrating strikes mission in the A2/AD environment. A fascinating analysis by Jerry Hendrix for the Center for a New American Security shows the current strategic problems stemming from U.S. policy decisions taken in the early 1990s following the end of the Cold War.

In an effort to generate a “peace dividend” from the fall of the Soviet Union, the Clinton administration elected to simplify the U.S. military force structure for conducting long range air attacks by relieving the Navy of its associated responsibilities and assigning the mission solely to the Air Force. The Navy no longer needed to replace its aging carrier-based medium range bombers and the Air Force pushed replacements for its aging B-52 and B-1 bombers into the future.

Both the Air Force and Navy emphasized development and acquisition of short range tactical aircraft which proved highly suitable for the regional contingencies and irregular conflicts of the 1990s and early 2000s. Impressed with U.S. capabilities displayed in those conflicts, China, Russia, and Iran invested in air defense and ballistic missile technologies specifically designed to counter American advantages.

The U.S. now faces a strategic environment where its long range strike platforms lack the range and operational and technological capability to operate within these AS/AD “bubbles.” The Air Force has far too few long range bombers with stealth capability, and neither the Air Force nor Navy tactical stealth aircraft can carry long range strike missiles. The missiles themselves lack stealth capability. The short range of the Navy’s aircraft and insufficient numbers of screening vessels leave its aircraft carriers vulnerable to ballistic missile attack.

Remedying this state of affairs will take time and major investments in new weapons and technological upgrades. However, with certain upgrades, Hendrix sees the current Air Force and Navy force structures capable of providing the basis for a long range penetrating strike operational concept effective against A2/AD defenses. The unanswered question is whether these upgrades will be implemented at all.

Demographics of Germany

Germany is the richest country in Europe. It is the second most populous country in Europe (after Russia). It is the fourth richest country in the world. Its demographic situation is similar to many of its neighbors, which include several nearby large counties of around 60 million people, the United Kingdom, France and Italy. Each are unique, but because of its central position in Europe, this is a perfectly good case to examine.

The population of Germany is almost 83 million (82,800,000 in 2017 estimate). The rate of growth has been slow. In 1939, they had 69 million people (inside current borders: not counting territory and population gains in the 1930s). They still only had 69 million in 1950. Its fertility rate is now 1.59 children born per woman (2016 estimate). This is low, but not as low as Japan. Since the 1970s, the German death rate has exceeded its birth rate. Its fertility rate has been below 2.00 since 1970.

Unlike Japan, there has been significant immigration to Germany. The rate of immigration to Germany, relative to the size of their population has been higher than in the United States. About 7 million of Germany’s residents do not have German citizenship and over 10 million of the people in Germany (12%) were born outside of Germany. They tend to be from everywhere, Turkey, Poland, Russia, Italy, Romania, Greece, Syria, other EU countries, and so forth.

So….the picture is different when it comes to the demographic “pyramid,” although because of the low birth rates, it is still not very pyramidal. Not as bizarre looking as Japan’s, but this clearly still shows a shortage of young labor and a potential burden on the younger generation as the larger older population ages.

In many respects the comparison between Japan and Germany is most interesting, as Japan is a case of a country with low birth rate that does not have significant immigration, while Germany is the opposite. A proper in-depth study of this would look at the macro and micro economic impacts of this, the social impacts, and the long-term strengths and weaknesses these countries develop as a result of this. It is not a task I will be taking on.

As far as what the estimates for German population in 2050, hard to imagine it is going to be significantly different than what is today. It only grew 14 million in the last 80 or so years. A lot of this growth is due to immigration. So the United Nations estimates it will be 79 million in 2050. Sounds perfectly reasonable, although it is dependent on their continued immigration policy.

I have now briefly looked at six countries in the world, Russia, United States, China, India, Germany and Japan. This includes the three most populous counties in the world (followed by Indonesia, Brazil, Pakistan, Nigeria, Bangladesh, Russia, Mexico and Japan). They include five of the six richest countries in the world (with the UK being fifth on the list and France being seventh). I think that will be all for now.

FY2019 Defense Budget

I gather the defense budget for FY2019 is 674.4 billion. This is 17 billion more than 2018.

The bill only funds U.S. defense through 7 December (there is considerable irony in that date), and then they have to pass another bill. So it can all change. Added to that there will be the mid-term elections in November, although the new congress won’t be seated until late January.

The defense budget has gone from a high of 696 in 2010, down to 571 in 2015 and then up to 596 in 2016, 626 in 2017, and 653 in 2018. Source (as everyone seems to have a slightly different set of numbers):  https://www.whitehouse.gov/omb/historical-tables/

By the way, worth your while to look through the tables on that site.

Also see: https://www.thebalance.com/u-s-military-budget-components-challenges-growth-3306320

Some Statistics on Afghanistan

Camp Lonestar, near Jalabad, 7 October 2010 (Photo by William A. Lawrence II)

I do have a chapter on Afghanistan in my book America’s Modern Wars. When it came to updating the Afghanistan chapter (as I had to update the book before it was published), I ended up leaning on the Secretary General reports quarterly reports on Afghanistan for my data, as it may be the most trusted source available. Those reports are here:

https://unama.unmissions.org/secretary-general-reports

In Chapter Twenty-One my book I note that in 2013 there were 20,093 security incidences or 1,674 a month. This is a definite increase since 2008 and 2009 (741 and 960 a month respectively) and only a slight improvement (decrease) from 2011 (1,909 incidences a month). See pages 259-261 of my book.

So what are the current statistics?:

              Security           Incidences      Civilian

Year      Incidences       Per Month       Deaths

2013      20,093               1,674               2,959

2014      22,051               1,838               3,699

2015      22,634               1,886               3,545

2016      23,712               1,976               3,498

2017      23,744               1,979               3,438

2018      19,995               1,666               3,384      Estimated


2011 was the worse year of the war as far as incident count until 2016 and 2017. Based upon incident count, the war has been pretty much “flat-lined” for the last nine years (2010: 19,403, 2011: 22,903, 2012: 18,441). Civilian deaths show that same pattern.

At the start of 2013, we still had 66,000 troops in Afghanistan, although we were drawing them down. There were 251 U.S. troops killed in 2012 (310 killed from all causes) and 85 in 2013 (127 killed from all causes). Over the course of 2013, 34,000 troops were to be withdrawn and the U.S. involvement to end sometime in 2015. We did withdrawn the troops, but really have not ended our involvement. According to Wikipeida we have 18,000+ ISAF forces there (mostly American) and 20,000+ contractors. I have not checked these figures. We left behind an Afghan force of over 300,000 troops to conduct the counterinsurgency. That force has not grown significantly in size since then.

As we note in my book “The 2013 figure of 20,093 incidents a year does argue for a significant insurgency force. If we use a conservative figure of 333 incidents per thousand insurgents, then we are looking at more than 60,000 full-time and part-time insurgents.”

Now, we actually never did have a contract to do work on Afghanistan. After we were right on Iraq in 2004 (casualties and duration), we were given contracts to do more data research and analysis of insurgencies, but never given a contract to further refine our predictions for Iraq or do a similar prediction for Afghanistan. So we have never done any in-depth analysis of Afghanistan (you know, the type of work that requires a man-year or more of effort).

Camp Lonestar, near Jalabad, 7 October 2010 (Photo by William A. Lawrence II)


Notes for 2018 estimates:

  1. 15 December 2017-15 February 2018: 3,521 security incidences (6% decrease from previous year).

  2. 15 February-15 May: 5,675 security incidences (7% decrease from previous year).

  3. 15 May – 15 August: 5,800 security incidences (10% decrease from previous year)

  4. First quarter of 2018: 763 civilian deaths.

  5. Mid-year 2018: 1,692 civilian deaths.

.


Demographics of Japan

There was a time in the 1980s when Japan’s GNP was 60% of the United States and people were talking about Japan’s economy outgrowing the United States by the year 2000, 2010 or 2020…but in our lifetime. Well, I am still alive and they have not. Right now, Japan’s GNP is about 25% of the United States (IMF 2017 figures) and it does not look like they are going into any extended economic boom any time soon. Now, this talk in the 1980s was understandable if one took a straight line of the Japanese economic growth over the previous couple of decades, and compared it the U.S. economic growth of say, the 1970s. And…if you assumed those two lines would continue unchanged for the next few decades, you could get there. That is obviously not what happened. Japan’s place as the booming economic challenger was replaced by the “Asian Tigers” and then by the Peoples Republic of China. Japan’s current GDP is growing at 1.7% a year (2017). One of the several underlying reasons for this slow growth is due to their shortages in workforce, caused by their demographics.

The population of Japan as of the 2017 census is 127 million people (126,672,000). It is the tenth most populous country in the world (just after Russia). They remain the third richest country in the world (3rd in GNP) after the United States and China.

In 1985 their population was 121 million. This is not much growth. Mostly the population is getting older and grayer. In 2012, 24% of the population was over 65 and it is projected to rise to almost 40% by 2050. The good news is that Japan has the second longest overall life expectancy of any country in the world at 83.5 years. Since 2010 Japan has had a net population loss caused by falling birth rates and almost no immigration. Its fertility rate is 1.41 children per woman (2012), which is by far the lowest figure of any of the countries we have discussed. This is an improvement from 2001-2005, when it was 1.32.

Oddly enough, Japan controlled its population in the previous two centuries. Japanese population remained around 30-35 million people for around 150 years, from the early 1700s (their first census was in 1721). This is unusual, extremely unusual as it was not caused by any natural or man-made disaster. It appeared to be caused by a culture of family planning that simply resulted in the population remaining relatively steady. I don’t know enough about Japanese history to know why this developed, but it is trend that you see in almost no other country in the world in the 1800s. Just to make everyone uncomfortable, apparently this population control was helped by “infanticide” (mabiki).

Japan is a country that is not very encouraging for immigration. It is 98.5% Japanese, 0.5% Korean, 0.4% Chinese and 0.6% Other (in 2011). One of those “other” is now Geoffrey Clark, one of our guest bloggers. He has just moved to Japan for work and will be returning to blogging soon.

Japan really had not relied on immigration as part of their response to declining population. This is also unusual. As a result their demographic “pyramid” has developed a really uncomfortable shape. This is about as close as you are going to get to just flipping the pyramid upside down.

In the bigger picture, this shows the impact of controlled de-population on a country’s demographics (and economy). This is the alternative to allowing large scale immigration. Every country will need to address this as their fertility rates drop below 2. It is estimated that in 2050 the population of Japan will be 109 million (2017 UN figures, medium variant). This compares to 402 million for the United States (or 396 million using the 2017 UN medium variant figures). Right now the per capita income of Japan is $38,440 compared to $59,501 for the U.S. (IMF 2017 figures). If the per capita income remains below the United States, then this means the GDP of Japan could well decline to being below a fifth of the United States. This is a very different picture than the estimates that they would economically surpass the U.S. in 2020.

Final thoughts:

                 Japanese             United States           Ratio

Year          Population          Population                U.S./Japan

1860          > 32 million           31 million                  0.97

1900             44 million           76 million                  1.72

1940             73 million            132                          1.64

1980           117                       227                          1.94

2020           127                       334                          2.63

2050           109                       396                          3.63


1860 was 7 years after Commodore Perry entered Edo Bay, which lead to the opening of Japan for trade.

1900 was when the U.S. and Japan were on good terms.

1940 was the year before Pearl Harbor and the U.S. and Japan went to war.


Looking At Recent Reported Combat Loss Rates In Afghanistan

Afghan National Army soldiers simulate clearing a compound with help from their instructors at the 2nd Brigade, 205th Corps ANA Non-commissioned Officer Academy on Forward Operating Base Eagle in Zabul province Jan. 10, 2012 [{Wikimedia]

Last Friday, Rod Nordland published an article in the New York Times alleging that Afghan security forces (Afghan National Army (ANA) and police) had suffered an average of 57 killed in action (KIA) per day during the previous week, up from 22 killed per day in 2016. If true, such reports would indicate a dramatic increase in loss rates over the previous years.

These reported figures should be regarded critically, however. It is not clear how Nordland arrived at the total of 22 KIA per day for 2016. His article cited another article by Thomas Gibbons-Neff, published in the Times on 30 October 2017. This reported Afghan security forces casualties for 2016 at 6,700 KIA and 12,000 wounded in action (WIA), which works out to an average of 18.36 KIA per day (6,700/365), not 22. The total number of KIA + WIA works out to an average of 51.23 per day (18,700/365).

The lede of Gibbons-Neff’s 2017 article was that the U.S. and Afghan governments had stopped providing official strength and loss figures for the Afghan security forces. Citing the last report of the U.S. Special Inspector General for Afghanistan Reconstruction (SIGAR), Gibbons-Neff reported Afghan security forces losses from 1 January-8 May 2017 (126 days) as 2,531 KIA and 4,238 WIA. This works out to an average of 20.08 KIA (2,531/126) and 53.72 KIA + WIA (6,679/126) per day.

Nordland arrived at the figure of 57 KIA per day based on a report of 400 Afghan security forces killed in the week leading up the publication of his article on 21 September 2018. He calculated it by averaging the total over the previous seven days (400/7). Casualty rates in combat have been highly variable, historically. Brief spikes in rates are common. In the same paragraph reporting the 400 KIA total, Nordland quoted senior Afghan government officials stating that the daily average for recent months had been 30 to 40 KIA per day.

It is possible to use the figures cited by Nordland and Gibbons-Neff to make ballpark estimates for Afghan security forces casualties in 2017 and 2018. Even if the weekly loss of 400 KIA for 14-20 September 2018 represents an abnormally high total, it is reasonable to conclude that the Afghan security forces are very likely incurring sharply higher combat losses in 2018 than the previous two years. These figures do not include counts of missing or captured and thus underestimate the actual numbers of battle casualties being suffered by the Afghan forces. It is also possible that the estimates of 30-40 KIA per day apply only to the peak spring-to-autumn fighting season, which would somewhat reduce the overall 2018 KIA and WIA totals.

As Nordland reported, these losses are resulting in an increasing strain on the Afghan forces. His article stated that the strength of the ANA and police in April 2018 was 314,000, 38,000 below the authorized total of 352,000, and that the actual total was likely even lower due to fraudulent reporting and unreported desertions. The ANA suffered a monthly attrition rate of 2.9 percent in early 2017 from combat casualties, desertion, and failed reenlistments, requiring one-third of the overall force to be replaced by new recruits annually. That attrition rate is undoubtedly far higher now and almost certainly not sustainable for long.

In comparison, the Afghan government reported in August that its security forces had killed 42 Taliban fighters per day, or 1,300 per month. For the year ending in March 2018, it claimed to have killed 13,600 insurgent fighters. There has been no independent confirmation of these claims and they should be treated skeptically.

Demographics of India

India is still not thought of by many as a world power, but in the long run, as its economy and population grow, it will join this esteemed company. It is the 2nd largest population in the world and the 6th largest economy in the world. Its economy is about the size of its old colonial master, the United Kingdom. It is a nuclear power, although we gather it has not weaponized many nukes. Still, it is a poor country, with a per capita income of $1,983 per person (per year…IMF 2017 figures).

Unlike China, there was no draconian one-child policy adopted, so Indian population continued to grow at a rate that is about to catapult it past China as the most populous country in the world. This is expected to happen in 2024 or 2030, or whenever. Sometime in the next decade.

The population of India for 2017 is estimated at 1.324 million, or 1.3 billion. This puts the population of the world’s largest democracy around four times that of the United States. It is almost four times what its population was in 1951 (361 million). In the early 1950s China had a population around 60 percent larger than India. Now, they are almost equal, although China has considerable more wealth.

The rapid Chinese economic growth has lead to it having a GDP of $12 trillion compared to the more anemic GDP of India at only $2.6 trillion. Needless to say, there is also a big difference in per capita income.

But while China is growing at a rate of only .59% a year and its population is expected to fall, India is expected to continue growing. Its growth rate in 2016 was 1.19% and its fertility rates are 2.45 children per woman (2016 estimate from CIA World Factbook). The annual growth rate remains at over one percent a year. But, the growth rate of the population appears to be declining, like it is in most areas of the world, developed or developing. India does have some emigration and immigration, but the population is so massive that this does not have a huge impact on population growth rates. The demographic pyramid is actually much more pyramidal that the others we have seen, although it is clear towards that bottom of the pyramid that they are now controlling their population growth rates.

India is truly a multi-ethnic, multi-linguistic and multi-religious society. It has something like more than 2,000 ethnic groups. Forgive me if I don’t list them. About 40% of Indians speak Hindi (an Indo-European language) as their first language, and over half the population can speak it. Over 10% of the population speaks English, making it the second largest English speaking country in the world. Religious affiliation is a little more unified with Hindu’s making up almost 80% of the population. There are Muslims (14% or more), Christians (2.3%), Sikhs (1.7%), Buddists, Jainism and even practitioners of Zoroastrianism (look that one up in your Funk and Wagnells). Keep in mind that 14% of 1.3 billion makes this the third largest Muslim population in the world with over 170 million Muslims.

The Indian population is expected to grow for a while. The United Nations predicts the Indian population will be 1.7 billion in 2050. This compares to 402 million for the United States and 1.36 billion for China estimated in 2050.

India economic growth rate has been around 6% a year for the last two decades. Depending on continued economic growth, this is a country that will slowly and surely take its place among the nations of the world.