Tag theory

Technology And The Human Factor In War

A soldier waves an Israeli flag on the Golan front during the 1973 Yom Kippur War. (IDF Spokesperson’s unit, Jerusalem Report Archives)

[The article below is reprinted from the August 1997 edition of The International TNDM Newsletter.]

Technology and the Human Factor in War
by Trevor N. Dupuy

The Debate

It has become evident to many military theorists that technology has become increasingly important in war. In fact (even though many soldiers would not like to admit it) most such theorists believe that technology has actually reduced the significance of the human factor in war, In other words, the more advanced our military technology, these “technocrats” believe, the less we need to worry about the professional capability and competence of generals, admirals, soldiers, sailors, and airmen.

The technocrats believe that the results of the Kuwait, or Gulf, War of 1991 have confirmed their conviction. They cite the contribution to those results of the U.N. (mainly U.S.) command of the air, stealth aircraft, sophisticated guided missiles, and general electronic superiority, They believe that it was technology which simply made irrelevant the recent combat experience of the Iraqis in their long war with Iran.

Yet there are a few humanist military theorists who believe that the technocrats have totally misread the lessons of this century‘s wars! They agree that, while technology was important in the overwhelming U.N. victory, the principal reason for the tremendous margin of U.N. superiority was the better training, skill, and dedication of U.N. forces (again, mainly U.S.).

And so the debate rests. Both sides believe that the result of the Kuwait War favors their point of view, Nevertheless, an objective assessment of the literature in professional military journals, of doctrinal trends in the U.S. services, and (above all) of trends in the U.S. defense budget, suggest that the technocrats have stronger arguments than the humanists—or at least have been more convincing in presenting their arguments.

I suggest, however, that a completely impartial comparison of the Kuwait War results with those of other recent wars, and with some of the phenomena of World War II, shows that the humanists should not yet concede the debate.

I am a humanist, who is also convinced that technology is as important today in war as it ever was (and it has always been important), and that any national or military leader who neglects military technology does so to his peril and that of his country, But, paradoxically, perhaps to an extent even greater than ever before, the quality of military men is what wins wars and preserves nations.

To elevate the debate beyond generalities, and demonstrate convincingly that the human factor is at least as important as technology in war, I shall review eight instances in this past century when a military force has been successful because of the quality if its people, even though the other side was at least equal or superior in the technological sophistication of its weapons. The examples I shall use are:

  • Germany vs. the USSR in World War II
  • Germany vs. the West in World War II
  • Israel vs. Arabs in 1948, 1956, 1967, 1973 and 1982
  • The Vietnam War, 1965-1973
  • Britain vs. Argentina in the Falklands 1982
  • South Africans vs. Angolans and Cubans, 1987-88
  • The U.S. vs. Iraq, 1991

The demonstration will be based upon a marshaling of historical facts, then analyzing those facts by means of a little simple arithmetic.

Relative Combat Effectiveness Value (CEV)

The purpose of the arithmetic is to calculate relative combat effectiveness values (CEVs) of two opposing military forces. Let me digress to set up the arithmetic. Although some people who hail from south of the Mason-Dixon Line may be reluctant to accept the fact, statistics prove that the fighting quality of Northern soldiers and Southern soldiers was virtually equal in the American Civil War. (I invite those who might disagree to look at Livermore’s Numbers and Losses in the Civil War). That assumption of equality of the opposing troop quality in the Civil War enables me to assert that the successful side in every important battle in the Civil War was successful either because of numerical superiority or superior generalship. Three of Lee’s battles make the point:

  • Despite being outnumbered, Lee won at Antietam. (Though Antietam is sometimes claimed as a Union victory, Lee, the defender, held the battlefield; McClellan, the attacker, was repulsed.) The main reason for Lee’s success was that on a scale of leadership his generalship was worth 10, while McClellan was barely a 6.
  • Despite being outnumbered, Lee won at Chancellorsville because he was a 10 to Hooker’s 5.
  • Lee lost at Gettysburg mainly because he was outnumbered. Also relevant: Meade did not lose his nerve (like McClellan and Hooker) with generalship worth 8 to match Lee’s 8.

Let me use Antietam to show the arithmetic involved in those simple analyses of a rather complex subject:

The numerical strength of McClellan’s army was 89,000; Lee’s army was only 39,000 strong, but had the multiplier benefit of defensive posture. This enables us to calculate the theoretical combat power ratio of the Union Army to the Confederate Army as 1.4:1.0. In other words, with substantial preponderance of force, the Union Army should have been successful. (The combat power ratio of Confederates to Northerners, of course, was the reciprocal, or 0.71:1.04)

However, Lee held the battlefield, and a calculation of the actual combat power ratio of the two sides (based on accomplishment of mission, gaining or holding ground, and casualties) was a scant, but clear cut: 1.16:1.0 in favor of the Confederates. A ratio of the actual combat power ratio of the Confederate/Union armies (1.16) to their theoretical combat power (0.71) gives us a value of 1.63. This is the relative combat effectiveness of the Lee’s army to McClellan’s army on that bloody day. But, if we agree that the quality of the troops was the same, then the differential must essentially be in the quality of the opposing generals. Thus, Lee was a 10 to McClellan‘s 6.

The simple arithmetic equation[1] on which the above analysis was based is as follows:

CEV = (R/R)/(P/P)

When:
CEV is relative Combat Effectiveness Value
R/R is the actual combat power ratio
P/P is the theoretical combat power ratio.

At Antietam the equation was: 1.63 = 1.16/0.71.

We’ll be revisiting that equation in connection with each of our examples of the relative importance of technology and human factors.

Air Power and Technology

However, one more digression is required before we look at the examples. Air power was important in all eight of the 20th Century examples listed above. Offhand it would seem that the exercise of air superiority by one side or the other is a manifestation of technological superiority. Nevertheless, there are a few examples of an air force gaining air superiority with equivalent, or even inferior aircraft (in quality or numbers) because of the skill of the pilots.

However, the instances of such a phenomenon are rare. It can be safely asserted that, in the examples used in the following comparisons, the ability to exercise air superiority was essentially a technological superiority (even though in some instances it was magnified by human quality superiority). The one possible exception might be the Eastern Front in World War II, where a slight German technological superiority in the air was offset by larger numbers of Soviet aircraft, thanks in large part to Lend-Lease assistance from the United States and Great Britain.

The Battle of Kursk, 5-18 July, 1943

Following the surrender of the German Sixth Army at Stalingrad, on 2 February, 1943, the Soviets mounted a major winter offensive in south-central Russia and Ukraine which reconquered large areas which the Germans had overrun in 1941 and 1942. A brilliant counteroffensive by German Marshal Erich von Manstein‘s Army Group South halted the Soviet advance, and recaptured the city of Kharkov in mid-March. The end of these operations left the Soviets holding a huge bulge, or salient, jutting westward around the Russian city of Kursk, northwest of Kharkov.

The Germans promptly prepared a new offensive to cut off the Kursk salient, The Soviets energetically built field fortifications to defend the salient against expected German attacks. The German plan was for simultaneous offensives against the northern and southern shoulders of the base of the Kursk salient, Field Marshal Gunther von K1uge’s Army Group Center, would drive south from the vicinity of Orel, while Manstein’s Army Group South pushed north from the Kharkov area, The offensive was originally scheduled for early May, but postponements by Hitler, to equip his forces with new tanks, delayed the operation for two months, The Soviets took advantage of the delays to further improve their already formidable defenses.

The German attacks finally began on 5 July. In the north General Walter Model’s German Ninth Army was soon halted by Marshal Konstantin Rokossovski’s Army Group Center. In the south, however, German General Hermann Hoth’s Fourth Panzer Army and a provisional army commanded by General Werner Kempf, were more successful against the Voronezh Army Group of General Nikolai Vatutin. For more than a week the XLVIII Panzer Corps advanced steadily toward Oboyan and Kursk through the most heavily fortified region since the Western Front of 1918. While the Germans suffered severe casualties, they inflicted horrible losses on the defending Soviets. Advancing similarly further east, the II SS Panzer Corps, in the largest tank battle in history, repulsed a vigorous Soviet armored counterattack at Prokhorovka on July 12-13, but was unable to continue to advance.

The principal reason for the German halt was the fact that the Soviets had thrown into the battle General Ivan Konev’s Steppe Army Group, which had been in reserve. The exhausted, heavily outnumbered Germans had no comparable reserves to commit to reinvigorate their offensive.

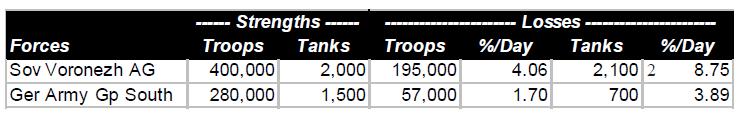
A comparison of forces and losses of the Soviet Voronezh Army Group and German Army Group South on the south face of the Kursk Salient is shown below. The strengths are averages over the 12 days of the battle, taking into consideration initial strengths, losses, and reinforcements.

A comparison of the casualty tradeoff can be found by dividing Soviet casualties by German strength, and German losses by Soviet strength. On that basis, 100 Germans inflicted 5.8 casualties per day on the Soviets, while 100 Soviets inflicted 1.2 casualties per day on the Germans, a tradeoff of 4.9 to 1.0

The statistics for the 8-day offensive of the German XLVIII Panzer Corps toward Oboyan are shown below. Also shown is the relative combat effectiveness value (CEV) of Germans and Soviets, as calculated by the TNDM. As was the case for the Battle of Antietam, this is derived from a mathematical comparison of the theoretical combat power ratio of the two forces (simply considering numbers and weapons characteristics), and the actual combat power ratios reflected by the battle results:

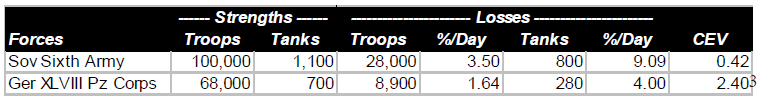
The calculated CEVs suggest that 100 German troops were the combat equivalent of 240 Soviet troops, comparably equipped. The casualty tradeoff in this battle shows that 100 Germans inflicted 5.15 casualties per day on the Soviets, while 100 Soviets inflicted 1.11 casualties per day on the Germans, a tradeoff of4.64. It is a rule of thumb that the casualty tradeoff is usually about the square of the CEV.

A similar comparison can be made of the two-day battle of Prokhorovka. Soviet accounts of that battle have claimed this as a great victory by the Soviet Fifth Guards Tank Army over the German II SS Panzer Corps. In fact, since the German advance was halted, the outcome was close to a draw, but with the advantage clearly in favor of the Germans.

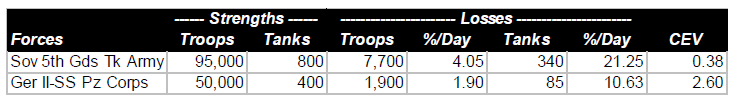
The casualty tradeoff shows that 100 Germans inflicted 7.7 casualties per on the Soviets, while 100 Soviets inflicted 1.0 casualties per day on the Germans, for a tradeoff value of 7.7.

When the German offensive began, they had a slight degree of local air superiority. This was soon reversed by German and Soviet shifts of air elements, and during most of the offensive, the Soviets had a slender margin of air superiority. In terms of technology, the Germans probably had a slight overall advantage. However, the Soviets had more tanks and, furthermore, their T-34 was superior to any tank the Germans had available at the time. The CEV calculations demonstrate that the Germans had a great qualitative superiority over the Russians, despite near-equality in technology, and despite Soviet air superiority. The Germans lost the battle, but only because they were overwhelmed by Soviet numbers.

German Performance, Western Europe, 1943-1945

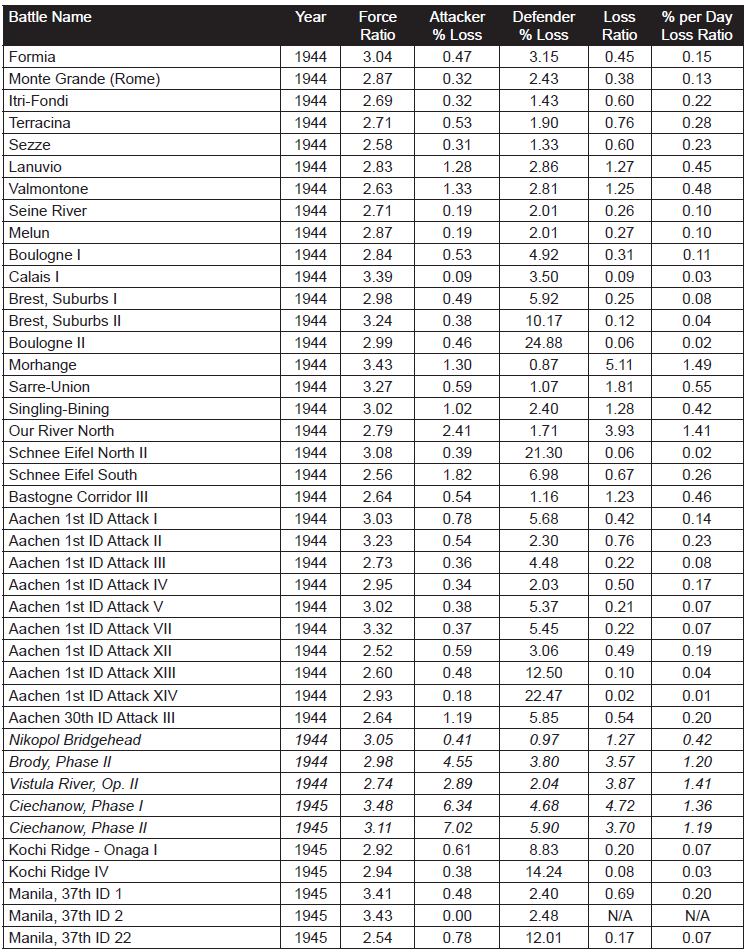
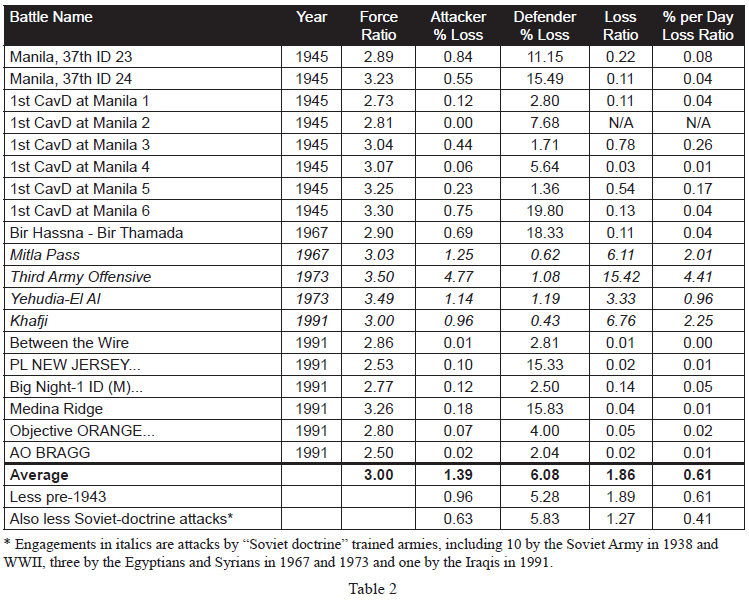
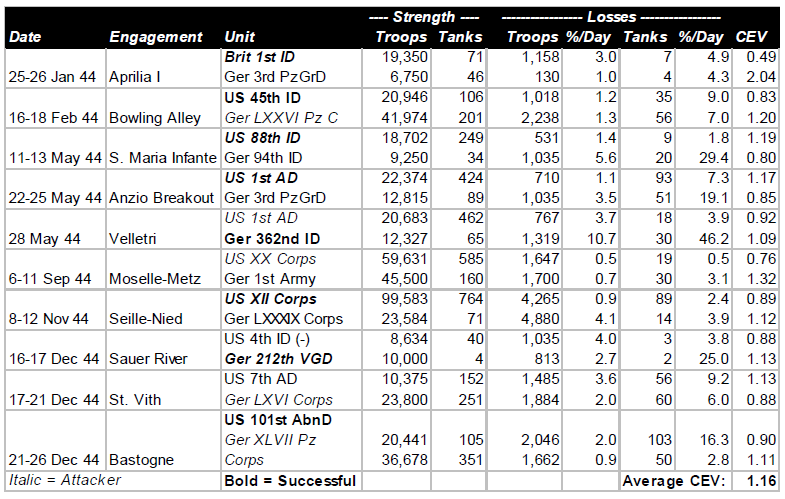
Beginning with operations between Salerno and Naples in September, 1943, through engagements in the closing days of the Battle of the Bulge in January, 1945, the pattern of German performance against the Western Allies was consistent. Some German units were better than others, and a few Allied units were as good as the best of the Germans. But on the average, German performance, as measured by CEV and casualty tradeoff, was better than the Western allies by a CEV factor averaging about 1.2, and a casualty tradeoff factor averaging about 1.5. Listed below are ten engagements from Italy and Northwest Europe during that 1944.

Technologically, German forces and those of the Western Allies were comparable. The Germans had a higher proportion of armored combat vehicles, and their best tanks were considerably better than the best American and British tanks, but the advantages were at least offset by the greater quantity of Allied armor, and greater sophistication of much of the Allied equipment. The Allies were increasingly able to achieve and maintain air superiority during this period of slightly less than two years.

The combination of vast superiority in numbers of troops and equipment, and in increasing Allied air superiority, enabled the Allies to fight their way slowly up the Italian boot, and between June and December, 1944, to drive from the Normandy beaches to the frontier of Germany. Yet the presence or absence of Allied air support made little difference in terms of either CEVs or casualty tradeoff values. Despite the defeats inflicted on them by the numerically superior Allies during the latter part of 1944, in December the Germans were able to mount a major offensive that nearly destroyed an American army corps, and threatened to drive at least a portion of the Allied armies into the sea.

Clearly, in their battles against the Soviets and the Western Allies, the Germans demonstrated that quality of combat troops was able consistently to overcome Allied technological and air superiority. It was Allied numbers, not technology, that defeated the quantitatively superior Germans.

The Six-Day War, 1967

The remarkable Israeli victories over far more numerous Arab opponents—Egyptian, Jordanian, and Syrian—in June, 1967 revealed an Israeli combat superiority that had not been suspected in the United States, the Soviet Union or Western Europe. This superiority was equally awesome on the ground as in the air. (By beginning the war with a surprise attack which almost wiped out the Egyptian Air Force, the Israelis avoided a serious contest with the one Arab air force large enough, and possibly effective enough, to challenge them.) The results of the three brief campaigns are summarized in the table below:

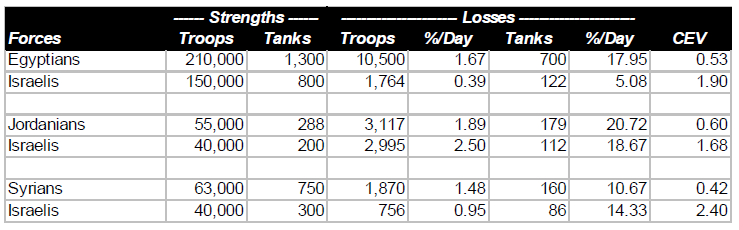
It should be noted that some Israelis who fought against the Egyptians and Jordanians also fought against the Syrians. Thus, the overall Arab numerical superiority was greater than would be suggested by adding the above strength figures, and was approximately 328,000 to 200,000.

It should also be noted that the technological sophistication of the Israeli and Arab ground forces was comparable. The only significant technological advantage of the Israelis was their unchallenged command of the air. (In terms of battle outcomes, it was irrelevant how they had achieved air superiority.) In fact this was a very significant advantage, the full import of which would not be realized until the next Arab-Israeli war.

The results of the Six Day War do not provide an unequivocal basis for determining the relative importance of human factors and technological superiority (as evidenced in the air). Clearly a major factor in the Israeli victories was the superior performance of their ground forces due mainly to human factors. At least as important in those victories was Israeli command of the air, in which both technology and human factors both played a part.

The October War, 1973

A better basis for comparing the relative importance of human factors and technology is provided by the results of the October War of 1973 (known to Arabs as the War of Ramadan, and to Israelis as the Yom Kippur War). In this war the Israeli unquestioned superiority in the air was largely offset by the Arabs possession of highly sophisticated Soviet air defense weapons.

One important lesson of this war was a reassessment of Israeli contempt for the fighting quality of Arab ground forces (which had stemmed from the ease with which they had won their ground victories in 1967). When Arab ground troops were protected from Israeli air superiority by their air defense weapons, they fought well and bravely, demonstrating that Israeli control of the air had been even more significant in 1967 than anyone had then recognized.

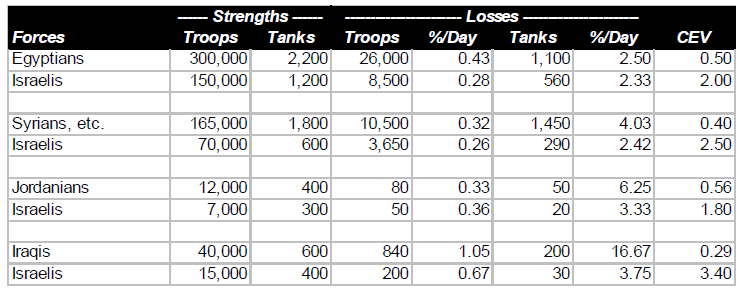
It should be noted that the total Arab (and Israeli) forces are those shown in the first two comparisons, above. A Jordanian brigade and two Iraqi divisions formed relatively minor elements of the forces under Syrian command (although their presence on the ground was significant in enabling the Syrians to maintain a defensive line when the Israelis threatened a breakthrough around 20 October). For the comparison of Jordanians and Iraqis the total strength is the total of the forces in the battles (two each) on which these comparisons are based.

One other thing to note is how the Israelis, possibly unconsciously, confirmed that validity of their CEVs with respect to Egyptians and Syrians by the numerical strengths of their deployments to the two fronts. Since the war ended up in a virtual stalemate on both fronts, the overall strength figures suggest rough equivalence of combat capability.

The CEV values shown in the above table are very significant in relation to the debate about human factors and technology, There was little if anything to choose between the technological sophistication of the two sides. The Arabs had more tanks than the Israelis, but (as Israeli General Avraham Adan once told the author) there was little difference in the quality of the tanks. The Israelis again had command of the air, but this was neutralized immediately over the battlefields by the Soviet air defense equipment effectively manned by the Arabs. Thus, while technology was of the utmost importance to both sides, enabling each side to prevent the enemy from gaining a significant advantage, the true determinant of battlefield outcomes was the fighting quality of the troops, And, while the Arabs fought bravely, the Israelis fought much more effectively. Human factors made the difference.

Israeli Invasion of Lebanon, 1982

In terms of the debate about the relative importance of human factors and technology, there are two significant aspects to this small war, in which Syrians forces and PLO guerrillas were the Arab participants. In the first place, the Israelis showed that their air technology was superior to the Syrian air defense technology, As a result, they regained complete control of the skies over the battlefields. Secondly, it provides an opportunity to include a highly relevant quotation.

The statistical comparison shows the results of the two major battles fought between Syrians and Israelis:

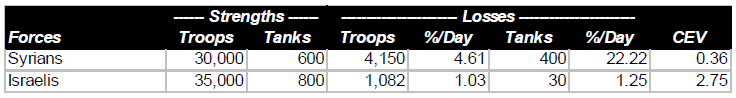
In assessing the above statistics, a quotation from the Israeli Chief of Staff, General Rafael Eytan, is relevant.

In late 1982 a group of retired American generals visited Israel and the battlefields in Lebanon. Just before they left for home, they had a meeting with General Eytan. One of the American generals asked Eytan the following question: “Since the Syrians were equipped with Soviet weapons, and your troops were equipped with American (or American-type) weapons, isn’t the overwhelming Israeli victory an indication of the superiority of American weapons technology over Soviet weapons technology?”

Eytan’s reply was classic: “If we had had their weapons, and they had had ours, the result would have been absolutely the same.”

One need not question how the Israeli Chief of Staff assessed the relative importance of the technology and human factors.

Falkland Islands War, 1982

It is difficult to get reliable data on the Falkland Islands War of 1982. Furthermore, the author of this article had not undertaken the kind of detailed analysis of such data as is available. However, it is evident from the information that is available about that war that its results were consistent with those of the other examples examined in this article.

The total strength of Argentine forces in the Falklands at the time of the British counter-invasion was slightly more than 13,000. The British appear to have landed close to 6,400 troops, although it may have been fewer. In any event, it is evident that not more than 50% of the total forces available to both sides were actually committed to battle. The Argentine surrender came 27 days after the British landings, but there were probably no more than six days of actual combat. During these battles the British performed admirably, the Argentinians performed miserably. (Save for their Air Force, which seems to have fought with considerable gallantry and effectiveness, at the extreme limit of its range.) The British CEV in ground combat was probably between 2.5 and 4.0. The statistics were at least close to those presented below:

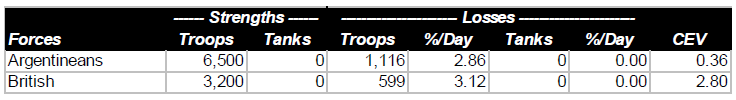
It is evident from published sources that the British had no technological advantage over the Argentinians; thus the one-sided results of the ground battles were due entirely to British skill (derived from training and doctrine) and determination.

South African Operations in Angola, 1987-1988

Neither the political reasons for, nor political results of, the South African military interventions in Angola in the 1970s, and again in the late 1980s, need concern us in our consideration of the relative significance of technology and of human factors. The combat results of those interventions, particularly in 1987-1988 are, however, very relevant.

The operations between elements of the South African Defense Force (SADF) and forces of the Popular Movement for the Liberation of Angola (FAPLA) took place in southeast Angola, generally in the region east of the city of Cuito-Cuanavale. Operating with the SADF units were a few small units of Jonas Savimbi’s National Union for the Total Independence of Angola (UNITA). To provide air support to the SADF and UNITA ground forces, it would have been necessary for the South Africans to establish air bases either in Botswana, Southwest Africa (Namibia), or in Angola itself. For reasons that were largely political, they decided not to do that, and thus operated under conditions of FAPLA air supremacy. This led them, despite terrain generally unsuited for armored warfare, to use a high proportion of armored vehicles (mostly light armored cars) to provide their ground troops with some protection from air attack.

Summarized below are the results of three battles east of Cuito-Cuanavale in late 1987 and early 1988. Included with FAPLA forces are a few Cubans (mostly in armored units); included with the SADF forces are a few UNITA units (all infantry).

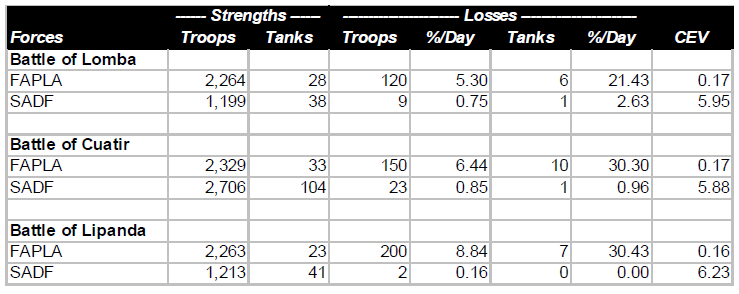
FAPLA had complete command of air, and substantial numbers of MiG-21 and MiG-23 sorties were flown against the South Africans in all of these battles. This technological superiority was probably partly offset by greater South African EW (electronic warfare) capability. The ability of the South Africans to operate effectively despite hostile air superiority was reminiscent of that of the Germans in World War II. It was a further demonstration that, no matter how important technology may be, the fighting quality of the troops is even more important.

The tank figures include armored cars. In the first of the three battles considered, FAPLA had by far the more powerful and more numerous medium tanks (20 to 0). In the other two, SADF had a slight or significant advantage in medium tank numbers and quality. But it didn’t seem to make much difference in the outcomes.

Kuwait War, 1991

The previous seven examples permit us to examine the results of Kuwait (or Second Gulf) War with more objectivity than might otherwise have possible. First, let’s look at the statistics. Note that the comparison shown below is for four days of ground combat, February 24-28, and shows only operations of U.S. forces against the Iraqis.

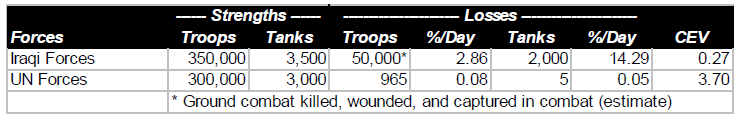
There can be no question that the single most important contribution to the overwhelming victory of U.S. and other U.N. forces was the air war that preceded, and accompanied, the ground operations. But two comments are in order. The air war alone could not have forced the Iraqis to surrender. On the other hand, it is evident that, even without the air war, U.S. forces would have readily overwhelmed the Iraqis, probably in more than four days, and with more than 285 casualties. But the outcome would have been hardly less one-sided.

The Vietnam War, 1965-1973

It is impossible to make the kind of mathematical analysis for the Vietnam War as has been done in the examples considered above. The reason is that we don’t have any good data on the Vietcong—North Vietnamese forces,

However, such quantitative analysis really isn’t necessary There can be no doubt that one of the opponents was a superpower, the most technologically advanced nation on earth, while the other side was what Lyndon Johnson called a “raggedy-ass little nation,” a typical representative of “the third world.“

Furthermore, even if we were able to make the analyses, they would very possibly be misinterpreted. It can be argued (possibly with some exaggeration) that the Americans won all of the battles. The detailed engagement analyses could only confirm this fact. Yet it is unquestionable that the United States, despite airpower and all other manifestations of technological superiority, lost the war. The human factor—as represented by the quality of American political (and to a lesser extent military) leadership on the one side, and the determination of the North Vietnamese on the other side—was responsible for this defeat.

Conclusion

In a recent article in the Armed Forces Journal International Col. Philip S. Neilinger, USAF, wrote: “Military operations are extremely difficult, if not impossible, for the side that doesn’t control the sky.” From what we have seen, this is only partly true. And while there can be no question that operations will always be difficult to some extent for the side that doesn’t control the sky, the degree of difficulty depends to a great degree upon the training and determination of the troops.

What we have seen above also enables us to view with a better perspective Colonel Neilinger’s subsequent quote from British Field Marshal Montgomery: “If we lose the war in the air, we lose the war and we lose it quickly.” That statement was true for Montgomery, and for the Allied troops in World War II. But it was emphatically not true for the Germans.

The examples we have seen from relatively recent wars, therefore, enable us to establish priorities on assuring readiness for war. It is without question important for us to equip our troops with weapons and other materiel which can match, or come close to matching, the technological quality of the opposition’s materiel. We must realize that we cannot—as some people seem to think—buy good forces, by technology alone. Even more important is to assure the fighting quality of the troops. That must be, by far, our first priority in peacetime budgets and in peacetime military activities of all sorts.

NOTES

[1] This calculation is automatic in analyses of historical battles by the Tactical Numerical Deterministic Model (TNDM).

[2] The initial tank strength of the Voronezh Army Group was about 1,100 tanks. About 3,000 additional Soviet tanks joined the battle between 6 and 12 July. At the end of the battle there were about 1,800 Soviet tanks operational in the battle area; at the same time there were about 1,000 German tanks still operational.

[3] The relative combat effectiveness value of each force is calculated in comparison to 1.0. Thus the CEV of the Germans is 2.40:1.0, while that of the Soviets is 0.42: 1.0. The opposing CEVs are always the reciprocals of each other.

Comparing the RAND Version of the 3:1 Rule to Real-World Data

Chuliengcheng. In a glorious death eternal life. (Battle of Yalu River, 1904) [Wikimedia Commons]

[The article below is reprinted from the Winter 2010 edition of The International TNDM Newsletter.]

Comparing the RAND Version of the 3:1 Rule to Real-World Data
Christopher A. Lawrence

For this test, The Dupuy Institute took advan­tage of two of its existing databases for the DuWar suite of databases. The first is the Battles Database (BaDB), which covers 243 battles from 1600 to 1900. The sec­ond is the Division-level Engagement Database (DLEDB), which covers 675 division-level engagements from 1904 to 1991.

The first was chosen to provide a historical con­text for the 3:1 rule of thumb. The second was chosen so as to examine how this rule applies to modern com­bat data.

We decided that this should be tested to the RAND version of the 3:1 rule as documented by RAND in 1992 and used in JICM [Joint Integrated Contingency Model] (with SFS [Situational Force Scoring]) and other mod­els. This rule, as presented by RAND, states: “[T]he famous ‘3:1 rule,’ according to which the attacker and defender suffer equal fractional loss rates at a 3:1 force ratio if the battle is in mixed terrain and the defender enjoys ‘prepared’ defenses…”

Therefore, we selected out all those engage­ments from these two databases that ranged from force ratios of 2.5 to 1 to 3.5 to 1 (inclusive). It was then a simple matter to map those to a chart that looked at attackers losses compared to defender losses. In the case of the pre-1904 cases, even with a large database (243 cases), there were only 12 cases of combat in that range, hardly statistically significant. That was because most of the combat was at odds ratios in the range of .50-to-1 to 2.00-to-one.

The count of number of engagements by odds in the pre-1904 cases:

As the database is one of battles, then usually these are only joined at reasonably favorable odds, as shown by the fact that 88 percent of the battles occur between 0.40 and 2.50 to 1 odds. The twelve pre-1904 cases in the range of 2.50 to 3.50 are shown in Table 1.

If the RAND version of the 3:1 rule was valid, one would expect that the “Percent per Day Loss Ratio” (the last column) would hover around 1.00, as this is the ratio of attacker percent loss rate to the defender per­cent loss rate. As it is, 9 of the 12 data points are notice­ably below 1 (below 0.40 or a 1 to 2.50 exchange rate). This leaves only three cases (25%) with an exchange rate that would support such a “rule.”

If we look at the simple ratio of actual losses (vice percent losses), then the numbers comes much closer to parity, but this is not the RAND interpreta­tion of the 3:1 rule. Six of the twelve numbers “hover” around an even exchange ratio, with six other sets of data being widely off that central point. “Hover” for the rest of this discussion means that the exchange ratio ranges from 0.50-to-1 to 2.00-to 1.

Still, this is early modern linear combat, and is not always representative of modern war. Instead, we will examine 634 cases in the Division-level Database (which consists of 675 cases) where we have worked out the force ratios. While this database covers from 1904 to 1991, most of the cases are from WWII (1939- 1945). Just to compare:

As such, 87% of the cases are from WWII data and 10% of the cases are from post-WWII data. The engagements without force ratios are those that we are still working on as The Dupuy Institute is always ex­panding the DLEDB as a matter of routine. The specific cases, where the force ratios are between 2.50 and 3.50 to 1 (inclusive) are shown in Table 2:

This is a total of 98 engagements at force ratios of 2.50 to 3.50 to 1. It is 15 percent of the 634 engage­ments for which we had force ratios. With this fairly significant representation of the overall population, we are still getting no indication that the 3:1 rule, as RAND postulates it applies to casualties, does indeed fit the data at all. Of the 98 engagements, only 19 of them demonstrate a percent per day loss ratio (casualty exchange ratio) between 0.50-to-1 and 2-to-1. This is only 19 percent of the engagements at roughly 3:1 force ratio. There were 72 percent (71 cases) of those engage­ments at lower figures (below 0.50-to-1) and only 8 percent (cases) are at a higher exchange ratio. The data clearly was not clustered around the area from 0.50-to- 1 to 2-to-1 range, but was well to the left (lower) of it.

Looking just at straight exchange ratios, we do get a better fit, with 31 percent (30 cases) of the figure ranging between 0.50 to 1 and 2 to 1. Still, this fig­ure exchange might not be the norm with 45 percent (44 cases) lower and 24 percent (24 cases) higher. By definition, this fit is 1/3rd the losses for the attacker as postulated in the RAND version of the 3:1 rule. This is effectively an order of magnitude difference, and it clearly does not represent the norm or the center case.

The percent per day loss exchange ratio ranges from 0.00 to 5.71. The data tends to be clustered at the lower values, so the high values are very much outliers. The highest percent exchange ratio is 5.71, the second highest is 4.41, the third highest is 2.92. At the other end of the spectrum, there are four cases where no losses were suffered by one side and seven where the exchange ratio was .01 or less. Ignoring the “N/A” (no losses suffered by one side) and the two high “outliers (5.71 and 4.41), leaves a range of values from 0.00 to 2.92 across 92 cases. With an even dis­tribution across that range, one would expect that 51 percent of them would be in the range of 0.50-to-1 and 2.00-to-1. With only 19 percent of the cases being in that range, one is left to conclude that there is no clear correlation here. In fact, it clearly is the opposite effect, which is that there is a negative relationship. Not only is the RAND construct unsupported, it is clearly and soundly contradicted with this data. Furthermore, the RAND construct is theoretically a worse predictor of casualty rates than if one randomly selected a value for the percentile exchange rates between the range of 0 and 2.92. We do believe this data is appropriate and ac­curate for such a test.

As there are only 19 cases of 3:1 attacks fall­ing in the even percentile exchange rate range, then we should probably look at these cases for a moment:

One will note, in these 19 cases, that the aver­age attacker casualties are way out of line with the av­erage for the entire data set (3.20 versus 1.39 or 3.20 versus 0.63 with pre-1943 and Soviet-doctrine attack­ers removed). The reverse is the case for the defenders (3.12 versus 6.08 or 3.12 versus 5.83 with pre-1943 and Soviet-doctrine attackers removed). Of course, of the 19 cases, 2 are pre-1943 cases and 7 are cases of Soviet-doctrine attackers (in fact, 8 of the 14 cases of the So­viet-doctrine attackers are in this selection of 19 cases). This leaves 10 other cases from the Mediterranean and ETO (Northwest Europe 1944). These are clearly the unusual cases, outliers, etc. While the RAND 3:1 rule may be applicable for the Soviet-doctrine offensives (as it applies to 8 of the 14 such cases we have), it does not appear to be applicable to anything else. By the same token, it also does not appear to apply to virtually any cases of post-WWII combat. This all strongly argues that not only is the RAND construct not proven, but it is indeed clearly not correct.

The fact that this construct also appears in So­viet literature, but nowhere else in US literature, indi­cates that this is indeed where the rule was drawn from. One must consider the original scenarios run for the RSAC [RAND Strategy Assessment Center] wargame were “Fulda Gap” and Korean War scenarios. As such, they were regularly conducting bat­tles with Soviet attackers versus Allied defenders. It would appear that the 3:1 rule that they used more closely reflected the experiences of the Soviet attackers in WWII than anything else. Therefore, it may have been a fine representation for those scenarios as long as there was no US counterattacking or US offensives (and assuming that the Soviet Army of the 1980s performed at the same level as in did in the 1940s).

There was a clear relative performance difference between the Soviet Army and the German Army in World War II (see our Capture Rate Study Phase I & II and Measuring Human Factors in Combat for a detailed analysis of this).[1] It was roughly in the order of a 3-to-1-casualty exchange ratio. Therefore, it is not surprising that Soviet writers would create analytical tables based upon an equal percentage exchange of losses when attacking at 3:1. What is surprising, is that such a table would be used in the US to represent US forces now. This is clearly not a correct application.

Therefore, RAND’s SFS, as currently con­structed, is calibrated to, and should only be used to represent, a Soviet-doctrine attack on first world forces where the Soviet-style attacker is clearly not properly trained and where the degree of performance difference is similar to that between the Germans and Soviets in 1942-44. It should not be used for US counterattacks, US attacks, or for any forces of roughly comparable ability (regardless of whether Soviet-style doctrine or not). Furthermore, it should not be used for US attacks against forces of inferior training, motivation and co­hesiveness. If it is, then any such tables should be ex­pected to produce incorrect results, with attacker losses being far too high relative to the defender. In effect, the tables unrealistically penalize the attacker.

As JICM with SFS is now being used for a wide variety of scenarios, then it should not be used at all until this fundamental error is corrected, even if that use is only for training. With combat tables keyed to a result that is clearly off by an order of magnitude, then the danger of negative training is high.

NOTES

[1] Capture Rate Study Phases I and II Final Report (The Dupuy Institute, March 6, 2000) (2 Vols.) and Measuring Human Fac­tors in Combat—Part of the Enemy Prisoner of War Capture Rate Study (The Dupuy Institute, August 31, 2000). Both of these reports are available through our web site.

TDI Friday Read: How Do We Know What We Know About War?

The late, great Carl Sagan.

Today’s edition of TDI Friday Read asks the question, how do we know if the theories and concepts we use to understand and explain war and warfare accurately depict reality? There is certainly no shortage of explanatory theories available, starting with Sun Tzu in the 6th century BCE and running to the present. As I have mentioned before, all combat models and simulations are theories about how combat works. Military doctrine is also a functional theory of warfare. But how do we know if any of these theories are actually true?

Well, one simple way to find out if a particular theory is valid is to use it to predict the outcome of the phenomenon it purports to explain. Testing theory through prediction is a fundamental aspect of the philosophy of science. If a theory is accurate, it should be able to produce a reasonable accurate prediction of future behavior.

In his 2016 article, “Can We Predict Politics? Toward What End?” Michael D. Ward, a Professor of Political Science at Duke University, made a case for a robust effort for using prediction as a way of evaluating the thicket of theory populating security and strategic studies. Dropping invalid theories and concepts is important, but there is probably more value in figuring out how and why they are wrong.

Screw Theory! We Need More Prediction in Security Studies!

Trevor Dupuy and TDI publicly put their theories to the test in the form of combat casualty estimates for the 1991 Gulf Way, the U.S. intervention in Bosnia, and the Iraqi insurgency. How well did they do?

Predictions

Dupuy himself argued passionately for independent testing of combat models against real-world data, a process known as validation. This is actually seldom done in the U.S. military operations research community.

Military History and Validation of Combat Models

However, TDI has done validation testing of Dupuy’s Quantified Judgement Model (QJM) and Tactical Numerical Deterministic Model (TNDM). The results are available for all to judge.

Validating Trevor Dupuy’s Combat Models

I will conclude this post on a dissenting note. Trevor Dupuy spent decades arguing for more rigor in the development of combat models and analysis, with only modest success. In fact, he encountered significant skepticism and resistance to his ideas and proposals. To this day, the U.S. Defense Department seems relatively uninterested in evidence-based research on this subject. Why?

David Wilkinson, Editor-in-Chief of the Oxford Review, wrote a fascinating blog post looking at why practitioners seem to have little actual interest in evidence-based practice.

Why evidence-based practice probably isn’t worth it…

His argument:

The problem with evidence based practice is that outside of areas like health care and aviation/technology is that most people in organisations don’t care about having research evidence for almost anything they do. That doesn’t mean they are not interesting in research but they are just not that interested in using the research to change how they do things – period.

His explanation for why this is and what might be done to remedy the situation is quite interesting.

Happy Holidays to all!

Strachan On The Changing Character Of War

The Cove, the professional development site for the Australian Army, has posted a link to a 2011 lecture by Professor Sir Hew Strachan. Strachan, a Professor of International Relations at St. Andrews University in Scotland, is one of the more perceptive and trenchant observers about the recent trends in strategy, war, and warfare from a historian’s perspective. I highly recommend his recent book, The Direction of War.

Strachan’s lecture, “The Changing Character of War,” proceeds from Carl von Clausewitz’s discussions in On War on change and continuity in the history of war to look at the trajectories of recent conflicts. Among the topics Strachan’s lecture covers are technological determinism, the irregular conflicts of the early 21st century, political and social mobilization, the spectrum of conflict, the impact of the Second World War on contemporary theorizing about war and warfare, and deterrence.

This is well worth the time to listen to and think about.

The Principle Of Mass On The Future Battlefield

Men of the U.S. Army 369th Infantry Regiment “Harlem’s Hellfighters,”in action at Séchault on September 29, 1918 during the Meuse-Argonne Offensive. [Wikimedia]

Given the historical trend toward battlefield dispersion as a result of the increasing lethality of weapons, how will the principle of mass apply in future warfare? I have been wondering about this for a while in the context of the two principle missions the U.S. Army must plan and prepare for, combined arms maneuver and wide area security. As multi-domain battle advocates contend, future combat will place a premium on smaller, faster, combat formations capable of massing large amounts of firepower. However, wide area security missions, such as stabilization and counterinsurgency, will continue to demand significant numbers of “boots on the ground,” the traditional definition of mass on the battlefield. These seemingly contradictory requirements are contributing to the Army’s ongoing “identity crisis” over future doctrine, training, and force structure in an era of budget austerity and unchanging global security responsibilities.

Over at the Australian Army Land Power Forum, Lieutenant Colonel James Davis addresses the question generating mass in combat in the context of the strategic challenges that army faces. He cites traditional responses by Western armies to this problem, “Regular and Reserve Force partnering through a standing force generation cycle, indigenous force partnering through deployed training teams and Reserve mobilisation to reconstitute and regenerate deployed units.”

Davis also mentions AirLand Battle and “blitzkrieg” as examples of tactical and operational approaches to limiting the ability of enemy forces to mass on the battlefield. To this he adds “more recent operational concepts, New Generation Warfare and Multi Domain Battle, [that] operate in the air, electromagnetic spectrum and cyber domain and to deny adversary close combat forces access to the battle zone.” These newer concepts use Cyber Electromagnetic Activities (CEMA), Information Operations, long range Joint Fires, and Robotic and Autonomous systems (RAS) to attack enemy efforts to mass.

The U.S. Army is moving rapidly to develop, integrate and deploy these capabilities. Yet, however effectively new doctrine and technology may influence mass in combined arms maneuver combat, it is harder to see how they can mitigate the need for manpower in wide area security missions. Some countries may have the strategic latitude to emphasize combined arms maneuver over wide area security, but the U.S. Army cannot afford to do so in the current security environment. Although conflicts emphasizing combined arms maneuver may present the most dangerous security challenge to the U.S., contingencies involving wide area security are far more likely.

How this may be resolved is an open question at this point in time. It is also a demonstration as to how tactical and operational considerations influence strategic options.

TDI Friday Read: The Validity Of The 3-1 Rule Of Combat

Canadian soldiers going “over the top” during the First World War. [History.com]

Today’s edition of TDI Friday Read addresses the question of force ratios in combat. How many troops are needed to successfully attack or defend on the battlefield? There is a long-standing rule of thumb that holds that an attacker requires a 3-1 preponderance over a defender in combat in order to win. The aphorism is so widely accepted that few have questioned whether it is actually true or not.

Trevor Dupuy challenged the validity of the 3-1 rule on empirical grounds. He could find no historical substantiation to support it. In fact, his research on the question of force ratios suggested that there was a limit to the value of numerical preponderance on the battlefield.

Trevor Dupuy and the 3-1 Rule

Human Factors In Warfare: Diminishing Returns In Combat

TDI President Chris Lawrence has also challenged the 3-1 rule in his own work on the subject.

Force Ratios in Conventional Combat

The 3-to-1 Rule in Histories

Aussie OR

Comparing Force Ratios to Casualty Exchange Ratios

The validity of the 3-1 rule is no mere academic question. It underpins a great deal of U.S. military policy and warfighting doctrine. Yet, the only time the matter was seriously debated was in the 1980s with reference to the problem of defending Western Europe against the threat of Soviet military invasion.

The Great 3-1 Rule Debate

It is probably long past due to seriously challenge the validity and usefulness of the 3-1 rule again.

Command and Combat Effectiveness: The Case of the British 51st Highland Division

Soldiers of the British 51st Highland Division take cover in bocage in Normandy, 1944. [Daily Record (UK)]

While Trevor Dupuy’s concept of combat effectiveness has been considered controversial by some, he was hardly the only one to observe that throughout history, some military forces have fought more successfully on the battlefield than others. While the sources of victory and defeat in battle remain a fertile, yet understudied topic, there is a growing literature on the topic of military effectiveness in the fields of strategic and security studies.

Anthony King, a professor in War Studies at the University of Warwick, has published an outstanding article in the most recent edition of British Journal of Military History, “Why did 51st Highland Division Fail? A case-study in command and combat effectiveness.” In it, he examined military command and combat effectiveness through the experience of the British 51st Highland Division in the 1944 Normandy Campaign. Most usefully, King developed a definition of military command that clarifies its relationship to combat effectiveness: “The function of a commander is to maximise combat power by defining achievable missions and, then, orchestrating subordinates into a cohesive whole committed to mission accomplishment.”

Defining Military Command

In order to analyze the relationship between command and combat effectiveness, King sought to “define the concept of command and to specify its relationship to management and leadership.” The construct he developed drew upon the work of Peter Drucker, an Austrian-born American business consultant and writer who is considered by many to be “the founder of modern management.” From Drucker, King distilled a definition of the function and process of military command: “command always consists of three elements: mission definition, mission management and mission motivation.”

As King explained, “When command is understood in this way, its connection to combat effectiveness begins to become clear.”

[C]ommand is an institutional solution to an organizational problem; it generates cohesion in a formation. Specifically, by uniting decision-making authority in one person and one role, a large military force is able to unite subordinate units, whose troops are not co-present with each other and who, in most cases, do not know each other. Crucially, the combat effectiveness of a formation, as a formation, is substantially dependent upon the ability of its commander to synchronise its disparate efforts in order to generate collective effects. Skillful command has a galvanising influence on a military force; by orchestrating the activities of subordinate units and motivating troops, command is able to create a level of combat power, which supervenes the capabilities of each of the parts. A well-commanded force has properties, which exceed those of its constituent units, fighting alone.

It is through the orchestration, synchronization, and motivation of effort, King concluded, that “command and combat effectiveness are immediately connected. Command fuses a formation together and increases its determination to fulfil its missions.”

Assessing the Combat Effectiveness of the 51st Division

The rest of King’s article is a detailed assessment of the combat effectiveness of the 51st Highland Division in Normandy in June and July 1944 using this military command construct. Observers at the time noted a decline in the division’s combat performance, which had been graded quite highly in North Africa and Sicily. The one obvious difference was the replacement of Major General Douglas Wimberley with Major General Charles Bullen-Smith in August 1943. After concluding that the 51st Division was no longer battleworthy, the commander of the British 21st Army Group, General Bernard Montgomery personally relieved Bullen-Smith in late July 1944.

In reviewing Bullen-Smith’s performance, King concluded that

Although a number of factors contributed to the struggles of the Highland Division in Normandy, there is little doubt that the shortcomings of its commander, Major General Charles Bullen-Smith, were the critical factor. Charles Bullen-Smith failed to fulfill the three essential functions required of a commander… Bullen-Smith’s inadequacies are highly suggestive of a direct relationship between command and combat effectiveness; they demonstrate how command can augment or undermine combat performance.

King’s approach to military studies once again demonstrates the relevance of multi-disciplinary analysis based on solid historical research. His military command model should prove to be a very useful tool for analyzing the elements of combat effectiveness and assessing combat power. Along with Dr. Jonathan Fennell’s work on measuring morale, among others, it appears that good progress is being made on the study of human factors in combat and military operations, at least in the British academic community (even if Tom Ricks thinks otherwise).

Validating Trevor Dupuy’s Combat Models

[The article below is reprinted from Winter 2010 edition of The International TNDM Newsletter.]

A Summation of QJM/TNDM Validation Efforts

By Christopher A. Lawrence

There have been six or seven different validation tests conducted of the QJM (Quantified Judgment Model) and the TNDM (Tactical Numerical Deterministic Model). As the changes to these two models are evolutionary in nature but do not fundamentally change the nature of the models, the whole series of validation tests across both models is worth noting. To date, this is the only model we are aware of that has been through multiple validations. We are not aware of any DOD [Department of Defense] combat model that has undergone more than one validation effort. Most of the DOD combat models in use have not undergone any validation.

The Two Original Validations of the QJM

After its initial development using a 60-engagement WWII database, the QJM was tested in 1973 by application of its relationships and factors to a validation database of 21 World War II engagements in Northwest Europe in 1944 and 1945. The original model proved to be 95% accurate in explaining the outcomes of these additional engagements. Overall accuracy in predicting the results of the 81 engagements in the developmental and validation databases was 93%.[1]

During the same period the QJM was converted from a static model that only predicted success or failure to one capable of also predicting attrition and movement. This was accomplished by adding variables and modifying factor values. The original QJM structure was not changed in this process. The addition of movement and attrition as outputs allowed the model to be used dynamically in successive “snapshot” iterations of the same engagement.

From 1973 to 1979 the QJM’s formulae, procedures, and variable factor values were tested against the results of all of the 52 significant engagements of the 1967 and 1973 Arab-Israeli Wars (19 from the former, 33 from the latter). The QJM was able to replicate all of those engagements with an accuracy of more than 90%?[2]

In 1979 the improved QJM was revalidated by application to 66 engagements. These included 35 from the original 81 engagements (the “development database”), and 31 new engagements. The new engagements included five from World War II and 26 from the 1973 Middle East War. This new validation test considered four outputs: success/failure, movement rates, personnel casualties, and tank losses. The QJM predicted success/failure correctly for about 85% of the engagements. It predicted movement rates with an error of 15% and personnel attrition with an error of 40% or less. While the error rate for tank losses was about 80%, it was discovered that the model consistently underestimated tank losses because input data included all kinds of armored vehicles, but output data losses included only numbers of tanks.[3]

This completed the original validations efforts of the QJM. The data used for the validations, and parts of the results of the validation, were published, but no formal validation report was issued. The validation was conducted in-house by Colonel Dupuy’s organization, HERO [Historical Evaluation Research Organization]. The data used were mostly from division-level engagements, although they included some corps- and brigade-level actions. We count these as two separate validation efforts.

The Development of the TNDM and Desert Storm

In 1990 Col. Dupuy, with the collaborative assistance of Dr. James G. Taylor (author of Lanchester Models of Warfare [vol. 1] [vol. 2], published by the Operations Research Society of America, Arlington, Virginia, in 1983) introduced a significant modification: the representation of the passage of time in the model. Instead of resorting to successive “snapshots,” the introduction of Taylor’s differential equation technique permitted the representation of time as a continuous flow. While this new approach required substantial changes to the software, the relationship of the model to historical experience was unchanged.[4] This revision of the model also included the substitution of formulae for some of its tables so that there was a continuous flow of values across the individual points in the tables. It also included some adjustment to the values and tables in the QJM. Finally, it incorporated a revised OLI [Operational Lethality Index] calculation methodology for modem armor (mobile fighting machines) to take into account all the factors that influence modern tank warfare.[5] The model was reprogrammed in Turbo PASCAL (the original had been written in BASIC). The new model was called the TNDM (Tactical Numerical Deterministic Model).

Building on its foundation of historical validation and proven attrition methodology, in December 1990, HERO used the TNDM to predict the outcome of, and losses from, the impending Operation DESERT STORM.[6] It was the most accurate (lowest) public estimate of U.S. war casualties provided before the war. It differed from most other public estimates by an order of magnitude.

Also, in 1990, Trevor Dupuy published an abbreviated form of the TNDM in the book Attrition: Forecasting Battle Casualties and Equipment Losses in Modern War. A brief validation exercise using 12 battles from 1805 to 1973 was published in this book.[7] This version was used for creation of M-COAT[8] and was also separately tested by a student (Lieutenant Gozel) at the Naval Postgraduate School in 2000.[9] This version did not have the firepower scoring system, and as such neither M-COAT, Lieutenant Gozel’s test, nor Colonel Dupuy’s 12-battle validation included the OLI methodology that is in the primary version of the TNDM.

For counting purposes, I consider the Gulf War the third validation of the model. In the end, for any model, the proof is in the pudding. Can the model be used as a predictive tool or not? If not, then there is probably a fundamental flaw or two in the model. Still the validation of the TNDM was somewhat second-hand, in the sense that the closely-related previous model, the QJM, was validated in the 1970s to 200 World War II and 1967 and 1973 Arab-Israeli War battles, but the TNDM had not been. Clearly, something further needed to be done.

The Battalion-Level Validation of the TNDM

Under the guidance of Christopher A. Lawrence, The Dupuy Institute undertook a battalion-level validation of the TNDM in late 1996. This effort tested the model against 76 engagements from World War I, World War II, and the post-1945 world including Vietnam, the Arab-Israeli Wars, the Falklands War, Angola, Nicaragua, etc. This effort was thoroughly documented in The International TNDM Newsletter.[10] This effort was probably one of the more independent and better-documented validations of a casualty estimation methodology that has ever been conducted to date, in that:

  • The data was independently assembled (assembled for other purposes before the validation) by a number of different historians.
  • There were no calibration runs or adjustments made to the model before the test.
  • The data included a wide range of material from different conflicts and times (from 1918 to 1983).
  • The validation runs were conducted independently (Susan Rich conducted the validation runs, while Christopher A. Lawrence evaluated them).
  • The results of the validation were fully published.
  • The people conducting the validation were independent, in the sense that:

a) there was no contract, management, or agency requesting the validation;
b) none of the validators had previously been involved in designing the model, and had only very limited experience in using it; and
c) the original model designer was not able to oversee or influence the validation.[11]

The validation was not truly independent, as the model tested was a commercial product of The Dupuy Institute, and the person conducting the test was an employee of the Institute. On the other hand, this was an independent effort in the sense that the effort was employee-initiated and not requested or reviewed by the management of the Institute. Furthermore, the results were published.

The TNDM was also given a limited validation test back to its original WWII data around 1997 by Niklas Zetterling of the Swedish War College, who retested the model to about 15 or so Italian campaign engagements. This effort included a complete review of the historical data used for the validation back to their primarily sources, and details were published in The International TNDM Newsletter.[12]

There has been one other effort to correlate outputs from QJM/TNDM-inspired formulae to historical data using the Ardennes and Kursk campaign-level (i.e., division-level) databases.[13] This effort did not use the complete model, but only selective pieces of it, and achieved various degrees of “goodness of fit.” While the model is hypothetically designed for use from squad level to army group level, to date no validation has been attempted below battalion level, or above division level. At this time, the TNDM also needs to be revalidated back to its original WWII and Arab-Israeli War data, as it has evolved since the original validation effort.

The Corps- and Division-level Validations of the TNDM

Having now having done one extensive battalion-level validation of the model and published the results in our newsletters, Volume 1, issues 5 and 6, we were then presented an opportunity in 2006 to conduct two more validations of the model. These are discussed in depth in two articles of this issue of the newsletter.

These validations were again conducted using historical data, 24 days of corps-level combat and 25 cases of division-level combat drawn from the Battle of Kursk during 4-15 July 1943. It was conducted using an independently-researched data collection (although the research was conducted by The Dupuy Institute), using a different person to conduct the model runs (although that person was an employee of the Institute) and using another person to compile the results (also an employee of the Institute). To summarize the results of this validation (the historical figure is listed first followed by the predicted result):

There was one other effort that was done as part of work we did for the Army Medical Department (AMEDD). This is fully explained in our report Casualty Estimation Methodologies Study: The Interim Report dated 25 July 2005. In this case, we tested six different casualty estimation methodologies to 22 cases. These consisted of 12 division-level cases from the Italian Campaign (4 where the attack failed, 4 where the attacker advanced, and 4 Where the defender was penetrated) and 10 cases from the Battle of Kursk (2 cases Where the attack failed, 4 where the attacker advanced and 4 where the defender was penetrated). These 22 cases were randomly selected from our earlier 628 case version of the DLEDB (Division-level Engagement Database; it now has 752 cases). Again, the TNDM performed as well as or better than any of the other casualty estimation methodologies tested. As this validation effort was using the Italian engagements previously used for validation (although some had been revised due to additional research) and three of the Kursk engagements that were later used for our division-level validation, then it is debatable whether one would want to call this a seventh validation effort. Still, it was done as above with one person assembling the historical data and another person conducting the model runs. This effort was conducted a year before the corps and division-level validation conducted above and influenced it to the extent that we chose a higher CEV (Combat Effectiveness Value) for the later validation. A CEV of 2.5 was used for the Soviets for this test, vice the CEV of 3.0 that was used for the later tests.

Summation

The QJM has been validated at least twice. The TNDM has been tested or validated at least four times, once to an upcoming, imminent war, once to battalion-level data from 1918 to 1989, once to division-level data from 1943 and once to corps-level data from 1943. These last four validation efforts have been published and described in depth. The model continues, regardless of which validation is examined, to accurately predict outcomes and make reasonable predictions of advance rates, loss rates and armor loss rates. This is regardless of level of combat (battalion, division or corps), historic period (WWI, WWII or modem), the situation of the combats, or the nationalities involved (American, German, Soviet, Israeli, various Arab armies, etc.). As the QJM, the model was effectively validated to around 200 World War II and 1967 and 1973 Arab-Israeli War battles. As the TNDM, the model was validated to 125 corps-, division-, and battalion-level engagements from 1918 to 1989 and used as a predictive model for the 1991 Gulf War. This is the most extensive and systematic validation effort yet done for any combat model. The model has been tested and re-tested. It has been tested across multiple levels of combat and in a wide range of environments. It has been tested where human factors are lopsided, and where human factors are roughly equal. It has been independently spot-checked several times by others outside of the Institute. It is hard to say what more can be done to establish its validity and accuracy.

NOTES

[1] It is unclear what these percentages, quoted from Dupuy in the TNDM General Theoretical Description, specify. We suspect it is a measurement of the model’s ability to predict winner and loser. No validation report based on this effort was ever published. Also, the validation figures seem to reflect the results after any corrections made to the model based upon these tests. It does appear that the division-level validation was “incremental.” We do not know if the earlier validation tests were tested back to the earlier data, but we have reason to suspect not.

[2] The original QJM validation data was first published in the Combat Data Subscription Service Supplement, vol. 1, no. 3 (Dunn Loring VA: HERO, Summer 1975). (HERO Report #50) That effort used data from 1943 through 1973.

[3] HERO published its QJM validation database in The QJM Data Base (3 volumes) Fairfax VA: HERO, 1985 (HERO Report #100).

[4] The Dupuy Institute, The Tactical Numerical Deterministic Model (TNDM): A General and Theoretical Description, McLean VA: The Dupuy Institute, October 1994.

[5] This had the unfortunate effect of undervaluing WWII-era armor by about 75% relative to other WWII weapons when modeling WWII engagements. This left The Dupuy Institute with the compromise methodology of using the old OLI method for calculating armor (Mobile Fighting Machines) when doing WWII engagements and using the new OLI method for calculating armor when doing modem engagements

[6] Testimony of Col. T. N. Dupuy, USA, Ret, Before the House Armed Services Committee, 13 Dec 1990. The Dupuy Institute File I-30, “Iraqi Invasion of Kuwait.”

[7] Trevor N. Dupuy, Attrition: Forecasting Battle Casualties and Equipment Losses in Modern War (HERO Books, Fairfax, VA, 1990), 123-4.

[8] M-COAT is the Medical Course of Action Tool created by Major Bruce Shahbaz. It is a spreadsheet model based upon the elements of the TNDM provided in Dupuy’s Attrition (op. cit.) It used a scoring system derived from elsewhere in the U.S. Army. As such, it is a simplified form of the TNDM with a different weapon scoring system.

[9] See Gözel, Ramazan. “Fitting Firepower Score Models to the Battle of Kursk Data,” NPGS Thesis. Monterey CA: Naval Postgraduate School.

[10] Lawrence, Christopher A. “Validation of the TNDM at Battalion Level.” The International TNDM Newsletter, vol. 1, no. 2 (October 1996); Bongard, Dave “The 76 Battalion-Level Engagements.” The International TNDM Newsletter, vol. 1, no. 4 (February 1997); Lawrence, Christopher A. “The First Test of the TNDM Battalion-Level Validations: Predicting the Winner” and “The Second Test of the TNDM Battalion-Level Validations: Predicting Casualties,” The International TNDM Newsletter, vol. 1 no. 5 (April 1997); and Lawrence, Christopher A. “Use of Armor in the 76 Battalion-Level Engagements,” and “The Second Test of the Battalion-Level Validation: Predicting Casualties Final Scorecard.” The International TNDM Newsletter, vol. 1, no. 6 (June 1997).

[11] Trevor N. Dupuy passed away in July 1995, and the validation was conducted in 1996 and 1997.

[12] Zetterling, Niklas. “CEV Calculations in Italy, 1943,” The International TNDM Newsletter, vol. 1, no. 6. McLean VA: The Dupuy Institute, June 1997. See also Research Plan, The Dupuy Institute Report E-3, McLean VA: The Dupuy Institute, 7 Oct 1998.

[13] See Gözel, “Fitting Firepower Score Models to the Battle of Kursk Data.”

TDI Friday Read: Principles Of War & Verities Of Combat

[izquotes.com]

Trevor Dupuy distilled his research and analysis on combat into a series of verities, or what he believed were empirically-derived principles. He intended for his verities to complement the classic principles of war, a slightly variable list of maxims of unknown derivation and provenance, which describe the essence of warfare largely from the perspective of Western societies. These are summarized below.

What Is The Best List Of The Principles Of War?

The Timeless Verities of Combat

Trevor N. Dupuy’s Combat Attrition Verities

Trevor Dupuy’s Combat Advance Rate Verities

Trevor Dupuy on Military Innovation

In an article published by the Association of the U.S. Army last November that I missed on the first go around, U.S. Army Colonel Eric E. Aslakson and Lieutenant Colonel Richard T. Brown, (ret.) make the argument that “Staff colonels are the Army’s innovation center of gravity.”

The U.S. defense community has settled upon innovation as one of the key methods for overcoming the challenges posed by new technologies and strategies adapted by potential adversaries, as articulated in the Third Offset Strategy developed by the late Obama administration. It is becoming clear however, that a desire to innovate is not the same as actual innovation. Aslakson and Brown make the point that innovation is not simply technological development and identify what they believe is a crucial institutional component of military innovation in the U.S. Army.

Innovation is differentiated from other forms of change such as improvisation and adaptation by the scale, scope and impact of that value creation. Innovation is not about a new widget or process, but the decisive value created and the competitive advantage gained when that new widget or process is applied throughout the Army or joint force…

However, none of these inventions or activities can rise to the level of innovation unless there are skilled professionals within the Army who can convert these ideas into competitive advantage across the enterprise. That is the role of a colonel serving in a major command staff leadership assignment…

These leaders do not typically create the change. But they have the necessary institutional and operational expertise and experience, contacts, resources and risk tolerance to manage processes across the entire framework of doctrine, organization, training, materiel, leadership and education, personnel and facilities, converting invention into competitive advantage.

In his seminal book, The Evolution of Weapons and Warfare (Indianapolis, IN: The Bobbs-Merrill Company, Inc., 1980), Trevor Dupuy noted a pattern in the historical relationship between development of weapons of increasing lethality and their incorporation in warfare. He too noted that the crucial factor was not the technology itself, but the organizational approach to using it.

When a radically new weapon appears and is first adopted, it is inherently incongruous with existing weapons and doctrine. This is reflected in a number of ways; uncertainty and hesitation in coordination of the new weapon with earlier ones; inability to use it consistently, effectively, and flexibly in offensive action, which often leads to tactical stalemate; vulnerability of the weapon and of its users to hostile countermeasures; heavy losses incident to the employment of the new weapon, or in attempting to oppose it in combat. From this it is possible to establish the following criteria of assimilation:

  1. Confident employment of the weapon in accordance with a doctrine that assures its coordination with other weapons in a manner compatible with the characteristics of each.
  2. Consistently effective, flexible use of the weapon in offensive warfare, permitting full employment of the advantages of superior leadership and/or superior resources.
  3. Capability of dealing effectively with anticipated and unanticipated countermeasures.
  4. Sharp decline in casualties for those employing the weapon, often combined with a capability for inflicting disproportionately heavy losses on the enemy.

Based on his assessment of this historical pattern, Dupuy derived a set of preconditions necessary for a successful assimilation of new technology into warfare.

  1. An imaginative, knowledgeable leadership focused on military affairs, supported by extensive knowledge of, and competence in, the nature and background of the existing military system.
  2. Effective coordination of the nation’s economic, technological-scientific, and military resources.
    1. There must exist industrial or developmental research institutions, basic research institutions, military staffs and their supporting institutions, together with administrative arrangements for linking these with one another and with top decision-making echelons of government.
    2. These bodies must conduct their research, developmental, and testing activities according to mutually familiar methods so that their personnel can communicate, can be mutually supporting, and can evaluate each other’s results.
    3. The efforts of these institutions—in related matters—must be directed toward a common goal.
  3. Opportunity for battlefield experimentation as a basis for evaluation and analysis.

Does the U.S. defense establishment’s organizational and institutional approach to innovation meet these preconditions? Good question.