Tag Russia

Military Expenditures

The American political campaign has ended up discussing NATO recently, including one candidate who states that NATO is “obsolete.” The sense is that America’s allies are not pulling their weight. Let us just look at some comparative defense budgets for a moment. Most figures below are estimates for 2015 from the International Institute of Strategic Studies (IISS), a private UK based organization. I cannot vouch for their accuracy, but they have been doing this for a while.

United States: $597.5 Billion or 3.3% of GDP

Now, our NATO allies are spending much less. The big spender is the United Kingdom at 56.2 billion or 2% of their GDP. This is followed by Germany at 36.6 billion which is only 1.1% of their rather large GDP (largest economy in Europe). France is at 32.0 billion or 1.9% of their GDP (note that the SIPRI figures are much higher for France). Other large NATO countries include:

Turkey…..….22.6….2.2% (these are 2014 SIPRI figures)

Italy….…..….21.1….1.1%

Canada………14.0…..0.9%

Spain…………10.7…..0.9%

Poland…..…..10.3….2.1%

Netherlands…10.1.…1.2% (these are 2014 SIPRI figures)

Total NATO expenditures (not including United States) for 2014 was $310 billion (SIPRI figures). I gather it is now somewhat less. It was the goal once that every member of NATO spent 2% of their GDP on national defense. Many NATO members are far below that goal.

So, it would appear that the U.S. spending 3.3% of its GDP on defense, while no major country in NATO is spending much more than 2% of its GDP on defense. In contrast Russia is spending $51.6 billion or 4.1% of GDP. So certainly between England, Germany, France, Italy, Turkey, Spain, Poland and the Netherlands they are spending at least $195.2 billon on defense, which is almost four times what Russia is spending.

If one looks to the Pacific, one sees the same pattern. The United States spends 597.5 billion on defense or 3.3%. Our ally Japan spends 41.4 billion or 1.0% of GDP. South Korea, sitting opposite the very unstable and dangerous North Korea, spends 33.4 million on defense or 2.4% of GDP. Taiwan, still claimed as a province by China, spends 10.2 billion or 1.9% of GDP.

In contrast China is spending 145.8 billion on defense or 1.2% of its GDP.


Now these are mostly IISS figures, there are somewhat different figures provided by the Stockholm International Peace Research Institute (SIPRI). For example they have the U.S. budget figures at 596.0 (vice 597.5) but this makes up 3.9% of GDP (vice 3.3%). Not sure why there is such a big difference in the figures for percent of GDP. They have a much higher figure for China (215 billion at 1.9% of GDP), Russia (66.4 billion at 5.4% of GDP) and France (50.9 billion at 2.1% of GDP). They have a world total figure of 1,676 billion (of which the United States spending makes up 35.6%) while the IISS has a world total figure of 1,563 billion (of which the United States spending makes up 38.2%).

Of course, this does not address how much “bang for the buck” people are getting.

Kursk Book Availability

Kursk

Amazon.com is now charging $275 for my Kursk book. For some reason, they had always discounted it to below list price. Last week, the discounted ended and it now cost well above list price. We have no say in what Amazon.com does or does not do. We have watched the odd price fluctuations on the book prices there with considerable bemusement.

It is available from Aberdeen Bookstore at the list price of $195. If you click on the image of the book to the right of this post then it will lead you there.

The link is: Aberdeen Bookstore


Greater Economic Backwardness and Revolution

An article in the History News Network got my attention

Greater economic backwardness

A few lines caught my attention:

  1. “For the first time the researchers found that the greater the development gap….the more likely a country has experienced non-violent and violent mass demonstrations for regime change…”
  2. “Events in the Arab Spring and in the Euro-Maidan demonstrations in the Ukraine, show that the frustrated desire to catch up with the frontier era can extend to the political sphere, particularly with repressive regimes.”

Well, this is probably very interesting work and I probably need to scare up a copy. The “for the first time” claim caught my attention in light of the work by Ted Gurr and Feierabend & Feierabend in the 1960s, which I am familiar with. I have posted on their work before. Of course, what Gurr and the Feierabends’ work showed was that (and this is paraphrasing from my memory):

  1. Poorer countries had more political violence that richer countries.
  2. Really poor countries had less political violence than developing countries (poor countries that are getting richer).
  3. Political violence went up when the economy went down.

The sense I have from the Gurr and Feierabend’s work is that the least stable countries are those that were developing economically and then stalled or went into recession. This, of course, is the scenario with Russia (and others like Venezuela) and possibly may become the scenario in China.


Wargaming the Defense of the Baltics

RAND Wargame
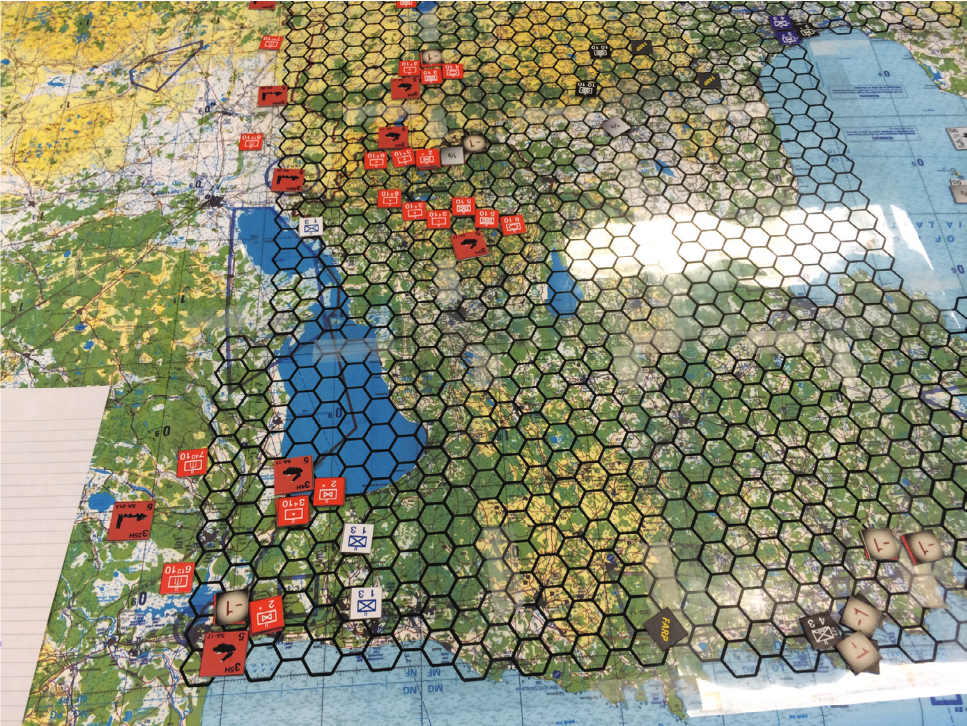
Source: David A. Shlapak and Michael Johnson. Reinforcing Deterrence on NATO’s Eastern Flank: Wargaming the Defense of the Baltics. Santa Monica, CA: RAND Corporation, 2016.

RAND has published a new report by analysts David A. Shlapak and Michael Johnson detailing their assessment of the threat to the Baltic republics of conventional invasion by Russian military forces. The conclusions of the study are sobering — that NATO could do little to prevent Russian military forces from effectively overrunning Latvia and Estonia in as few as 60 hours. Their analysis should provide plenty of food for thought.

Just as interesting, however, is that Shlapak and Johnson used old-style paper wargaming techniques to facilitate their analysis. The image above of their home-designed wargame above should warm the cockles of any Avalon Hill or SPI board wargame enthusiast of a certain age. As to why they chose this approach, they stated:

RAND developed this map-based tabletop exercise because existing models were ill-suited to represent the many unknowns and uncertainties surrounding a conventional military campaign in the Baltics, where low force-to-space ratios and relatively open terrain meant that maneuver between dispersed forces—rather than pushing and shoving between opposing units arrayed along a linear front—would likely be the dominant mode of combat.

While they did state that they used rules and tables governing movement and combat based on “offline modeling,” it is very curious that they did not find any of the many sophisticated Defense Department computer models and simulations available to be suitable for their task. They outline their methodology in an appendix, but promise to provide a fuller report at a later date.