Tag quantitative analysis

Series of Tubes

clip_image002

RAND has published a report on its analysis of “NATO’s Eastern Flank” (meaning the three Baltic states). The PDF can be obtained here: http://www.rand.org/pubs/research_reports/RR1253.html  Of particular interest to us is Appendix A: Methodology and Data (page 12).

RAND is using a hex board game with counters that appears to have strength and movement factors on them. This is Tactics II…Avalon Hill…..SPI. RAND does have their own combat model, JICM (Joint Integrated Contingency Model), so why are they using a hex board game? According to their article:

RAND developed this map-based tabletop exercise because existing models were ill-suited to represent the many unknowns and uncertainties surrounding a conventional military campaign in the Baltics, where low force-to-space ratios and relatively open terrain meant that maneuver between dispersed forces—rather than pushing and shoving between opposing units arrayed along a linear front—would likely be the dominant mode of combat.

The problem is that JICM does movement down to having a series of “places” that are connected by “links.“ These links are tubes of variable width, connecting between each “place”. So for example, there might be a tube between St. Petersburg and Talinin. All combat would occur up and down this tube, but there could be no real movement out of the tube. This is a limited and somewhat inflexible movement system that has been used in a few other models (SOTACA comes to mind).

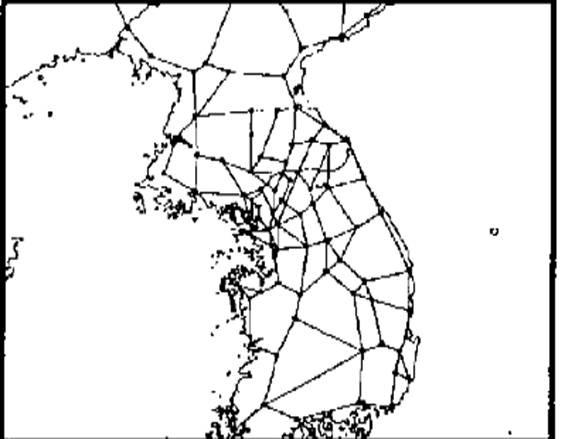
Now, I gather RAND has the whole map of the world set up for JICM as a “series of tubes.” According a 1995 report, there were nearly 1000 “places” and 2000 “links” for the entire world. This does not give a lot of fidelity, as the map of Korea shows at the top of the post. I suspect the fidelity is such that there are few tubes in an area as small as Estonia.

Estonia is small. It is 17,505 square miles. This is smaller than West Virginia (24,038 sq. miles), and it is a lot flatter. But, somehow, they have managed to maintain an independent language of over a million speakers (1.2 million actually). This language has managed to survive for over a thousand years! I am always impressed by that. Their capital is only about 100 miles from several points along the Russian border. This is about the distance between Washington DC and Richmond. Now granted, it took several years to cover that distance during the American Civil War, but there was a significant Confederate Army in the path. Therefore, to examine scenarios, I suspect they needed a map of considerably more fidelity than JICM and its “series of tubes.”

Why Men Rebel?

In the 1960s, there were two big-budget quantitative historical studies conducted of the causes of revolution. One was by Ted Gurr of Princeton University and resulted in the 1970 book Why Men Rebel? The other similar effort was done by a husband and wife team of Ivo and Rosalind Feierabend out at San Diego State University. They published their data and results in a series of articles and in 1972 in a compilation book (Anger, Violence and Politics: Theories and Research). Ted Gurr’s work is much more widely known, although in the 1980s when I reviewed both of their works in depth, I found them to be similar and of equal quality.

Both Ted Gurr’s and the Feierabend’s work was based upon measuring political violence, which was a very relevant subject back in the 1960s. I believe that both projects were U.S. government funded. They both collected extensive data on violence in every county in the world in the post-WWII era (their data cut off was in the late 1960s) and created an index of political violence by country. They then built a multi-variant regression model to try to measure what causes those levels of violence.

Although they were completely separate and isolated efforts, using different data collections, they ended up pretty much reaching similar conclusions (much like what happened with my work and Andrew Hossack’s work). They were both cross-national studies that tried to determine the level of political violence in a country based on a range of factors. Like with any extensive quantitative analysis, there were a lot of elements and interesting findings in this work. But, they both put front and center a “relative deprivation” hypothesis of the causes of political violence (and/or rebellion). Basically, what this said was that if things are going well, and then they start going badly, this creates the highest chance for ‘regime change.”

So, for example, in their data sample the rich (or developed) countries tended to be very stable. Very poor countries (undeveloped) were less stable. But the least stable countries are those somewhere between rich and poor that are getting wealthier (what they called at the time developing countries). They tend to be stable when they are economically growing, but once the growth stops, they become unstable. If there is any validity to this hypothesis (and there certainly was using the twenty years of data from around 1948 to 1968), then this leads to me to wonder about the long-term stability of Russia and China.

A summary of Why Men Rebel is here: http://wikisum.com/w/Gurr:_Why_men_rebel. As the summery notes: “(3) “Progressive deprivation” [the J-curve]–expectations grow [we expect continued growth] and capabilities do to, but capabilities either don’t keep up or start to fall (pg 53)–modernization, depression in a growing country, or other change could cause this. [What he wrote in 1970 about this describes nicely what happened with the fall of the USSR.]”

It would be interesting, in light of almost 50 more years of data since they did their work, if someone took their regression models and ran the last 50 years of data through them to see how they did. I always like to see a little model validation (although this is rarely done).

President Obama’s Casualty Estimates

Well, looks like President Obama is giving out casualty estimates for a potential intervention.

That used to be our job.

His estimate was for “sending significant ground forces back to the Middle East”

The results were:

1. “…could conceivably result in the deaths of 100 American soldiers every month.”
2. “…could take up to $10 billion a month…”
3. “….and leave as many as 500 troops wounded every month in addition to those killed…”

“Mr. Obama explained that his refusal to redeploy large numbers of troops to the region was rooted in the grim assumption that the casualties and costs would rival the worst of the Iraq war. “

Clearly this was a worst case situation based upon some study or analysis done. Do not know who did the study and I not think the study is in the public domain.

This is clearly just applying the Iraq War model to the current situation. In the case of Iraq, we had over 100,000 troops deployed and were directly and often by ourselves engaged with a major insurgency. This was generating 100 deaths on some months. This is 1200 a year. We lost people at that rate for four years in Iraq (2004 = 849, 2005 = 846, 2006 – 823, 2007 – 904).

On the other hand, it appear that most people talking intervention in Syria and Iraq appear to be discussing training missions with some ground support. I do not think anyone is seriously talking about putting a 100,000 troops back in. I think most people are talking about 10,000 to 20,000 troops primarily as trainers for the Syrian insurgents, the Kurds and the Iraq government. This is in effect what we currently have in Afghanistan. Our post surge losses there are more like 100 a year (2013 = 127, 2014 = 55, 2015 = 16).

Needless to say, loss rates are tied to the force size. A force fully engaged of 20,000 is not going to suffer the same number of losses as a force fully engaged of 100,000. And, we are looking at missions that are primarily training and support, which should suffer losses less than forces that are fully engaged.

Of course, The Dupuy Institute did a casualty estimate for a peacekeeping force of 20,000 for Bosnia, and we have done a casualty estimate for major counterinsurgency force of 100,000+ for Iraq. An estimate for a training and support mission of 20,000 people would be much lower than our estimate for Iraq.