Tag quantitative analysis

The Meaning of Military Expenditures II

In response to my last blog post I basically threw out a menu of possible conclusions. I received a very nicely thought out response to that post from Mike Johnson, which I felt was deserving its own blog post. His response is below (with his permission, of course):

With regard to the 20 April 2016 blog entry about military expenditures, I appreciated the list of possible conclusions and thought I would throw discussion points.

The comparison between US and other country defense spending is interesting, including the often mentioned statement that the US spends as much on defense as the next 10 countries combined.  I remember, from when I was in OPNAV N80 a couple of decades ago, that our NATO allies had twice as many active duty personnel and twice as many reservists as all the US Services combined. Yet, their combined defense budgets were less than what we were spending on our people in our military personnel and reserve personnel appropriations. Of course, back then Germany and France and many others still had conscription and less is usually spent on conscripts. But, it still leads to some serious questions about how to compare defense budgets when our allies could have twice the personnel and their total budgets were less than what we spent just on our personnel.  Several factors come into play. First, we have retirees being paid starting around age 40 or even earlier.  I don’t know of any other country that pays retirees before the mid-50s if not the 60s. Second, the retirement and a lot of the heath care are paid by other departments in most other governments, but in the US DoD pays into these programs.  Base pay for British military, by comparable grade, is actually more than in the US military; but we then add BAH and BAS on top (tax free); in the UK, the MOD subsidizes housing, but the serviceman has to pay a part. It isn’t clear whether the UK or the US serviceman of comparable grade has more “take home pay” so I don’t think the difference is that we pay our servicemen significantly more than other countries.

When it comes to Russia and China, in particular, conversions using market rates understate what is spent for most of the defense spending.  I had a colleague over the years–an expert on the Soviets–who would argue that Russian Federation soldiers had to be underfed, and suffering from malnutrition, because of the amount they were paid and given for meals.  I pointed out that meals certainly should use PPP and not market rates to convert and at the time the ratio between the two was about 7 (PPP converted into about 7 times as many US dollars compared with what market rates; it is less dramatic today but still to be of consideration). Anything internal to the Russian or Chinese economies should, in my opinion, use PPP for the exchange (which compares the cost of comparable items in each system).  This is particularly true of personnel pay, messing, accommodations, and most of logistics.  I am not sure about weapon systems. These are paid for internally, but they do have a connection to the outside world.

The way we count is different.  For example, funding is appropriated to the Services and to agencies in OSD as a top line that can be obligated.  How that is paid for may come from many sources including revenue collected by the Service.  In European budgets, we routinely see factors like total resource and then they subtract from that number expected receipts amounting to several percent of the budget.  In other words, they spend more because they can spend their revenues (such as payments made by service members for their housing) for whatever they want, but they are deducted from the top line used for comparison.

The US military does spend a lot more than any other country, despite the above factors.  Part of that is what it takes to maintain 6 regional combatant commands. Part of it is maintaining a constant level of forces around the world.  A war with most of our enemies is much more likely to be in their front yard and not ours.  We spend a lot on R&D and a lot on keeping equipment modern. And we spend a lot on training personnel.

PPP is purchasing power parity, which is a comparison between the currencies of two countries at which each currency when exchanged for the other will purchase the same quantity of goods as it purchases at home. So, for example, when the ruble dropped from 30 to 60 to a dollar, the Soviet defense budget suddenly did not really drop in half. So a direct comparison of exchange rates between countries often de-values the defense expenditures of less developed countries, where good and services are relatively cheap. Comparing countries based upon PPP tries to adjust for that.

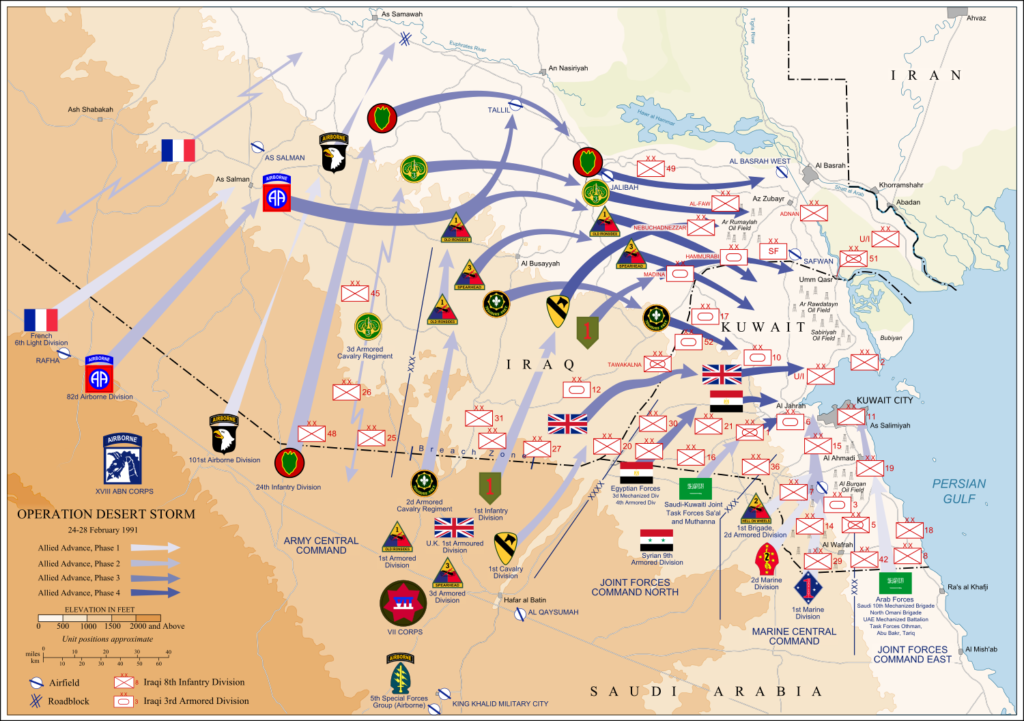
Assessing the TNDA 1990-91 Gulf War Forecast

Map of ground operations of Operation Desert Storm starting invasion February 24-28th 1991. Shows allied and Iraqi forces. Special arrows indicate the American 101st Airborne division moved by air and where the French 6st light division and American 3rd Armored Cavalry Regiment provided security. Image created by Jeff Dahl and reposted under the terms of the GNU Free Documentation License, Version 1.2.

[NOTE: This post has been edited to more accurately characterize Trevor Dupuy’s public comments on TNDA’s estimates.]

Operation DESERT STORM began on 17 January 1991 with an extended aerial campaign that lasted 38 days. Ground combat operations were initiated on 24 February and concluded after four days and four hours, with U.S. and Coalition forces having routed the Iraqi Army in Kuwait and in position to annihilate surviving elements rapidly retreating northward. According to official accounting, U.S. forces suffered 148 killed in action and 467 wounded in action, for a total of 614 combat casualties. An additional 235 were killed in non-hostile circumstances.[1]

In retrospect, TNDA’s casualty forecasts turned out to be high, with the actual number of casualties falling below the lowest +/- 50% range of estimates. Forecasts, of course, are sensitive to the initial assumptions they are based upon. In public comments made after the air campaign had started but before the ground phase began, Trevor Dupuy forthrightly stated that TNDA’s estimates were likely to be too high.[2]

In a post-mortem on the forecast in March 1991, Dupuy identified three factors which TNDA’s estimates miscalculated:

  • an underestimation of the effects of the air campaign on Iraqi ground forces;
  • the apparent surprise of Iraqi forces; and
  • an underestimation of the combat effectiveness superiority of U.S. and Coalition forces.[3]

There were also factors that influenced the outcome that TNDA could not have known beforehand. Its estimates were based on an Iraqi Army force of 480,000, a figure derived from open source reports available at the time. However, the U.S. Air Force’s 1993 Gulf War Air Power Survey, using intelligence collected from U.S. government sources, calculated that there were only 336,000 Iraqi Army troops in and near Kuwait in January 1991 (out of a nominal 540,000) due to unit undermanning and troops on leave. The extended air campaign led a further 25-30% to desert and inflicted about 10% casualties, leaving only 200,000-220,000 depleted and demoralized Iraqi troops to face the U.S. and Coalition ground offensive.[4].

TNDA also underestimated the number of U.S. and Coalition ground troops, crediting them with a total of 435,000, when the actual number was approximately 540,000.[5] Instead of the Iraqi Army slightly outnumbering its opponents in Kuwait as TNDA approximated (480,000 to 435,000), U.S. and Coalition forces probably possessed a manpower advantage approaching 2 to 1 or more at the outset of the ground campaign.

There were some aspects of TNDA’s estimate that were remarkably accurate. Although no one foresaw the 38-day air campaign or the four-day ground battle, TNDA did come quite close to anticipating the overall duration of 42 days.

DESERT STORM as planned and executed also bore a striking resemblance to TNDA’s recommended course of action. The opening air campaign, followed by the “left hook” into the western desert by armored and airmobile forces, coupled with holding attacks and penetration of the Iraqi lines on the Kuwaiti-Saudi border were much like a combination of TNDA’s “Colorado Springs,” “Leavenworth,” and “Siege” scenarios. The only substantive difference was the absence of border raids and the use of U.S. airborne/airmobile forces to extend the depth of the “left hook” rather than seal off Kuwait from Iraq. The extended air campaign served much the same intent as TNDA’s “Siege” concept. TNDA even anticipated the potential benefit of the unprecedented effectiveness of the DESERT STORM aerial attack.

How effective “Colorado Springs” will be in damaging and destroying the military effectiveness of the Iraqi ground forces is debatable….On the other hand, the circumstances of this operation are different from past efforts of air forces to “go it alone.” The terrain and vegetation (or lack thereof) favor air attacks to an exceptional degree. And the air forces will be operating with weapons of hitherto unsuspected accuracy and effectiveness against fortified targets. Given these new circumstances, and considering recent historical examples in the 1967 and 1973 Arab-Israeli Wars, the possibility that airpower alone can cause such devastation, destruction, and demoralization as to destroy totally the effectiveness of the Iraqi ground forces cannot be ignored. [6]

In actuality, the U.S. Central Command air planners specifically targeted Saddam’s government in the belief that air power alone might force regime change, which would lead the Iraqi Army to withdraw from Kuwait. Another objective of the air campaign was to reduce the effectiveness of the Iraqi Army by 50% before initiating the ground offensive.[7]

Dupuy and his TNDA colleagues did anticipate that a combination of extended siege-like assault on Iraqi forces in Kuwait could enable the execution of a quick ground attack coup de grace with minimized losses.

The potential of success for such an operation, in the wake of both air and ground efforts made to reduce the Iraqi capacity for offensive along the lines of either Operation “Leavenworth’…or the more elaborate and somewhat riskier “RazzleDazzle”…would produce significant results within a short time. In such a case, losses for these follow-on ground operations would almost certainly be lower than if they had been launched shortly after the war began.[8]

Unfortunately, TNDA did not hazard a casualty estimate for a potential “Colorado Springs/ Siege/Leavenworth/RazzleDazzle” combination scenario, a forecast for which might very well have come closer to the actual outcome.

Dupuy took quite a risk in making such a prominently public forecast, opening his theories and methodology to criticism and judgement. In my next post, I will examine how it stacked up with other predictions and estimates made at the time.

NOTES

[1] Nese F. DeBruyne and Anne Leland, “American War and Military Operations Casualties: Lists and Statistics,” (Washington, D.C.: Congressional Research Service, 2 January 2015), pp. 3, 11

[2] Christopher A. Lawrence, America’s Modern Wars: Understanding Iraq, Afghanistan and Vietnam (Philadelphia, PA: Casemate, 2015) p. 52

[3] Trevor N. Dupuy, “Report on Pre-War Forecasting For Information and Comment: Accuracy of Pre-Kuwait War Forecasts by T.N. Dupuy and HERO-TNDA,” 18 March, 1991. This was published in the April 1991 edition of the online wargaming “fanzine” Simulations Online. The post-mortem also included a revised TNDM casualty calculation for U.S. forces in the ground war phase, using the revised assumptions, of 70 killed and 417 wounded, for a total of 496 casualties. The details used in this revised calculation were not provided in the post-mortem report, so its veracity cannot be currently assessed.

[4] Thomas A. Keaney and Eliot A. Cohen, Gulf War Airpower Survey Summary Report (Washington, D.C.: U.S. Department of the Air Force, 1993), pp. 7, 9-10, 107

[5] Keaney and Cohen, Gulf War Airpower Survey Summary Report, p. 7

[6] Trevor N. Dupuy, Curt Johnson, David L. Bongard, Arnold C. Dupuy, How To Defeat Saddam Hussein: Scenarios and Strategies for the Gulf War (New York: Warner Books, 1991), p. 58

[7] Gulf War Airpower Survey, Vol. I: Planning and Command and Control, Pt. 1 (Washington, D.C.: U.S. Department of the Air Force, 1993), pp. 157, 162-165

[8] Dupuy, et al, How To Defeat Saddam Hussein, p. 114

The Meaning of Military Expenditures

My last post was a data dump without a conclusion. I probably need to add one, although I usually avoid providing opinions. There is no shortage of opinions in the American blogosphere and political landscape. I think a little less opinion and a little more data has value. If you want opinions, there are plenty of services out there who specialize in that, and from any perspective and viewpoint that you like.

From the previous Military Expenditures posting one could draw a number of conclusions:

  1. That the American allies in NATO and Asia are not carrying their weight…or…
  2. The threat from Russia and China is grossly overstated
    1. Russia’s defense expenditures are $51.6 billion while NATO (not including the U.S.) is around $300 billion.
    2. China’s defense expenditures are $145.8 billion (or is it $215 billion) while Japan, South Korea and Taiwan’s combined are $85 billion.
    3. The U.S. is spending $597.5 billion.
    4. …or….
  3. The U.S. is spending too much on defense.
    1. Beware of the “military-industrial complex?”
    2. …or….
  4. This is the cost of being the world leader (3.3% of GDP on defense)….or…
  5. The higher U.S. defense expenditures are certainly justified because:
    1. We are covering against Russia ($51.6 billion)
    2. We are covering against China ($145.8 billion)
    3. Then there is ISIL….and….
    4. Iraq, Afghanistan and Somalia
    5. We have other missions, like nuclear deterrence, that adds to our cost.
    6. We need to continue to develop and maintain our technological edge, and that costs money.
    7. …or….
  6. The U.S. is spending too much on the wrong things…or….
  7. Maybe defense budget is not really a good measurement of military power….or…
  8. Maybe Russia and China are getting more “bang for the buck” then the U.S. and its western allies….or…
  9. Whatever else I forgot to mention….or….
  10. Some or all of the above.

Anyhow, one could interpret the figures in my previous post a number of different ways depending on their own political leanings and biases.

And…..I still didn’t really add a conclusion.

Forecasting the 1990-1991 Gulf War

DoD photo by Regina Ali

In my last post on the subject of prediction in security studies, I mentioned that TDI has a public forecasting track record. The first of these, and possibly the most well know, involves the 1990-1991 Gulf War.

On 13 December 1990, Trevor N. Dupuy, President of Trevor N. Dupuy & Associates (TNDA), testified before the House Armed Services Committee on the topic of the looming military confrontation between the military forces of the United States and United Nations Coalition allies and those of Iraq.[1] He offered TNDA’s assessment of the potential character of the forthcoming conflict, as well as estimates of the likely casualties that both sides would suffer. Dupuy published a refined and expanded version of TNDA’s analysis in January 1991.[2]

Based on a methodology derived from Dupuy’s combat models and synthesized data on historical personnel and material combat attrition, TNDA forecast a successful U.S. and Coalition air/ground offensive campaign into Kuwait.[3] Using publicly available sources, TNDA calculated that Iraqi forces in Iraq numbered 480,000, U.S. forces at 310,000, and Coalition allies at 125,000.

The estimated number of casualties varied based on a campaign anticipated to last from 10 to 40 days depending on five projected alternate operational scenarios:

  • Operation “Colorado Springs.” A 10-day air campaign aimed at achieving air superiority and attacking Iraq’s ground forces and war-making infrastructure. While TNDA believed an air campaign would proceed any ground offensive option, Dupuy suggested that it could potentially force an Iraqi surrender without the need for a land attack.
  • Operation “Bulldozer.” A frontal assault on Iraqi forces in Kuwait, lasting 10-20 days.
  • Operation “Leavenworth.” A double envelopment of Iraqi forces in Kuwait using an armored turning force in the west and a U.S. Marine amphibious landing in the east.
  • Operation “RazzleDazzle.” Similar to “Leavenworth,” but combined with an assault along the Iraq-Kuwait border by airborne/airmobile forces for a triple envelopment to encircle all Iraqi forces in Kuwait.
  • Operation “Siege.” A combination of an extended Operation “Colorado Springs” and ground force raids on all of Iraq’s borders. After 10-20 days, one of the three ground attack options (“Bulldozer,” “Leavenworth,” or “RazzleDazzle”) would be initiated to conclude the war.

Based on these assumptions, TNDA produced a range of casualty predictions for U.S. forces that TNDA asserted would probably be accurate to within +/- 50%. These ranged from a low of 380 for a 10-day “Colorado Springs” air-only campaign, to a top-end calculation of 16,645 for a 10-day “Colorado Springs” followed by a 20-day “Bulldozer” frontal assault.

TNDA’s Projection of Likely U.S. Casualties

Scenario Duration

Killed

Wounded

Total

+/-50%

Colorado Springs

10-40 days

190-315

190-315

380-630

Bulldozer*

10-20 days

1,858-2,068

8,332-9,222

10,190-11,290

5,335-16,645

Leavenworth*

10-20 days

1,454-1,664

6,309-7,199

7,763-8,863

4,122-12,995

RazzleDazzle*

10-20 days

1,319-1,529

5,534-6,524

6,853-8,053

3,717-11,790

Siege*

10-30 days

564-1,339

1,858-5,470

2,422-6,809

1,451-10,479

* Figures include air casualties

Based on these calculations, TNDA recommended the following course of action:

If the above figures are close to accurate (and history tells us they should should be), then the proper solution is to begin the war with the air campaign of Operation “Colorado Springs.” If this should result in an Iraqi surrender, so much the better. If not, then after about ten days of “Colorado Springs,“ to continue the air campaign for about ten more days while initiating Operation “Siege.” If this does not bring about an Iraqi surrender, the ground campaign should be concluded with Operation “RazzleDazzle.” If this has not brought about an Iraqi surrender, then an advance should be made through the desert to destroy any resisting Iraqi forces and to occupy Baghdad if necessary.[4]

In my next post, I will assess the accuracy of TNDA’s forecast and how it stacked up against others made at the time.

Notes

[1] Armed Services Committee, U.S. House of Representatives, Testimony of Col. T. N. Dupuy, USA, Ret. (Washington D.C.: 13 December 1990)

[2] Trevor N. Dupuy, Curt Johnson, David L. Bongard, Arnold C. Dupuy, If War Comes, How To Defeat Saddam Hussein (McLean, VA.: HERO Books, 1991); subsequently republished as How To Defeat Saddam Hussein: Scenarios and Strategies for the Gulf War (New York: Warner Books, 1991).

[3] These are the Quantified Judgement Model (QJM) and Tactical Numerical Deterministic Model (TNDM). Dupuy’s methodological approach and his first cut on a Gulf War estimate are described in Chapter 7 of Trevor N. Dupuy, Attrition: Forecasting Battle Casualties and Equipment Losses in Modern War (McLean, VA.: HERO Books, 1990).

[4] Dupuy, et al, How To Defeat Saddam Hussein, 126

Military Expenditures

The American political campaign has ended up discussing NATO recently, including one candidate who states that NATO is “obsolete.” The sense is that America’s allies are not pulling their weight. Let us just look at some comparative defense budgets for a moment. Most figures below are estimates for 2015 from the International Institute of Strategic Studies (IISS), a private UK based organization. I cannot vouch for their accuracy, but they have been doing this for a while.

United States: $597.5 Billion or 3.3% of GDP

Now, our NATO allies are spending much less. The big spender is the United Kingdom at 56.2 billion or 2% of their GDP. This is followed by Germany at 36.6 billion which is only 1.1% of their rather large GDP (largest economy in Europe). France is at 32.0 billion or 1.9% of their GDP (note that the SIPRI figures are much higher for France). Other large NATO countries include:

Turkey…..….22.6….2.2% (these are 2014 SIPRI figures)

Italy….…..….21.1….1.1%

Canada………14.0…..0.9%

Spain…………10.7…..0.9%

Poland…..…..10.3….2.1%

Netherlands…10.1.…1.2% (these are 2014 SIPRI figures)

Total NATO expenditures (not including United States) for 2014 was $310 billion (SIPRI figures). I gather it is now somewhat less. It was the goal once that every member of NATO spent 2% of their GDP on national defense. Many NATO members are far below that goal.

So, it would appear that the U.S. spending 3.3% of its GDP on defense, while no major country in NATO is spending much more than 2% of its GDP on defense. In contrast Russia is spending $51.6 billion or 4.1% of GDP. So certainly between England, Germany, France, Italy, Turkey, Spain, Poland and the Netherlands they are spending at least $195.2 billon on defense, which is almost four times what Russia is spending.

If one looks to the Pacific, one sees the same pattern. The United States spends 597.5 billion on defense or 3.3%. Our ally Japan spends 41.4 billion or 1.0% of GDP. South Korea, sitting opposite the very unstable and dangerous North Korea, spends 33.4 million on defense or 2.4% of GDP. Taiwan, still claimed as a province by China, spends 10.2 billion or 1.9% of GDP.

In contrast China is spending 145.8 billion on defense or 1.2% of its GDP.


Now these are mostly IISS figures, there are somewhat different figures provided by the Stockholm International Peace Research Institute (SIPRI). For example they have the U.S. budget figures at 596.0 (vice 597.5) but this makes up 3.9% of GDP (vice 3.3%). Not sure why there is such a big difference in the figures for percent of GDP. They have a much higher figure for China (215 billion at 1.9% of GDP), Russia (66.4 billion at 5.4% of GDP) and France (50.9 billion at 2.1% of GDP). They have a world total figure of 1,676 billion (of which the United States spending makes up 35.6%) while the IISS has a world total figure of 1,563 billion (of which the United States spending makes up 38.2%).

Of course, this does not address how much “bang for the buck” people are getting.

Screw Theory! We Need More Prediction in Security Studies!

Johnny Carson as Carnac the Magnificent; taken from the January 24, 2005 broadcast of The Tonight Show.

My previous post touched on the apparent analytical bankruptcy underlying the U.S. government’s approach to counterterrorism policy. While many fingers were pointed at the government for this state of affairs, at least one scholar admitted that “the leading [academic] terrorism research was mostly just political theory and anecdotes” which has “left policy makers to design counterterrorism strategies without the benefit of facts.”

So what can be done about this? Well, Michael D. Ward, a Professor of Political Science at Duke University, has suggested a radical solution: test the theories to see if they can accurately predict real world outcomes. Ward recently published an article in the Journal of Global Security Studies (read it now before it goes behind the paywall) arguing in favor of less theory and more prediction in the fields of international relations and security studies.

[W]e need less theory because most theory is an attempt to rescue or adapt extant theory. We need more predictions in order to keep track of how well we understand the world around us. They will tell us how good our theories are and where we need better explanations.

As Ward explained,

[P]rediction is deeply embedded in the philosophy of science… The argument is that if you can develop models that provide an understanding—without a teleology of why things happen—you should be able to generate predictions that will not only be accurate, but may also be useful in a larger societal context.

Ward argued that “until very recently, most of this thread of work in security studies had been lost, or if not lost, at least abandoned.” The reason for this was the existence of a longstanding epistemological disagreement: “Many social scientists see a sharp distinction between explanation on the one hand and prediction on the other. Indeed, this distinction is often sharp enough that it is argued that doing one of these things cuts you out of doing the other.”

For the most part, Ward asserted, the theorists have won out over the empiricists.

[M]any scholars (but few others) will tell you that we need more theory. Doubtless they are right. Few of them really mean “theory” in the sense that I reserve for the term. Few of them mean “theory” in the sense of analytical narratives. Many of them mean “detailed, plausible stories” about how stuff occurs.

In light of the uncomfortable conclusion that more detailed, plausible stories about how stuff occurs does not actually yield more insight, Ward has adopted a decidedly contrarian stance.

I am here to suggest that less is more. Thus, let me be the first to call for less theory in security studies. We should winnow the many, many such “theories” that occupy the world of security studies.

Instead, we need more predictions.

He went on to detail his argument.

We need these predictions for four reasons. First, we need these predictions to help us make relevant statements about the world around us. We also need these predictions to help us throw out the bad “theories” that continue to flourish. These predictions will help drive our research into new areas, away from moribund approaches that have been followed for many decades. Finally, and perhaps most important, predictions will force us to keep on track.

But making predictions is only part of the process. Tracking them and accounting for their accuracy is the vital corollary to improving both accuracy and theory. As Ward pointed out, “One reason that many hate predictions is that talking heads make many predictions in the media, but few of them ever keep track of how well they are doing.” Most, in fact, are wrong; few are held accountable for it.

Of course, the use of empirical methods to predict the outcomes of future events animated much of Trevor N. Dupuy’s approach to historical analysis and is at the heart of what The Dupuy Institute carries on doing today. Both have made well-documented predictions that have also been remarkably accurate. More about those in the next post.

Greater Economic Backwardness and Revolution

An article in the History News Network got my attention

Greater economic backwardness

A few lines caught my attention:

  1. “For the first time the researchers found that the greater the development gap….the more likely a country has experienced non-violent and violent mass demonstrations for regime change…”
  2. “Events in the Arab Spring and in the Euro-Maidan demonstrations in the Ukraine, show that the frustrated desire to catch up with the frontier era can extend to the political sphere, particularly with repressive regimes.”

Well, this is probably very interesting work and I probably need to scare up a copy. The “for the first time” claim caught my attention in light of the work by Ted Gurr and Feierabend & Feierabend in the 1960s, which I am familiar with. I have posted on their work before. Of course, what Gurr and the Feierabends’ work showed was that (and this is paraphrasing from my memory):

  1. Poorer countries had more political violence that richer countries.
  2. Really poor countries had less political violence than developing countries (poor countries that are getting richer).
  3. Political violence went up when the economy went down.

The sense I have from the Gurr and Feierabend’s work is that the least stable countries are those that were developing economically and then stalled or went into recession. This, of course, is the scenario with Russia (and others like Venezuela) and possibly may become the scenario in China.


Are They Channeling Trevor Dupuy?

TrevorCoverShot

Continuing the RAND description of their hex boardgame:

Ground unit combat strengths were based on a systematic scoring of individual weapons, from tanks and artillery down to light machine guns, which were then aggregated according to the tables of organization and equipment for the various classes of NATO and Russian units. Overall unit scores were adjusted to account for differences in training, sustainment, and other factors not otherwise captured. Air unit combat strengths were derived from the results of offline engagement, mission, and campaign-level modeling.

This looks like some kind of firepower or combat power score, or perhaps Trevor Dupuy’s OLIs (Operational Lethality Indexes). As they say “systematic scoring” one wonders what system they used. Know of only one scoring system that is systematic (meaning the OLIs, which are based upon formulae). The subject is probably best summarized in Dr. James Taylor’s article on “Consistent Scoring of Weapons and Aggregation of Forces:” http://www.dupuyinstitute.org/pdf/v2n2.pdf. This is the same James Taylor who wrote the definitive two-volume work on Lanchester equations.

I do note with interest the adjustment for “differences in training, sustainment, and other factors.” That is always good to see.

Also noted:

Full documentation of the gaming platform will be forthcoming in a subsequent report.

Look forward to reading it.

Lanchester equations have been weighed….

a-knights-tale_1

There have been a number of tests of Lanchester equations to historical data over the years. Versions of Lanchester equations were implemented in various ground combat models in the late 1960s and early 1970s without any rigorous testing. As John Stockfish of RAND stated in 1975 in his report: Models, Data, and War: A Critique of the Study of Conventional Forces:

However Lanchester is presently esteemed for his ‘combat model,’ and specifically his ‘N-square law’ of combat, which is nothing more than a mathematical formulation of the age-old military principal of force concentration. That there is no clear empirical verification of this law, or that Lanchester’s model or present versions of it may in fact be incapable of verification, have not detracted from this source of his luster.”

Since John Stockfish’s report in 1975 the tests of Lanchester have included:

(1) Janice B. Fain, “The Lanchester Equations and Historical Warfare: An Analysis of Sixty World War II Land Engagements.” Combat Data Subscription Service (HERO, Arlington, VA, Spring 1977);

(2) D. S. Hartley and R. L. Helmbold, “Validating Lanchester’s Square Law and Other Attrition Models,” in Warfare Modeling, J. Bracken, M. Kress, and R. E. Rosenthal, ed., (New York: John Wiley & Sons, 1995) and originally published in 1993;

(3) Jerome Bracken, “Lanchester Models of the Ardennes Campaign in Warfare Modeling (John Wiley & sons, Danvers, MA, 1995);

(4) R. D. Fricker, “Attrition Models of the Ardennes Campaign,” Naval Research Logistics, vol. 45, no. 1, January 1997;

(5) S. C. Clemens, “The Application of Lanchester Models to the Battle of Kursk” (unpublished manuscript, May 1997);

(6) 1LT Turker Turkes, Turkish Army, “Fitting Lanchester and Other Equations to the Battle of Kursk Data,” Dissertation for MS in Operations Research, March 2000;

(7) Captain John Dinges, U.S. Army, “Exploring the Validation of Lanchester Equations for the Battle of Kursk,” MS in Operations Research, June 2001;

(8) Tom Lucas and Turker Turkes, “Fitting Lanchester Equations to the Battles of Kursk and Ardennes,” Naval Research Logistics, 51, February 2004, pp. 95-116;

(9) Thomas W. Lucas and John A. Dinges, “The Effect of Battle Circumstances on Fitting Lanchester Equations to the Battle of Kursk,” forthcoming in Military Operations Research.

In all cases, it was from different data sets developed by us, with eight of the tests conducted completely independently of us and without our knowledge.

In all cases, they could not establish a Lanchester square law and really could not establish the Lanchester linear law. That is nine separate and independent tests in a row with basically no result. Furthermore, there has never been a test to historical data (meaning real-world combat data) that establishes Lanchester does apply to ground combat. This is added to the fact that Lanchester himself did not think it should. It does not get any clearer than that.

As Morse & Kimball stated in 1951 in Methods of Operations Research

Occasionally, however, it is useful to insert these constants into differential equations, to see what would happen in the long run if conditions were to remain the same, as far as the constants go. These differential equations, in order to be soluble, will have to represent extremely simplified forms of warfare; and therefore their range of applicability will be small.

And later they state:

Indeed an important problem in operations research for any type of warfare is the investigation, both theoretical and statistical, as to how nearly Lanchester’s laws apply.

I think this has now been done for land warfare, at last. Therefore, I conclude: Lanchester equations have been weighed, they have been measured, and they have been found wanting.

Really…..Lanchester?

RAND described the combat system from their hex boardgame as such:

The general game design was similar to that of traditional board wargames, with a hex grid governing movement superimposed on a map. Tactical Pilotage Charts (1:500,000 scale) were used, overlaid with 10-km hexes, as seen in Figure A.1. Land forces were represented at the battalion level and air units as squadrons; movement and combat were governed and adjudicated using rules and combat-result tables that incorporated both traditional gaming principles (e.g., Lanchester exchange rates) and the results of offline modeling….”

Now this catches my attention. Switching from a “series of tubes” to a hexagon boardgame brings back memories, but it is understandable. On the other hand, it is pretty widely known that no one has been able to make Lanchester equations work when tested to historical ground combat. There have been multiple efforts conducted to test this, mostly using the Ardennes and Kursk databases that we developed. In particular, Jerome Braken published his results in Modeling Warfare and Dr. Thomas Lucas out at Naval Post-Graduate School has conducted multiple tests to try to do the same thing. They all point to the same conclusion, which is that Lanchester equations do not really work for ground combat. They might work for air, but it is hard to tell from the RAND write-up whether they restricted the use of “Lanchester exchange rates” to only air combat. I could make the point by referencing many of these studies but this would be a long post. The issue is briefly discussed in Chapter Eighteen of my upcoming book War by Numbers and is discussed in depth in the TDI report “Casualty Estimation Methodologies Study.” Instead I will leave it to Frederick Lanchester himself, writing in 1914, to summarize the problem:

We have already seen that the N-square law applies broadly, if imperfectly, to military operations. On land, however, there sometimes exist special conditions and a multitude of factors extraneous to the hypothesis, whereby its operations may be suspended or masked.