Tag quantitative analysis

Trevor Dupuy’s Combat Advance Rate Verities

t-34_76_4One of the basic processes of combat is movement. According to Trevor Dupuy, one of the most important outcomes of ground combat is advance against opposition. He spent a good amount of time examining historical advance rates, seeking to determine if technological change had led to increases in advance rates over time. On the face of it, he determined that daily rates had increased by about one-half, from about 17 kilometers per day during the Napoleonic Era, to about 26 kilometers a day by the 1973 Arab-Israeli War. However, when calculated by the duration of a campaign, average daily advance rates did not appear to have changed much at all over 200 years, despite the advent of mechanization.

His research on the topic yielded another list of verities. He did not believe they accounted for every factor or influence on advance rates, but he did think they accounted for most of them. He was also reasonably confident that no weapons or means of conveyance then foreseen would alter the basic relationships in his list.[1]

  1. Advance against opposition requires local combat power preponderance.
  2. There is no direct relationship between advance rates and force strength ratios.
  3. Under comparable conditions, small forces advance faster than larger forces.
  4. Advance rates vary inversely with the strength of the defender’s fortifications.
  5. Advance rates are greater for a force that achieves surprise.
  6. Advance rates decline daily in sustained operations.
  7. Superior relative combat effectiveness increases an attacker’s advance rate.
  8. An “all-out” effort increases advance rates at a cost in higher casualties.
  9. Advance rates are reduced by difficult terrain.
  10. Advance rates are reduced by rivers and canals.
  11. Advance rates vary positively with the quality and density of roads.
  12. Advance rates are reduced by bad weather.
  13. Advance rates are lower at night than in daytime.
  14. Advance rates are reduced by inadequate supply.
  15. Advance rates reflect interactions with friendly and enemy missions.

NOTES

[1] Trevor N. Dupuy, Understanding War: History and Theory of Combat (New York: Paragon House, 1987), pp. 158–163.

Trevor Dupuy and the 3-1 Rule

rulesDr. Reina Pennington, a professor of history at Norwich University, recently published an analysis of the Eastern Front during World War II which made the case that the Soviet superiority in manpower over Germany was not as large as is often claimed. In support of her argument, Pennington provided a table comparing the total number of Soviet and German combat forces and force ratios at different times during the conflict. She pointed out that for much of the war, Soviet forces were either outnumbered, or achieved modest numerical superiorities that did not exceed 3 to 1 until late in 1944. “A 2:1 advantage is significant,” Pennington argued, “but falls short of the 3:1 force ratio that is generally regarded as necessary for attacking forces, and it’s a long way from the double-digit advantage that is often claimed.”

To support her assertion of the relevance of the 3-1 force ratio, Pennington linked to an article by Trevor N. Dupuy, “Combat Data and the 3:1 Rule,” published in the summer 1989 edition of International Security. The problem with citing Dupuy is that his assessment of the 3-1 rule contradicts her assertion of it.

Dupuy criticized the 3-1 rule on empirical grounds. The so-called “3-1 rule” is a military aphorism that holds that attacking forces require a 3 to 1 advantage over defending forces in order to succeed. Although this rule has become widely-known and widely-held, especially in Western militaries, its origin is unknown and unattributed. It is not exactly clear to what exactly it refers, and there is no known original statement of the rule that can be consulted for clarification.

Dupuy questioned the ambiguity of the rule, which in turn undermined its relevance.

[W]hat is the force ratio to be used with the 3:1 force ratio planning factor? Is it numbers of men, or weapons? Is it firepower? Is it some other calculation of a combat power ratio? In any event, it is clear that neither numbers nor firepower tells us much unless we know the circumstances under which these numbers face each other and the manner in which the firepower is applied.[1]

In 1984, Dupuy’s Historical Evaluation Research Organization (HERO) compiled a database of battles from 1600 to 1973 for the U.S. Army Concepts Analysis Agency (CAA; now known as the U.S. Army Center for Army Analysis). CAA’s examination of the numerical force ratios in the database showed that attackers with advantages of 3-1 or more in manpower succeeded 74% of the time. It also showed that attackers won between 58% and 63% of the time when attacking with between a 1.5-1 numerical disadvantage and less than a 3-1 advantage. Attackers also managed to obtain a manpower advantage of 3-1 or greater in just 106 of 598 cases (17.7%) examined.[2]

CAA, Battle Outcome vs. Force Ratio

Dupuy concurred that a 3-1 ratio based on a simple numerical total of troop numbers had limited use as a general rule-of-thumb guide for military planning, but asserted that it was useless for analytical purposes Simply put, while there are many historical cases where an attacking force with a 3-1 numerical advantage succeeded, there are also many cases where attackers won with less than a 3-1 advantage, and even with a numerical inferiority. On the Eastern Front during World War II, for example, the German Army regularly conducted successful attacks against numerically superior Soviet forces.

Dupuy was so certain of the validity of the data on this that he made it an aphorism of his own: In the average modem battle, the attacker’s numerical strength is about double the defender’s.

This is because the attacker has the initiative and can initiate combat at a time and place of his choosing and in the manner of his choosing. The attacker can mass his forces at critical points on the battlefield to gain the advantage in strength which he believes necessary to assure the success of the attack.

A battle usually does not take place unless each side believes it has some chance for success. Otherwise, the attacker would avoid taking the initiative. The defender, if he could not avoid battle by withdrawal, would make every possible effort to reinforce the prospective battle area sufficiently to have a chance for successful defense. One circumstance in which a battle occurs without the tacit agreement or acceptance of the defender, is when the attacker achieves surprise. Alternatively, surprise by a defender (for instance, by ambush) may result in a battle taking place before the prospective attacker is ready.

Most military men are aware of the rule of thumb that an attacker can count on success if he has a three-to-one numerical superiority, while a defender can expect success if his inferiority is not less than one-to-two. But the side achieving surprise can count on the effects of surprise multiplying its force strength by a factor ranging between 1.5 and 2.5 (or even more in some cases). Thus, an attacker expecting to achieve surprise would be willing to attack with less than a three-to-one superiority.

Another factor which can influence an attacker to seek battle with less than a three-to-one superiority is confidence in the superior quality of his troops. This accounts for many instances in which the Germans attacked in World War II with less than the desirable numerical superiority, and for the similar instances of Israeli attacks in the Arab-Israeli wars without great numerical superiority.[3]

Dr. Pennington is on fairly firm ground in rejecting the idea that numerical superiority was the sole reason the Red Army defeated the German Army in World War II, but numbers did play an extremely important role in the Soviet success. The lack of a 3-1 manpower advantage did not preclude the Soviets from battlefield success; 2-1 was sufficient. By the time the Soviets achieved a 3-1 advantage, success was well in hand and the end in sight.

NOTES

[1] Trevor N. Dupuy. Numbers, Predictions and War: Using History to Evaluate Combat Factors and Predict the Outcome of Battles. Indianapolis; New York: The Bobbs-Merrill Co., 1979, p. 13

[2] Joshua M. Epstein, “Dynamic Analysis and the Conventional Balance in Europe,” International Security, Spring 1988, p. 156; Robert Helmbold and Aqeel A. Khan. “Combat History Analysis Study Effort (CHASE): Progress Report for the Period August 1984-June 1985,” Bethesda, MD: U.S. Army Concepts Analysis Agency, August 1986

[3] Trevor N. Dupuy. Attrition: Forecasting Battle Casualties and Equipment Losses in Modern War. Falls Church (VA): Nova Publications, 1995, pp. 98-99

Trevor N. Dupuy’s Combat Attrition Verities

Operating room setup, 3d Surgical Hospital (Mobile Army), Fort George G. Meade, MD. Office of Medical History, U.S. Army Medical Department
Office of Medical History, U.S. Army Medical Department

Trevor N. Dupuy developed some hypotheses about casualty rates in combat in the process of quantifying the effects of surprise and relative combat effectiveness.[1] After testing these hypotheses against historical combat data, Col. Dupuy believed them valid enough to be considered verities. His confidence in them ranged from absolute for most to reasonable certainty for a few. The first two points are statements of combat experience, but they are directly relevant to the nature of battle attrition. As with his verities of combat, these will be discussed in more detail in subsequent posts.

Personnel Attrition Verities

  1. In the average battle, the attack’s numerical strength is about double the defender’s.
  2. In the average modern battle the attacker is more often successful than the defender.
  3. Casualty rates of winners are lower than those of losers.
  4. Small forces casualty rates are higher than those of large forces.
  5. More effective forces inflict casualties at a higher rate than less effective opponents.
  6. There is no direct relationship between force ratios and casualty rates.
  7. In most modern battles, the numerical losses of attacker and defender are often similar.
  8. Casualty rates for defenders vary inversely with strength of fortifications.
  9. Casualty rates of a surprising force are lower than those of a surprised force.
  10. In the average modern battle, attacker casualty rates are somewhat lower than defender casualty rates.
  11. In bad weather, casualty rates for both sides decline markedly.
  12. In difficult terrain, casualty rates for both sides decline markedly.
  13. The casualty-inflicting capability of a force declines after each successive day in combat.
  14. Casualty rates are lower at night than in daytime.
  15. Casualty rates are higher in summer than in winter.
  16. The faster the front line moves, the lower the casualty rates for both sides.
  17. Casualty rates seem to decline during river crossings.
  18. An “all-out” effort by one side raises loss rates for both sides.
  19. A force with greater overall combat power inflicts casualties at a greater rate than the opponent.
  20. The killed-to-wounded distribution of personnel casualties in twentieth century warfare is consistent.
  21. Average World War II division engagement casualty rates in Western Europe were 1% to 3% per day.
  22. Attrition rates in the 1973 October War were comparable to World War II.
  23. Casualty rates for major power forces in minor hostilities after 1945 are about half those experienced in World War II.

Material Attrition Verities

  1. Material loss rates are related to personnel casualty rates.
  2. Tank loss rates are five to seven times higher than personnel casualty rates.
  3. Attacker tank loss rates are generally higher than defender tank loss rates.
  4. Artillery material loss rates are generally about one-tenth personnel casualty rates.
  5. Self-propelled artillery loss rates are two-to-three times greater than for towed guns.
  6. The loss rates of light, to medium, to heavy artillery weapons are in the proportion: 2.2/1.8/1.0.

NOTES

[1] Trevor N. Dupuy, Attrition: Forecasting Battle Casualties and Equipment Losses in Modern War (Falls Church, VA: NOVA Publications, 1995), pp. 98-103. A slightly different version of this list was originally published in Trevor N. Dupuy, Understanding War: History and Theory of Combat (New York: Paragon House, 1987), pp. 174–180.

Forecasting U.S. Casualties in Bosnia

Photo by Ssgt. Lisa Zunzanyika-Carpenter 1st Combat Camera Charleston AFB SC

In previous posts, I highlighted a call for more prediction and accountability in the field of security studies, and detailed Trevor N. Dupuy’s forecasts for the 1990-1991 Gulf War. Today, I will look at The Dupuy Institute’s 1995 estimate of potential casualties in Operation JOINT ENDEAVOR, the U.S. contribution to the North Atlantic Treaty Organization (NATO) peacekeeping effort in Bosnia and Herzegovina.

On 1 November 1995, the leaders of the Serbia, Croatia, and Bosnia, rump states left from the breakup of Yugoslavia, along with representatives from the United States, European Union, and Russia, convened in Dayton, Ohio to negotiate an end to a three-year civil war. The conference resulted from Operation DELIBERATE FORCE, a 21-day air campaign conducted by NATO in August and September against Bosnian Serb forces in Bosnia.

A key component of the negotiation involved deployment of a NATO-led Implementation Force (IFOR) to replace United Nations troops charged with keeping the peace between the warring factions. U.S. European Command (USEUCOM) and NATO had been evaluating potential military involvement in the former Yugoslavia since 1992, and U.S. Army planners started operational planning for a ground mission in Bosnia in August 1995. The Joint Chiefs of Staff alerted USEUCOM for a possible deployment to Bosnia on 2 November.[1]

Up to that point, U.S. President Bill Clinton had been reluctant to commit U.S. ground forces to the conflict and had not yet agreed to do so as part of the Dayton negotiations. As part of the planning process, Joint Staff planners contacted the Deputy Undersecretary of the Army for Operations Research for assistance in developing an estimate of potential U.S. casualties in a peacekeeping operation. The planners were told that no methodology existed for forecasting losses in such non-combat contingency operations.[2]

On the same day the Dayton negotiation began, the Joint Chiefs contracted The Dupuy Institute to use its historical expertise on combat casualties to produce an estimate within three weeks for likely losses in a commitment of 20,000 U.S. troops to a 12-month peacekeeping mission in Bosnia. Under the overall direction of Nicholas Krawciw (Major General, USA, ret.), then President of The Dupuy Institute, a two-track analytical effort began.

One line of effort analyzed the different phases of the mission and compiled list of potential lethal threats for each, including non-hostile accidents. Losses were forecasted using The Dupuy Institute’s combat model, the Tactical Numerical Deterministic Model (TNDM), and estimates of lethality and frequency for specific events. This analysis yielded a probabilistic range for possible casualties.

The second line of inquiry looked at data on 144 historical cases of counterinsurgency and peacekeeping operations compiled for a 1985 study by The Dupuy Institute’s predecessor, the Historical Evaluation and Research Organization (HERO), and other sources. Analysis of 90 of these cases, including all 38 United Nations peacekeeping operation to that date, yielded sufficient data to establish baseline estimates for casualties related to force size and duration.

Coincidentally and fortuitously, both lines of effort produced estimates that overlapped, reinforcing confidence in their validity. The Dupuy Institute delivered its forecast to the Joint Chiefs of Staff within two weeks. It estimated possible U.S. casualties for two scenarios, one a minimal deployment intended to limit risk, and the other for an extended year-long mission.

For the first scenario, The Dupuy Institute estimated 11 to 29 likely U.S. fatalities with a pessimistic potential for 17 to 42 fatalities. There was also the real possibility for a high-casualty event, such as a transport plane crash. For the 12-month deployment, The Dupuy Institute forecasted a 50% chance that U.S. killed from all causes would be below 17 (12 combat deaths and 5 non-combat fatalities) and a 90% chance that total U.S. fatalities would be below 25.

Chairman of the Joint Chiefs of Staff General John Shalikashvili carried The Dupuy Institute’s casualty estimate with him during the meeting in which President Clinton decided to commit U.S. forces to the peacekeeping mission. The participants at Dayton reached agreement on 17 November and an accord was signed on 14 December. Operation JOINT ENDEAVOR began on 2 December with 20,000 U.S. and 60,000 NATO troops moving into Bosnia to keep the peace. NATO’s commitment in Bosnia lasted until 2004 when European Union forces assumed responsibility for the mission.

There were six U.S. casualties from all causes and no combat deaths during JOINT ENDEAVOR.

NOTES

[1] Details of U.S. military involvement in Bosnia peacekeeping can be found in Robert F. Baumann, George W. Gawrych, Walter E. Kretchik, Armed Peacekeepers in Bosnia (Combat Fort Leavenworth, KS: Studies Institute Press, 2004); R. Cody Phillips, Bosnia-Herzegovina: The U.S. Army’s Role in Peace Enforcement Operations, 1995-2004 (Washington, D.C.: U.S. Army Center for Military History, 2005); Harold E. Raugh,. Jr., ed., Operation JOINT ENDEAVOR: V Corps in Bosnia-Herzogovina, 1995-1996: An Oral History (Fort Leavenworth, KS. : Combat Studies Institute Press, 2010).

[2] The Dupuy Instiute’s Bosnia casualty estimate is detailed in Christopher A. Lawrence, America’s Modern Wars: Understanding Iraq, Afghanistan and Vietnam (Philadelphia, PA: Casemate, 2015); and Christopher A. Lawrence, “How Military Historians Are Using Quantitative Analysis — And You Can Too,” History News Network, 15 March 2015.

Estimating Combat Casualties II

Just a few comments on this article:

  1. One notes the claim of 30,000 killed for the 1991 Gulf War. This was typical of some of the discussion at the time. As we know, the real figure was much, much lower.
  2. Note that Jack Anderson is quoting some “3-to-1 Rule.” We are not big fans of “3-to-1 Rules.” Trevor Dupuy does briefly refute it.
  3. Trevor Dupuy does end the discussion by mentioning “combat power ratios.” This is not quite the same as “force ratios.”

Anyhow, interesting blast from the past, although some of this discussion we were also conducting a little over a week ago at a presentation we provided.


Estimating Combat Casualties I

Shawn Woodford was recently browsing in a used bookstore in Annapolis. He came across a copy of Genius for War. Tucked in the front cover was this clipping from the Washington Post. It is undated, but makes reference to a Jack Anderson article from 1 November, presumably 1990. So it must have been published sometime shortly thereafter.

19901100EstimatingCombatCasualties


The Timeless Verities of Combat

Understanding WarJames Jay Carafano, historian and Vice President for Foreign and Defense Policy at the Heritage Foundation, recently issued a call for the U.S. defense community to back off debates over “the latest doctrinal flavor of the month” and return to a focus on the classic principles of war. “Most modern military doctrine should be scrapped,” Carafano wrote. “The Pentagon would be far better served if our military thinkers got back to the basics and taught the principles of war—and little more.”

The principles of war are a list of basic concepts of warfare distilled from the writings of mostly Western military leaders and theorists that had become commonly accepted by the late 18th century, more or less. They vary in number depending on who’s list is consulted, but U.S. Army doctrine currently recognizes nine: Objective, Offensive, Mass, Economy of Force, Maneuver, Unity of Command, Security, Surprise, and Simplicity.

In 1987, Trevor N. Dupuy published what he termed “the timeless verities of combat.” These were a list of thirteen “unchanging operational features or concepts” based upon his previous twenty-five years of empirical research into a fundamental aspect of warfare, the nature of combat. He did not intend for these verities to substitute for the principles of war, but did believe that they were related to them. Dupuy asserted that the verities “describe certain fundamental and important aspects of warfare, which, despite constant changes in the implements of war, are almost unchanging because of war’s human component.”[1]

Trevor N. Dupuy’s Timeless Verities of Combat

  1. Offensive action is essential to positive combat results.
  2. Defensive strength is greater than offensive strength.
  3. Defensive posture is necessary when successful offense is impossible.
  4. Flank and rear attack is more likely to succeed than frontal attack.
  5. Initiative permits application of preponderant combat power.
  6. Defender’s chances of success are directly proportional to fortification strength.
  7. An attacker willing to pay the price can always penetrate the strongest defenses.
  8. Successful defense requires depth and reserves.
  9. Superior Combat Power Always Wins.
  10. Surprise substantially enhances combat power.
  11. Firepower kills, disrupts, suppresses, and causes dispersion.
  12. Combat activities are always slower, less productive, and less efficient than anticipated.
  13. Combat is too complex to be described in a single, simple aphorism.

Each of these concepts will be explored further in future posts.

NOTES

[1] Trevor N. Dupuy, Understanding War: History and Theory of Combat (New York : Paragon House, 1987), pp. 1-8.

Assessing the 1990-1991 Gulf War Forecasts

WargamesA number of forecasts of potential U.S. casualties in a war to evict Iraqi forces from Kuwait appeared in the media in the autumn of 1990. The question of the human costs became a political issue for the administration of George H. W. Bush and influenced strategic and military decision-making.

Almost immediately following President Bush’s decision to commit U.S. forces to the Middle East in August 1990, speculation appeared in the media about what a war between Iraq and a U.S.-led international coalition might entail. In early September, U.S. News & World Report reported “that the U.S. Joint Chiefs of Staff and the National Security Council estimated that the United States would lose between 20,000 and 30,000 dead and wounded soldiers in a Gulf war.” The Bush administration declined official comment on these figures at the time, but the media indicated that they were derived from Defense Department computer models used to wargame possible conflict scenarios.[1] The numbers shocked the American public and became unofficial benchmarks in subsequent public discussion and debate.

A Defense Department wargame exploring U.S. options in Iraq had taken place on 25 August, the results of which allegedly led to “major changes” in military planning.[2] Although linking the wargame and the reported casualty estimate is circumstantial, the cited figures were very much in line with other contemporary U.S. military casualty estimates. A U.S. Army Personnel Command [PERSCOM] document that informed U.S. Central Command [USCENTCOM] troop replacement planning, likely based on pre-crisis plans for the defense of Saudi Arabia against possible Iraqi invasion, anticipated “about 40,000” total losses.[3]

These early estimates were very likely to have been based on a concept plan involving a frontal attack on Iraqi forces in Kuwait using a single U.S. Army corps and a U.S. Marine Expeditionary Force. In part due to concern about potential casualties from this course of action, the Bush administration approved USCENTCOM commander General Norman Schwarzkopf’s preferred concept for a flanking offensive using two U.S. Army corps and additional Marine forces.[4] Despite major reinforcements and a more imaginative battle plan, USCENTCOM medical personnel reportedly briefed Defense Secretary Dick Cheney and Joint Chiefs Chairman Colin Powell in December 1990 that they were anticipating 20,000 casualties, including 7,000 killed in action.[5] Even as late as mid-February 1991, PERSCOM was forecasting 20,000 U.S. casualties in the first five days of combat.[6]

The reported U.S. government casualty estimates prompted various public analysts to offer their own public forecasts. One anonymous “retired general” was quoted as saying “Everyone wants to have the number…Everyone wants to be able to say ‘he’s right or he’s wrong, or this is the way it will go, or this is the way it won’t go, or better yet, the senator or the higher-ranking official is wrong because so-and-so says that the number is this and such.’”[7]

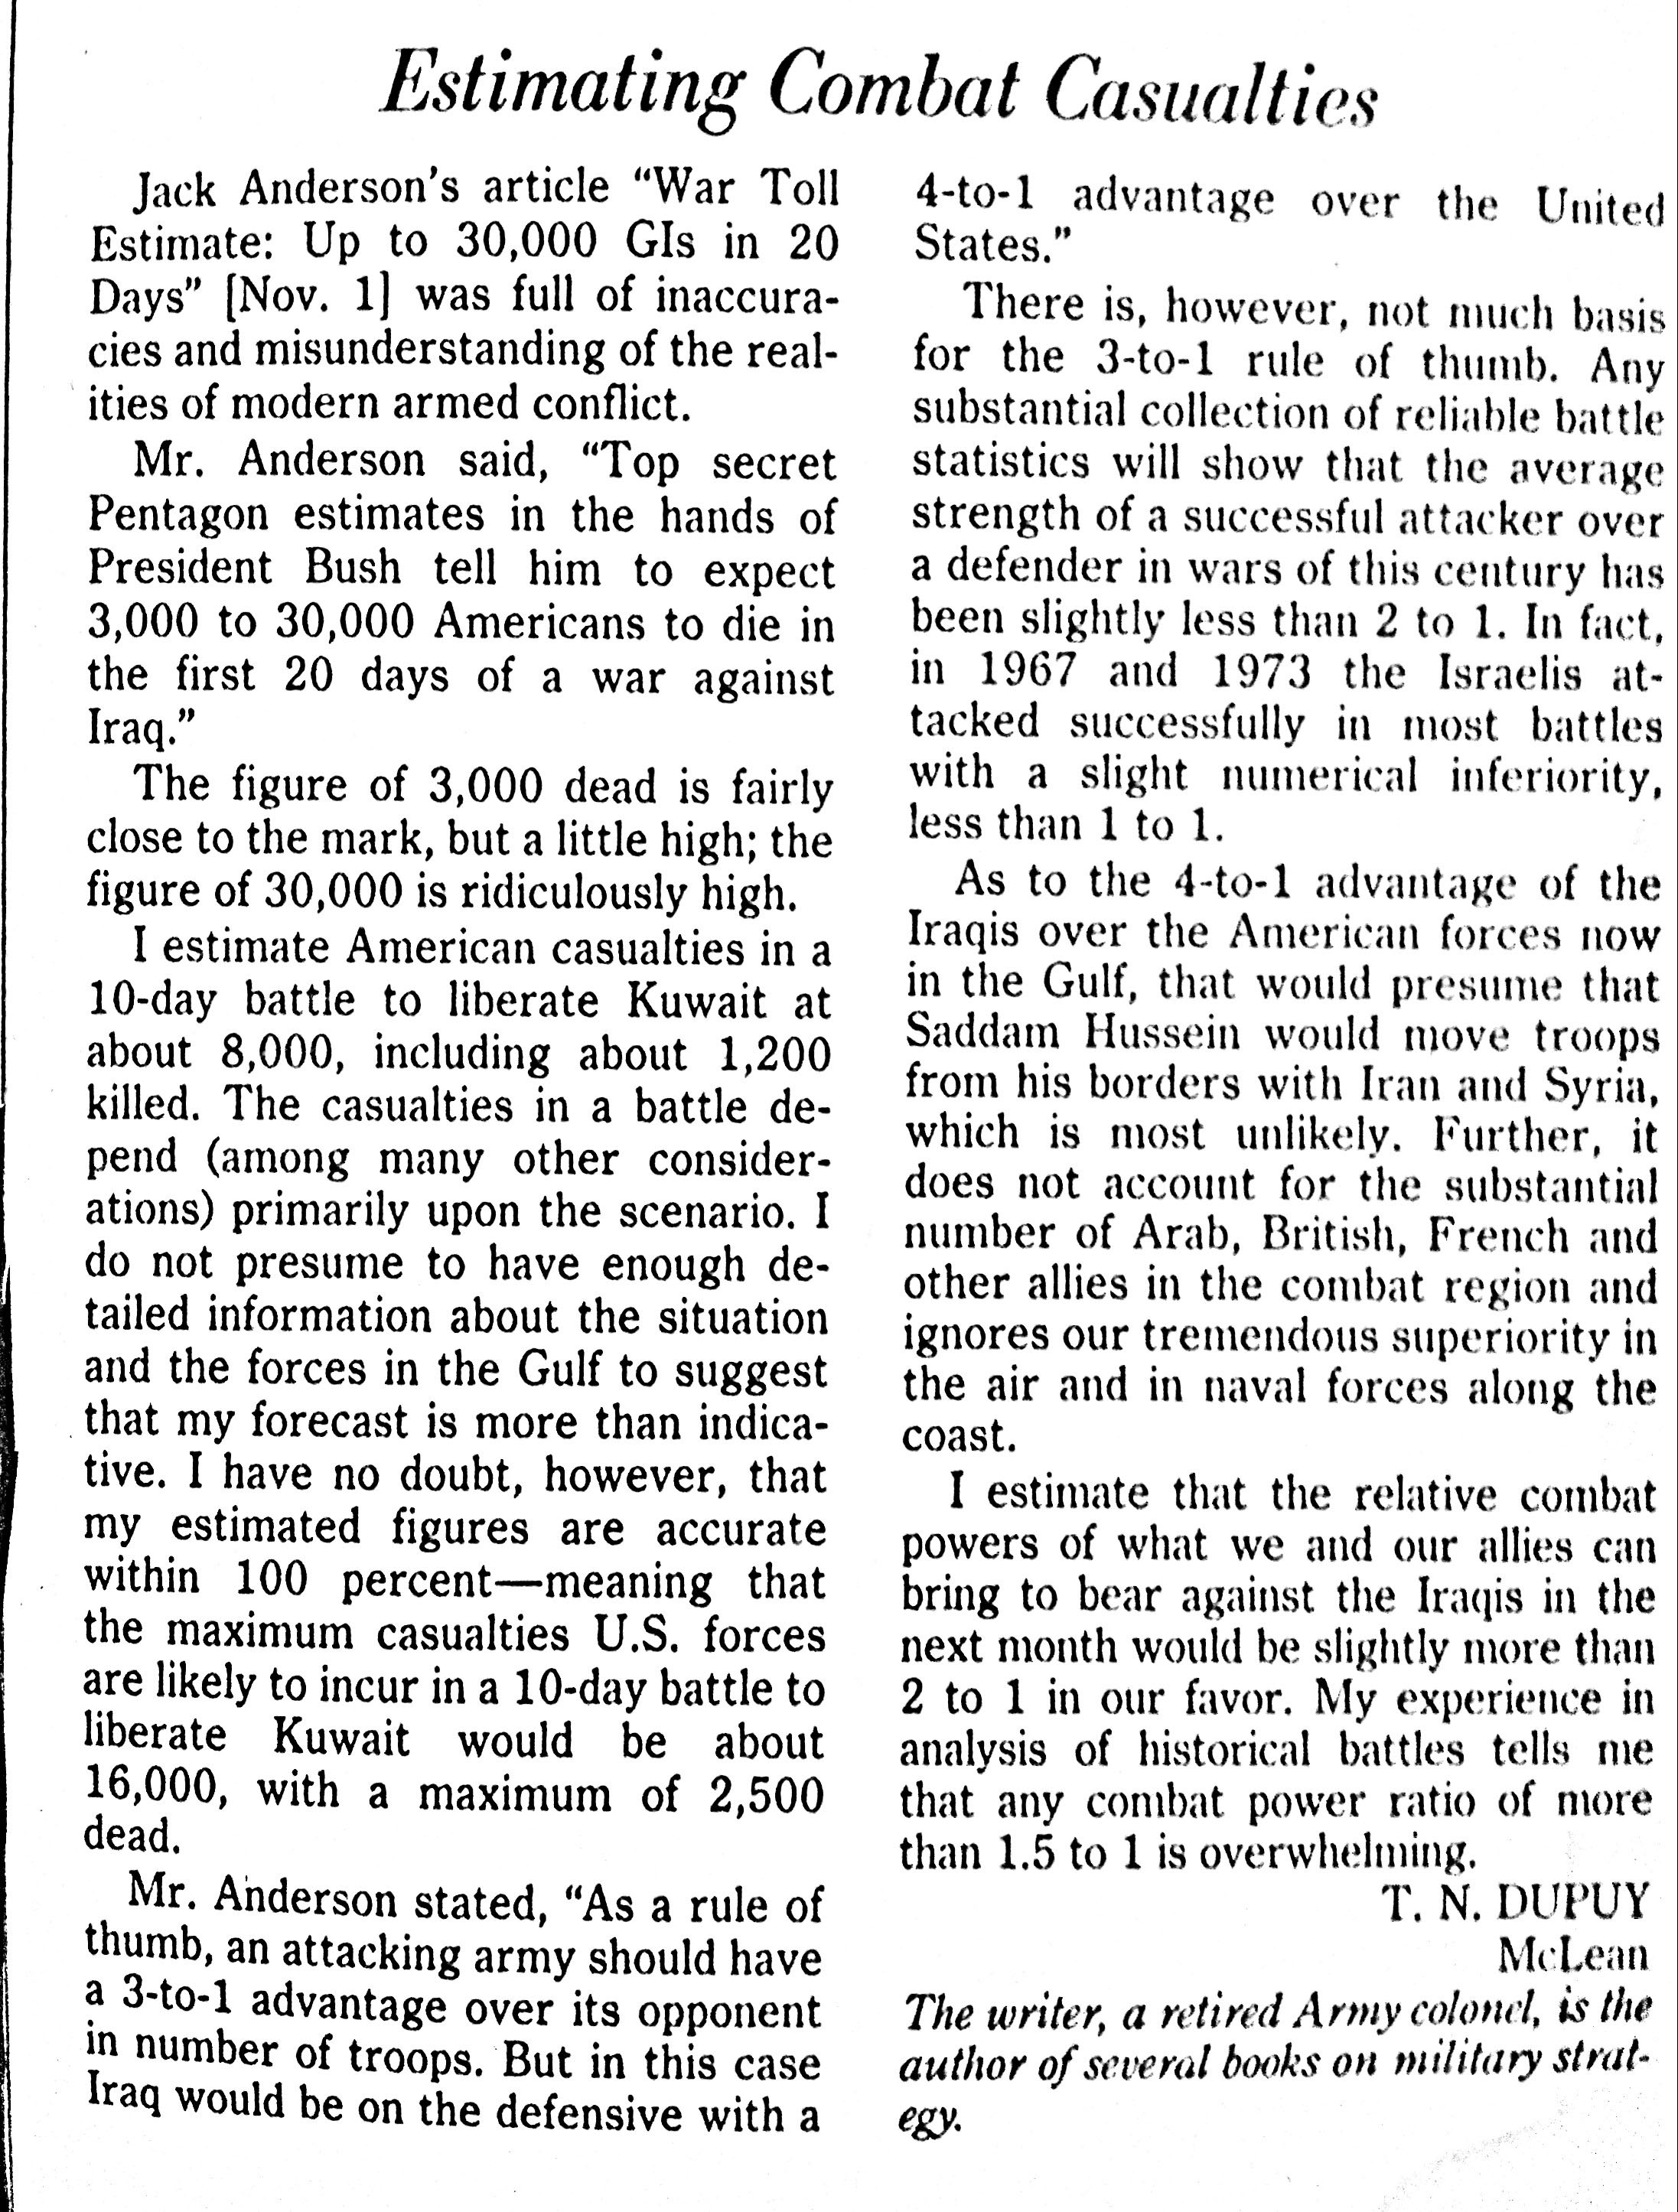
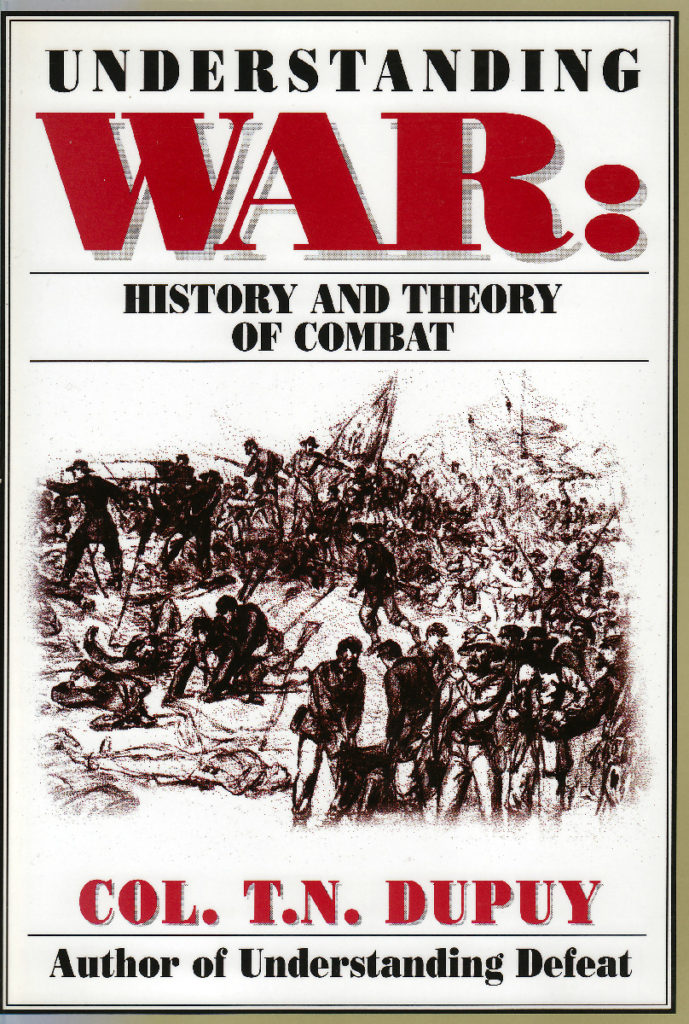
Trevor Dupuy’s forecast was among the first to be cited by the media[8], and he presented it before a hearing of the Senate Armed Services Committee in December.

Other prominent public estimates were offered by political scientists Barry Posen and John J. Mearshimer, and military analyst Joshua Epstein. In November, Posen projected that the Coalition would initiate an air offensive that would quickly gain air superiority, followed by a frontal ground attack lasting approximately 20 days incurring 4,000 (with 1,000 dead) to 10,000 (worst case) casualties. He used the historical casualty rates experienced by Allied forces in Normandy in 1944 and the Israelis in 1967 and 1973 as a rough baseline for his prediction.[9]

Epstein’s prediction in December was similar to Posen’s. Coalition forces would begin with a campaign to obtain control of the air, followed by a ground attack that would succeed within 15-21 days, incurring between 3,000 and 16,000 U.S. casualties, with 1,049-4,136 killed. Like Dupuy, Epstein derived his forecast from a combat model, the Adaptive Dynamic Model.[10]

On the eve of the beginning of the air campaign in January 1991, Mearshimer estimated that Coalition forces would defeat the Iraqis in a week or less and that U.S. forces would suffer fewer than 1,000 killed in combat. Mearshimer’s forecast was based on a qualitative analysis of Coalition and Iraqi forces as opposed to a quantitative one. Although like everyone else he failed to foresee the extended air campaign and believed that successful air/land breakthrough battles in the heart of the Iraqi defenses would minimize casualties, he did fairly evaluate the disparity in quality between Coalition and Iraqi combat forces.[11]

In the aftermath of the rapid defeat of Iraqi forces in Kuwait, the media duly noted the singular accuracy of Mearshimer’s prediction.[12] The relatively disappointing performance of the quantitative models, especially the ones used by the Defense Department, punctuated debates within the U.S. military operations research community over the state of combat modeling. Dubbed “the base of sand problem” by RAND analysts Paul Davis and Donald Blumenthal, serious questions were raised about the accuracy and validity of the methodologies and constructs that underpinned the models.[13] Twenty-five years later, many of these questions remain unaddressed. Some of these will be explored in future posts.

NOTES

[1] “Potential War Casualties Put at 100,000; Gulf crisis: Fewer U.S. troops would be killed or wounded than Iraq soldiers, military experts predict,” Reuters, 5 September 1990; Benjamin Weiser, “Computer Simulations Attempting to Predict the Price of Victory,” Washington Post, 20 January 1991

[2] Brian Shellum, A Chronology of Defense Intelligence in the Gulf War: A Research Aid for Analysts (Washington, D.C.: DIA History Office, 1997), p. 20

[3] John Brinkerhoff and Theodore Silva, The United States Army Reserve in Operation Desert Storm: Personnel Services Support (Alexandria, VA: ANDRULIS Research Corporation, 1995), p. 9, cited in Brian L. Hollandsworth, “Personnel Replacement Operations during Operations Desert Storm and Desert Shield” Master’s Thesis (Ft. Leavenworth, KS: U.S. Army Command and General Staff College, 2015), p. 15

[4] Richard M. Swain, “Lucky War”: Third Army in Desert Storm (Ft. Leavenworth, KS: U.S. Army Command and General Staff College Press, 1994)

[5] Bob Woodward, The Commanders (New York: Simon and Schuster, 1991)

[6] Swain, “Lucky War”, p. 205

[7] Weiser, “Computer Simulations Attempting to Predict the Price of Victory”

[8] “Potential War Casualties Put at 100,000,” Reuters

[9] Barry R. Posen, “Political Objectives and Military Options in the Persian Gulf,” Defense and Arms Control Studies Working Paper, Cambridge, MA: Massachusetts Institute of Technology, November 1990)

[10] Joshua M. Epstein, “War with Iraq: What Price Victory?” Briefing Paper, Brookings Institution, December 1990, cited in Michael O’Hanlon, “Estimating Casualties in a War to Overthrow Saddam,” Orbis, Winter 2003; Weiser, “Computer Simulations Attempting to Predict the Price of Victory”

[11] John. J. Mearshimer, “A War the U.S. Can Win—Decisively,” Chicago Tribune, 15 January 1991

[12] Mike Royko, “Most Experts Really Blew It This Time,” Chicago Tribune, 28 February 1991

[13] Paul K. Davis and Donald Blumenthal, “The Base of Sand Problem: A White Paper on the State of Military Combat Modeling” (Santa Monica, CA: RAND, 1991)

Human Factors in Warfare: Quantifying Morale

Radio broadcast, 1943. Copyprint. Bob Hope Collection, Motion Picture, Broadcasting and Recorded Sound Division, Library of Congress (150)

My colleague Chris Lawrence has taken me to task with regard to my last post on the topic of morale. I asserted that Trevor Dupuy’s claim that human factors influenced the outcome of combat was controversial. Chris pointed out that it was, in fact, Col Dupuy’s claims that 1) human factors in combat could be measured and quantified; and 2) that quantified human factors should be incorporated into combat models, that were really the sources of controversy.

Chris is indisputably correct about that. In my defense, I chose the wording I used in my post deliberately to weasel around an apparently problematic contradiction. While Col Dupuy did indeed believe that human factors in combat could be quantified, he was dubious about the prospect of individually quantifying some of those specific factors, including morale. Since my post was primarily about Dr. Fennell’s work on morale, I side-stepped that issue. Well, today I am going to wade on in.

Col Dupuy first addressed the quantification of human factors in combat in his book Numbers, Predictions & War, published in 1979. His original combat model, the Quantified Judgment Model (QJM), incorporated 73 different variable elements and parameters, including 11 he defined as intangible. By intangible, he meant variables “which are – at least for the present – impossible to quantify with confidence, either because they are essentially qualitative in nature, or because for some other reason they currently defy precise delineation or measurement.”[1] He also believed that “some (such as logistics) may lend themselves to assessment indirectly through the measurement of their effects.”[2]

He divided those intangible variables into three categories[3]:

Sometimes calculable

Probably calculable; not yet calculated

Intangible; probably individually incalculable

  • Combat effectiveness
  • Logistics
  • Leadership
  • Training/experience
  • Initiative
  • Morale
  • Time
  • Space
  • Momentum
  • Intelligence
  • Technology

With regard to leadership, training, and morale, Col Dupuy asserted that

These subjective qualities are almost impossible to assess in absolute terms with complete objectivity. However, the relative capabilities of the opposing leaders in terms of skill, nerve, and determination can probably have more influence on the outcome of a battle than any of the other qualitative variables of combat— if there is a substantial difference in the qualities of leadership of the opposing sides. The same is true, probably to a somewhat lesser extent, if there are substantial differences in the state of training or of combat experience of the two sides, and if there are great differences in their respective states of morale. Accordingly, where solid historical information warrants, these three variables can be given mathematical weights, either individually, or in relationship with the other elements of combat effectiveness, on the basis of professional military judgment, but (under the present “state of the art”) this weighting process is bound to be highly subjective.[4]

Col Dupuy included morale as an independent variable in the QJM’s combat power formula and offered a table of suggested values [5]. However, he did not explain in any detail how to assess morale or apply it in the QJM.

QJM-TNDM Morale Table

As I quoted in my last post, as of 1987, Col Dupuy continued to contend ambivalently that “even though it may not be easily defined and can probably never be quantified, troop morale is very real and can be very important as a contributor to victory or defeat.” He never resolved this seeming contradiction in his writings, but as with several of the intangible variables he identified, he did acknowledge the potential for defining and quantifying some of them. Dr. Fennell’s demonstration of a strong correlation between morale level and rates of sickness, battle exhaustion, desertion, absence without leave and self-inflicted wounds suggests, at least in the British Second Army in northwest Europe in 1944-45, a potential methodology for quantifying morale which could allow its impact to be measured indirectly in much the same manner Col Dupuy measured combat effectiveness. Whether or not the notion of doing so remains controversial will be interesting to see.

NOTES

[1.] Trevor N. Dupuy, Numbers, Predictions & War: Using History To Evaluate Combat Factors And Predict The Outcome Of Battles (New York: The Bobbs-Merrill Company, Inc., 1979), p. 36

[2] ibid., p. 37.

[3] ibid., p. 33.

[4] ibid., p. 37-38.

[5] ibid., p. 231.

Human Factors in Warfare: Measuring Morale

Figure One: Second Army, Weekly Admissions per 1,000 to General Hospitals and Casualty Clearing Stations for Sickness, Battle Exhaustion and SIW, 11 June 1944 to 5 May 1945. Morale scale equivalents are presented on the right hand Y-axis. (Dr. Jonathan Fennell)

One of Trevor Dupuy’s more important and controversial contributions to a theory of combat was the assertion that outcomes were dictated in part by behavioral factors, i.e. the human element. Among the influential human factors he identified were leadership, training, experience, and manpower quality. He also recognized the importance of morale.

Morale is an ephemeral quality of military forces and is certainly intangible. Yet even though it may not be easily defined and can probably never be quantified, troop morale is very real and can be very important as a contributor to victory or defeat. The significance of morale is probably inversely proportional to the quality of troops. A well-trained, well-led, cohesive force of veterans will fight well and effectively even if morale is low… Yet for ordinary armies, poor morale can contribute to defeat.[1]

Dr. Jonathan Fennell of the Defence Studies Department at King’s College London recently set out to determine if there were ways of measuring morale by looking at the combat experiences of the British Army in World War II. Fennell proposed

that the concept of morale has no place in a critical analysis of the past unless it is clearly differentiated from definitions associated solely or primarily with mood or cohesion and the group. Instead, for morale to have explanatory value, particularly in a combat environment, a functional conceptualisation is proposed, which, while not excluding the role of mood or group cohesion, focuses its meaning and relevance on motivation and the willingness to act in a manner required by an authority or institution.

Fennell constructed a multi-dimensional model of morale

By drawing on studies made across the social sciences and on primary archival evidence from the British and Commonwealth Army’s experiences in North Africa in the Second World War… It suggests that morale can best be understood as emerging from the subtle interdependencies and interrelationships of the many factors known to affect military means.

Fennell tested his methodology by developing a weekly morale score using bi-weekly censorship summaries of letters and correspondence from members of the British Second Army in the Northwest Europe Campaign in 1944-45.

These summaries proved a useful source to describe and ‘quantify’ levels of morale (through the use of a numerical morale scale). Where morale was described as ‘excellent’, it was awarded a score of 3. ‘High’ morale was given a score of 2 and ‘good’ morale was scored 1. ‘Satisfactory’ morale was given a score of 0 (neither positive or negative). Morale described as ‘severely tried’ was scored -1, while ‘low’ and ‘very low’ morale were scored -2 and -3 respectively.

He then correlated these scores with weekly statistics compiled by the British Second Army and 21st Army Group on rates of sickness, battle exhaustion, desertion, absence without leave (AWOL) and self-inflicted wounds (SIW).

The results of the correlation analysis showed that the tabulated rates (the combined rate of sickness, battle exhaustion, desertion, AWOL and SIW) had an extremely strong negative correlation with morale (-0.949, P<0.001), i.e. when morale was high, sickness rates etc. were low, and when morale was low, sickness rates etc. were high. This is a remarkably strong relationship and shows that these factors when taken together can be used as a quantitative method to assess levels of morale, at the very least for the Army and campaign under discussion.

The results are shown on the graph above. According to Fennell,

This analysis of morale supports the conclusions of much of the recent historiography on the British Army in Northwest Europe; morale was a necessary component of combat effectiveness (morale in Second Army was broadly speaking high throughout the victorious campaign); however, morale was not a sufficient explanation for Second Army’s successes and failures on the battlefield. For example, morale would appear to have been at its highest before and during Operation ‘Market Garden’. But ‘Market Garden’ was a failure. It is likely, as John Buckley has argued, that ‘Market Garden’ was a conceptual failure rather than a morale one. Morale would also appear to have been mostly high during operations in the Low Countries and Germany, but these operations were beset with setbacks and delays.

Fennell further explored the relationship between morale and combat performance, and combat performance and strategy, in his contribution to Anthony King, ed., Frontline: Combat and Cohesion in the Twenty-First Century (Oxford: Oxford University Press, 2015). An earlier version of his chapter can be found here.

NOTES

[1] Trevor N. Dupuy, Understanding Defeat: How To Recover From Loss In Battle To Gain Victory In War (New York: Paragon House, 1990), p. 67