Tag quantitative analysis

Human Factors In Warfare: Interaction Of Variable Factors

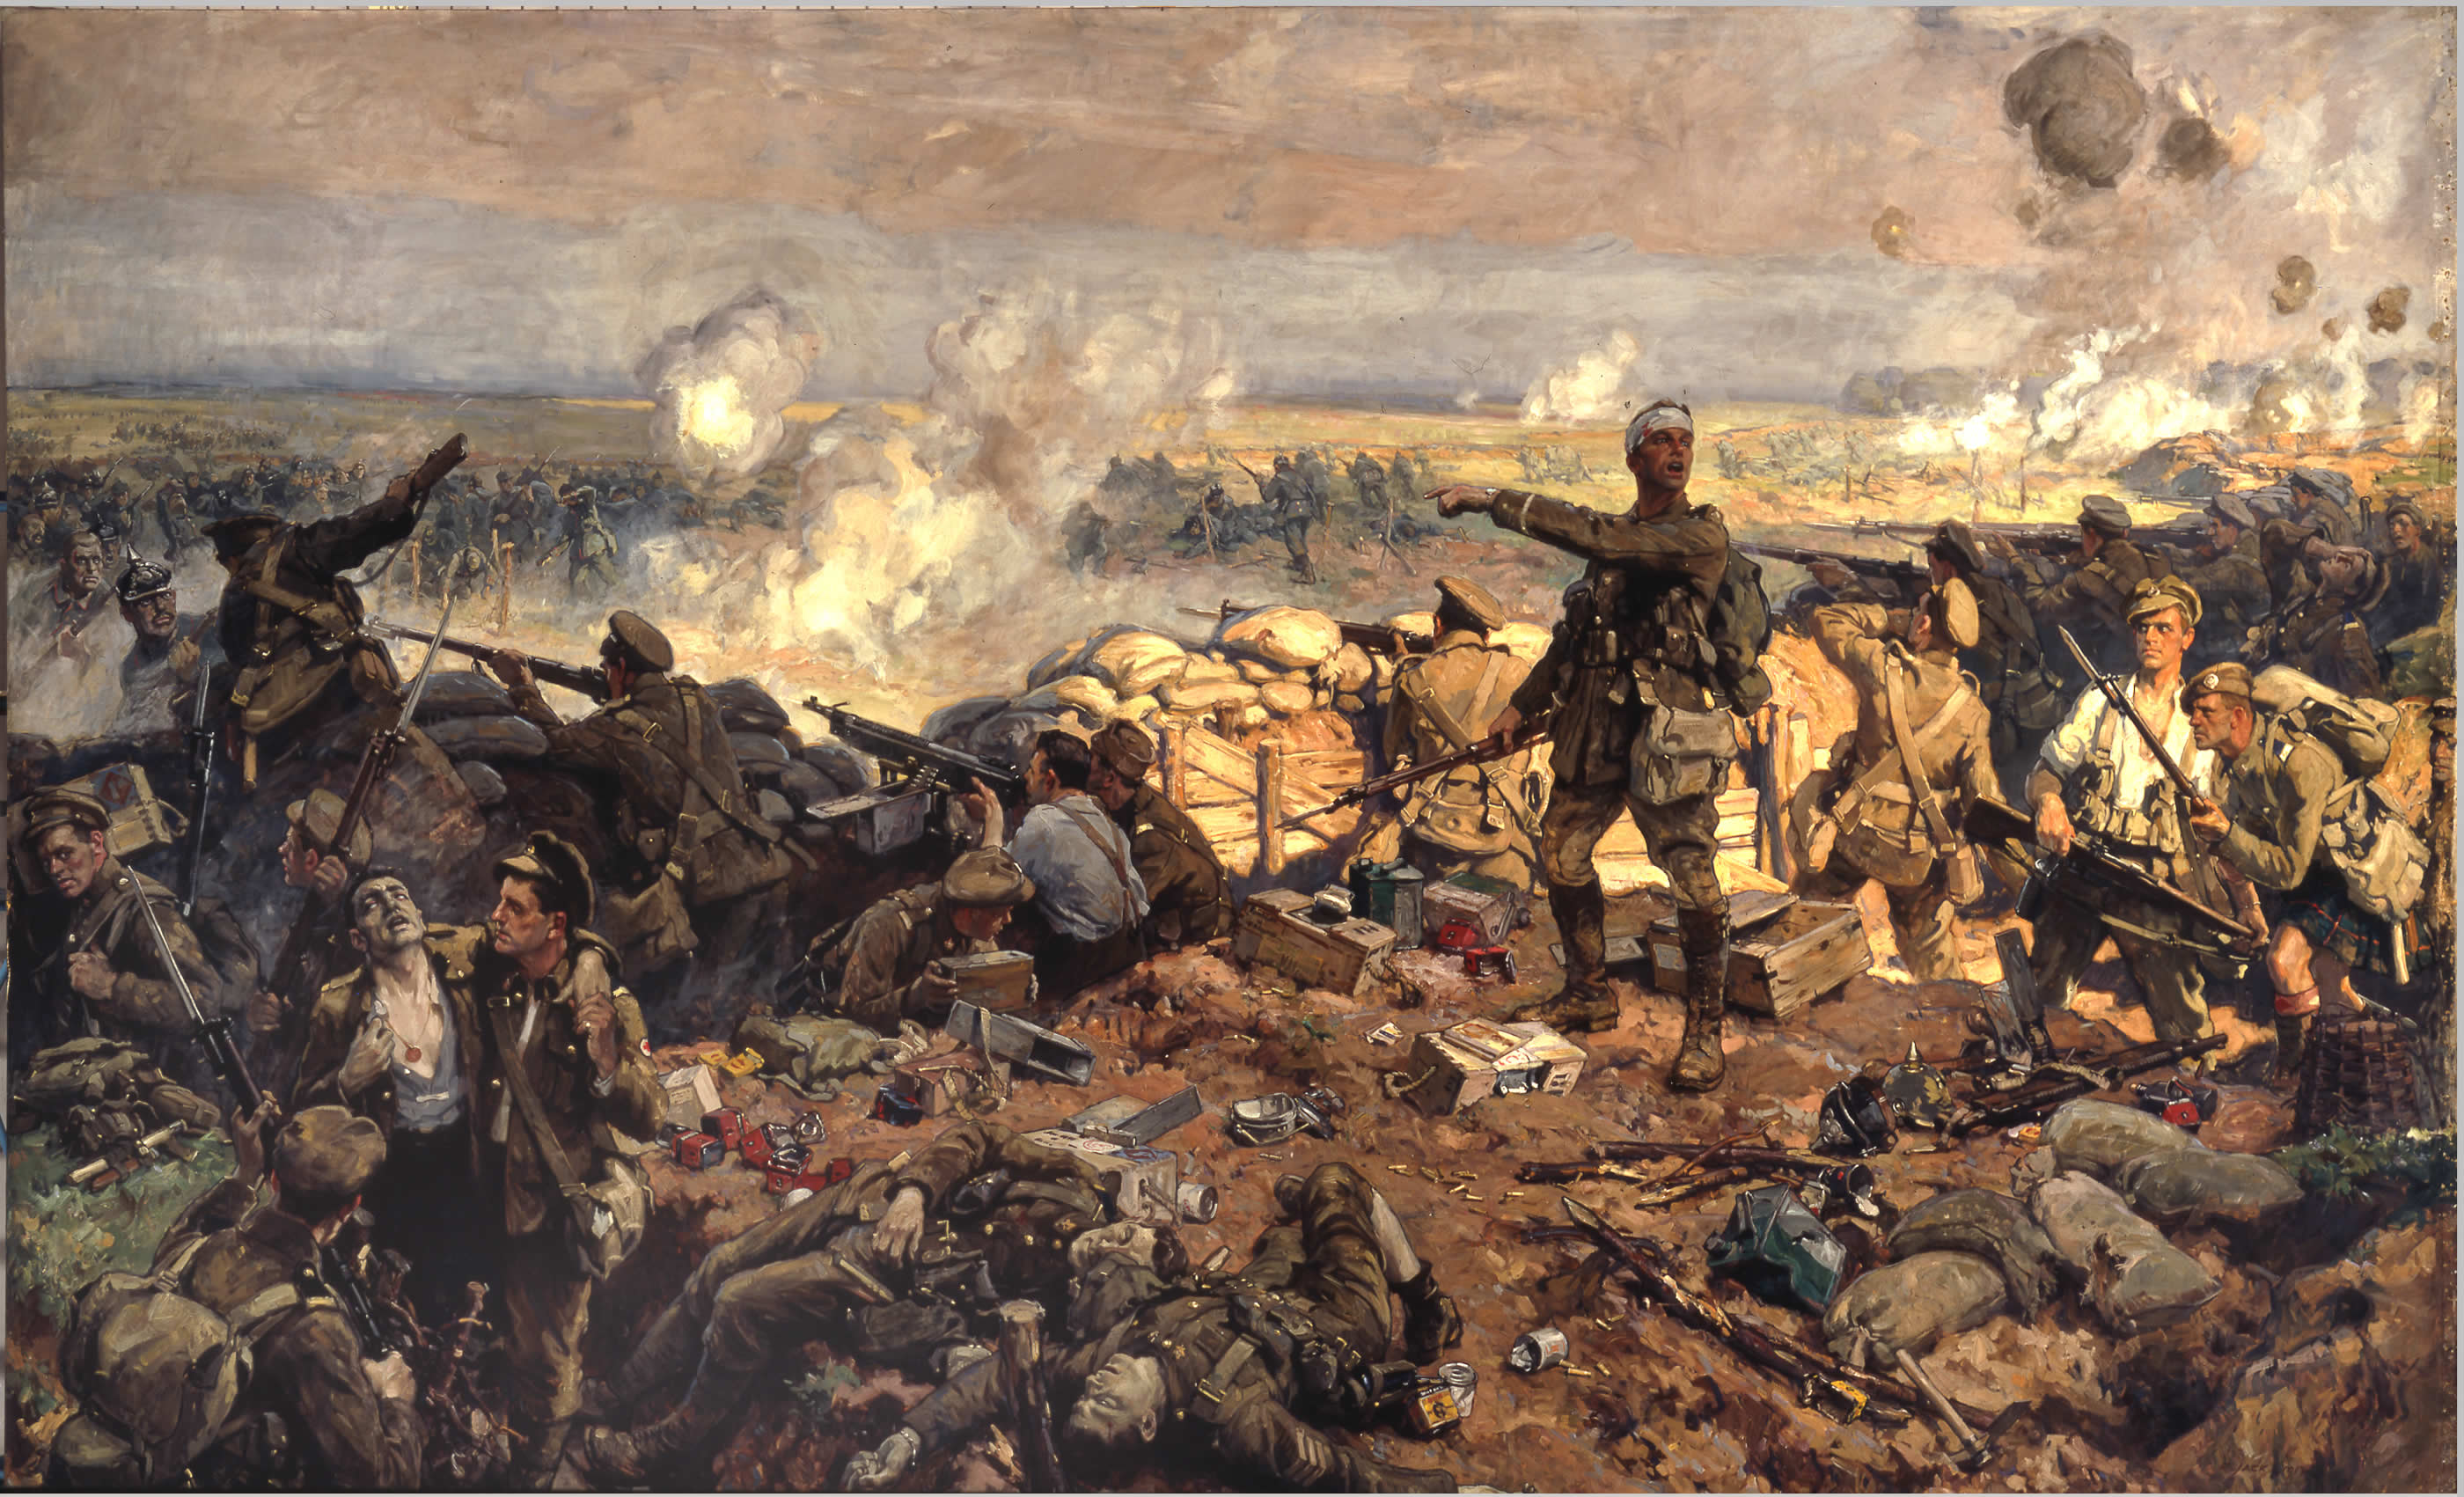
The Second Battle of Ypres, 22 April to 25 May 1915 by Richard Jack [Canadian War Museum]

Trevor Dupuy thought that it was possible to identify and quantify the effects of some individual moral and behavioral (i.e. human) factors on combat. He also believed that many of these factors interacted with each other and with environmental and operational (i.e. physical) variables in combat as well, although parsing and quantifying these effects was a good deal more difficult. Among the combat phenomena he considered to be the result of interaction with human factors were:

Dupuy was critical of combat models and simulations that failed to address these relationships. The prevailing approach to the design of combat modeling used by the U.S. Department of Defense is known as the aggregated, hierarchical, or “bottom-up” construct. Bottom-up models generally use the Lanchester equations, or some variation on them, to calculate combat outcomes between individual soldiers, tanks, airplanes, and ships. These results are then used as inputs for models representing warfare at the brigade/division level, the outputs of which are then fed into theater-level simulations. Many in the American military operations research community believe bottom-up models to be the most realistic method of modeling combat.

Dupuy criticized this approach for many reasons (including the inability of the Lanchester equations to accurately replicate real-world combat outcomes), but mainly because it failed to represent human factors and their interactions with other combat variables.

It is almost undeniable that there must be some interaction among and within the effects of physical as well as behavioral variable factors. I know of no way of measuring this. One thing that is reasonably certain is that the use of the bottom-up approach to model design and development cannot capture such interactions. (Most models in use today are bottom-up models, built up from one-on-one weapons interactions to many-on-many.) Presumably these interactions are captured in a top-down model derived from historical experience, of which there is at least one in existence [by which, Dupuy meant his own].

Dupuy was convinced that any model of combat that failed to incorporate human factors would invariably be inaccurate, which put him at odds with much of the American operations research community.

War does not consist merely of a number of duels. Duels, in fact, are only a very small—though integral—part of combat. Combat is a complex process involving interaction over time of many men and numerous weapons combined in a great number of different, and differently organized, units. This process cannot be understood completely by considering the theoretical interactions of individual men and weapons. Complete understanding requires knowing how to structure such interactions and fit them together. Learning how to structure these interactions must be based on scientific analysis of real combat data.[1]

While this unresolved debate went dormant some time ago, bottom-up models became the simulations of choice in Defense Department campaign planning and analysis. It should be noted, however, that the Defense Department disbanded its campaign-level modeling capabilities in 2011 because the use of the simulations in strategic analysis was criticized as “slow, manpower-intensive, opaque, difficult to explain because of its dependence on complex models, inflexible, and weak in dealing with uncertainty.”

NOTES

[1] Trevor N. Dupuy, Understanding War: History and Theory of Combat (New York: Paragon House, 1987), p. 195.

Human Factors In Warfare: Diminishing Returns In Combat

[Jan Spousta; Wikimedia Commons]

One of the basic problems facing military commanders at all levels is deciding how to allocate available forces to accomplish desired objectives. A guiding concept in this sort of decision-making is economy of force, one of the fundamental and enduring principles of war. As defined in the 1954 edition of U.S. Army Field Manual FM 100-5, Field Service Regulations, Operations (which Trevor Dupuy believed contained the best listing of the principles):

Economy of Force

Minimum essential means must be employed at points other than that of decision. To devote means to unnecessary secondary efforts or to employ excessive means on required secondary efforts is to violate the principle of both mass and the objective. Limited attacks, the defensive, deception, or even retrograde action are used in noncritical areas to achieve mass in the critical area.

How do leaders determine the appropriate means for accomplishing a particular mission? The risk of failing to assign too few forces to a critical task is self-evident, but is it possible to allocate too many? Determining the appropriate means in battle has historically involved subjective calculations by commanders and their staff advisors of the relative combat power of friendly and enemy forces. Most often, it entails a rudimentary numerical comparison of numbers of troops and weapons and estimates of the influence of environmental and operational factors. An exemplar of this is the so-called “3-1 rule,” which holds that an attacking force must achieve a three to one superiority in order to defeat a defending force.

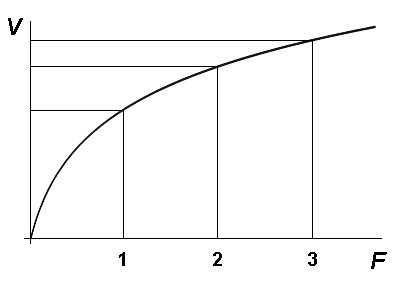
Through detailed analysis of combat data from World War II and the 1967 and 1973 Arab-Israeli wars, Dupuy determined that combat appears subject to a law of diminishing returns and that it is indeed possible to over-allocate forces to a mission.[1] By comparing the theoretical outcomes of combat engagements with the actual results, Dupuy discovered that a force with a combat power advantage greater than double that of its adversary seldom achieved proportionally better results than a 2-1 advantage. A combat power superiority of 3 or 4 to 1 rarely yielded additional benefit when measured in terms of casualty rates, ground gained or lost, and mission accomplishment.

Dupuy also found that attackers sometimes gained marginal benefits from combat power advantages greater than 2-1, though less proportionally and economically than the numbers of forces would suggest. Defenders, however, received no benefit at all from a combat power advantage beyond 2-1.

Two human factors contributed to this apparent force limitation, Dupuy believed, Clausewitzian friction and breakpoints. As described in a previous post, friction accumulates on the battlefield through the innumerable human interactions between soldiers, degrading combat performance. This phenomenon increases as the number of soldiers increases.

A breakpoint represents a change of combat posture by a unit on the battlefield, for example, from attack to defense, or from defense to withdrawal. A voluntary breakpoint occurs due to mission accomplishment or a commander’s order. An involuntary breakpoint happens when a unit spontaneously ceases an attack, withdraws without orders, or breaks and routs. Involuntary breakpoints occur for a variety of reasons (though contrary to popular wisdom, seldom due to casualties). Soldiers are not automatons and will rarely fight to the death.

As Dupuy summarized,

It is obvious that the law of diminishing returns applies to combat. The old military adage that the greater the superiority the better, is not necessarily true. In the interests of economy of force, it appears to be unnecessary, and not really cost-effective, to build up a combat power superiority greater than two-to-one. (Note that this is not the same as a numerical superiority of two-to-one.)[2] Of course, to take advantage of this phenomenon, it is essential that a commander be satisfied that he has a reliable basis for calculating relative combat power. This requires an ability to understand and use “combat multipliers” with greater precision than permitted by U.S. Army doctrine today.[3] [Emphasis added.]

NOTES

[1] This section is drawn from Trevor N. Dupuy, Understanding War: History and Theory of Combat (New York: Paragon House, 1987), Chapter 11.

[2] This relates to Dupuy’s foundational conception of combat power, which is clearly defined and explained in Understanding War, Chapter 8.

[3] Dupuy, Understanding War, p. 139.

Human Factors In Warfare: Friction

The Prussian military philosopher Carl von Clausewitz identified the concept of friction in warfare in his book On War, published in 1832.

Everything in war is very simple, but the simplest thing is difficult. The difficulties accumulate and end by producing a kind of friction that is inconceivable unless one has experienced war… Countless minor incidents—the kind you can never really foresee—combine to lower the general level of performance, so that one always falls far short of the intended goal… Friction is the only concept that more or less corresponds to the factors that distinguish real war from war on paper… None of [the military machine’s] components is of one piece: each part is composed of individuals, every one of whom retains his potential of friction [and] the least important of whom may chance to delay things or somehow make them go wrong…

[Carl von Clausewitz, On War, Edited and translated by Michael Howard and Peter Paret (Princeton, NJ: Princeton University Press, 1984). Book One, Chapter 7, 119-120.]

While recognizing this hugely significant intangible element, Clausewitz also asserted that “[F]riction…brings about effects that cannot be measured, just they are largely due to chance.” Nevertheless, the clearly self-evident nature of friction in warfare subsequently led to the assimilation of the concept into the thinking of most military theorists and practitioners.

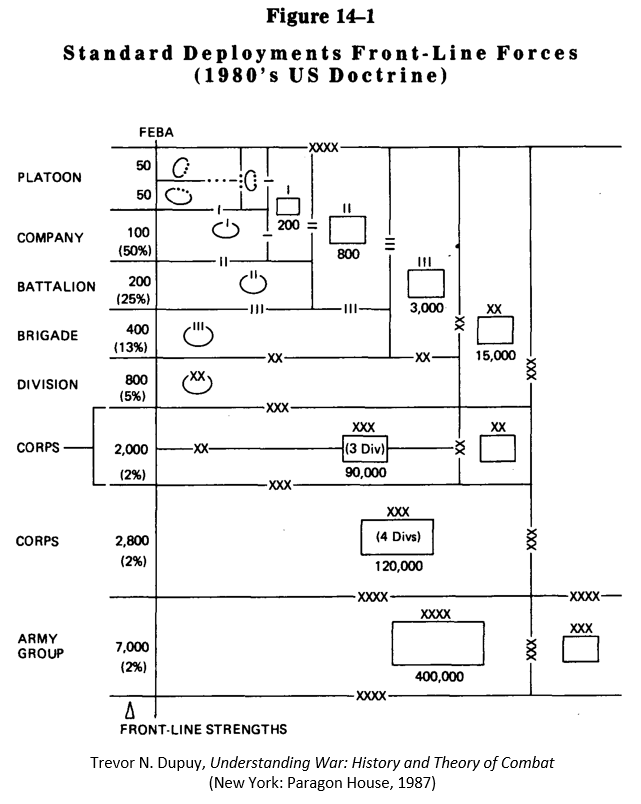
Flash forward 140 years or so. While listening to a lecture on combat simulation, Trevor Dupuy had a flash of insight that led him to conclude that it was indeed possible to measure the effects of friction.[1] Based on his work with historical combat data, Dupuy knew that smaller-sized combat forces suffer higher casualty rates than do larger-sized forces. As the diagram at the top demonstrates, this is partly explained by the fact that small units have a much higher proportion of their front line troops exposed to hostile fire than large units.

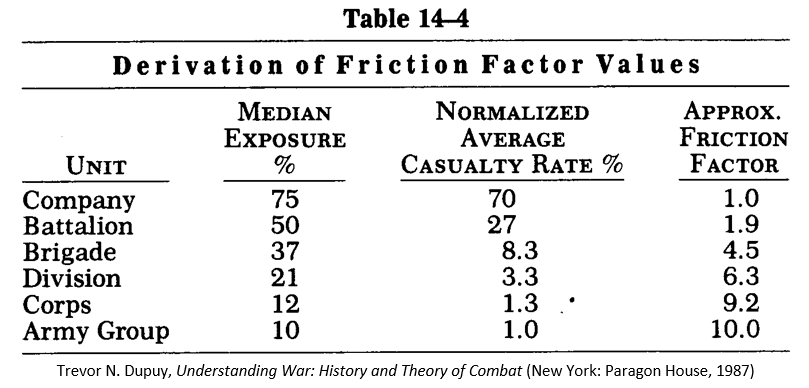
However, this relationship can account for only a fraction of friction’s total effect. The average exposure of a company of 200 soldiers is about seven times greater than an army group of 100,000. Yet, casualty rates for a company in intensive combat can be up to 70 times greater than that of an army group. This discrepancy clearly shows the influence of another factor at work.

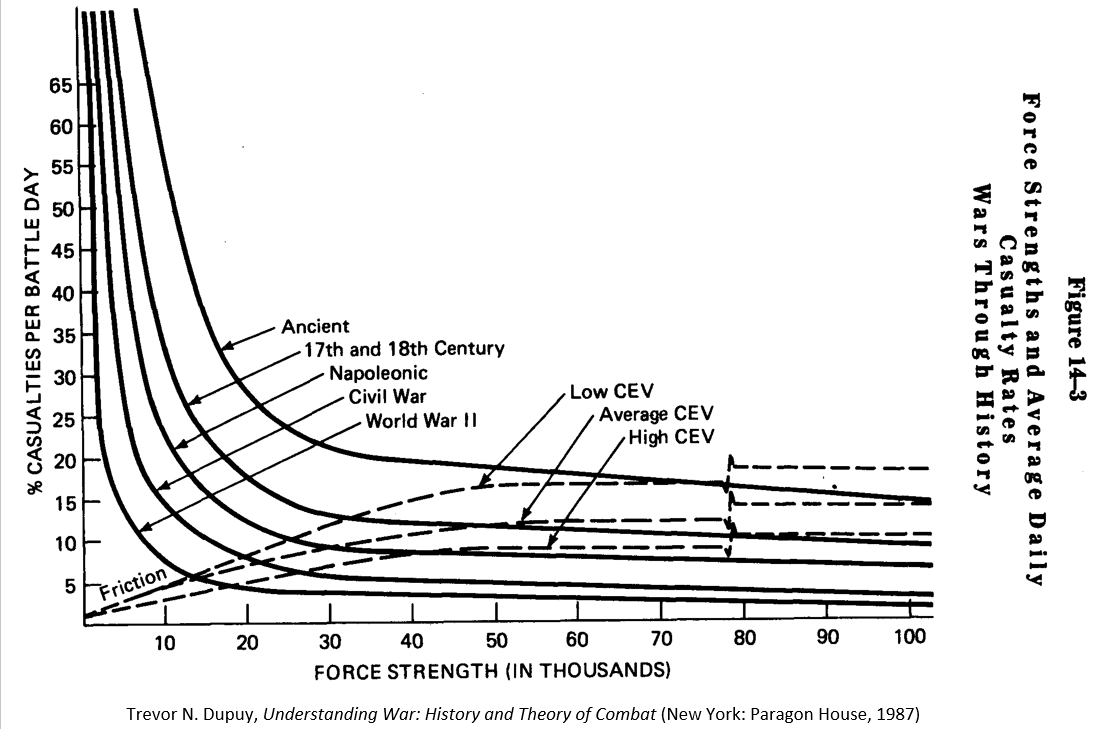
Dupuy hypothesized that this reflected the apparent influence of the relationship between dispersion, deployment, and friction on combat. As friction in combat accumulates through the aggregation of soldiers into larger-sized units, its effects degrade the lethal effects of weapons from their theoretical maximum. Dupuy calculated that friction affects a force of 100,000 ten times more than it does a unit of 200. Being an ambient, human factor on the battlefield, higher quality forces do a better job of managing friction’s effects than do lower quality ones.

After looking at World War II combat casualty data to calculate the effect of friction on combat, Dupuy looked at casualty rates from earlier eras and found a steady correlation, which he believed further validated his hypothesis.

Despite the consistent fit of the data, Dupuy felt that his work was only the beginning of a proper investigation into the phenomenon.

During the periods of actual combat, the lower the level, the closer the loss rates will approach the theoretical lethalities of the weapons in the hands of the opposing combatants. But there will never be a very close relationship of such rates with the theoretical lethalities. War does not consist merely of a number of duels. Duels, in fact, are only a very small—though integral—part of combat. Combat is a complex process involving interaction over time of many men and numerous weapons combined in a great number of different, and differently organized, units. This process cannot be understood completely by considering the theoretical interactions of individual men and weapons. Complete understanding requires knowing how to structure such interactions and fit them together. Learning how to structure these interactions must be based on scientific analysis of real combat data.

NOTES

[1] This post is based on Trevor N. Dupuy, Understanding War: History and Theory of Combat (New York: Paragon House, 1987), Chapter 14.

Military History In The Digital Era

Volumes of the U.S. Army in World War II official history series published by the U.S. Army Center for Military History [Hewes Library photo]

The U.S. National Archives and Records Administration (NARA) has released a draft strategic plan announcing that it will “no longer accept transfers of permanent or temporary records in analog formats and will accept records only in electronic format and with appropriate metadata” by the end of 2022. Given the widespread shift to so-called “paperless” offices across society, this change may not be as drastic as it may seem. Whether this will produce an improvement in record keeping is another question.

Military historians are starting to encounter the impact of electronic records on the preservation and availability of historical documentation of America’s recent conflicts. Adin Dobkin wrote an excellent overview earlier this year on the challenges the U.S Army Center for Military History faces in writing the official histories of the U.S Army in Afghanistan and Iraq. Army field historians on tight deployment timelines “hoovered up” huge amounts of electronic historical documentation during the conflicts. Now official historians have to sort through enormous amounts of material that is often poorly organized and removed from the context from which it was originally created. Despite the volume of material collected, much of it has little historical value and there are gaps in crucial documentation. Separating the useful wheat from the digital chaff can tedious and time-consuming.

Record keeping the paper age was often much better. As Chris wrote earlier this year, TDI conducted three separate studies on Army records management in the late-1990s and early 2000s. Each of these studies warned that U.S. Army documentation retention standards and practices had degraded significantly. Significant gaps existed in operational records vital to future historians. TDI found that the Army had better records for Red Cloud’s War of 1866-1868 than it did a hundred years later for Vietnam.

TDI is often asked why it tends to focus on the World War II era and earlier for its analytical studies. The answer is pretty simple: those are the most recent conflicts for which relatively complete, primary source historical data is available for the opposing combatants. Unfortunately, the Digital Age is unlikely to change that basic fact.

War By Numbers Published

Christopher A. Lawrence, War by Numbers Understanding Conventional Combat (Lincoln, NE: Potomac Books, 2017) 390 pages, $39.95

War by Numbers assesses the nature of conventional warfare through the analysis of historical combat. Christopher A. Lawrence (President and Executive Director of The Dupuy Institute) establishes what we know about conventional combat and why we know it. By demonstrating the impact a variety of factors have on combat he moves such analysis beyond the work of Carl von Clausewitz and into modern data and interpretation.

Using vast data sets, Lawrence examines force ratios, the human factor in case studies from World War II and beyond, the combat value of superior situational awareness, and the effects of dispersion, among other elements. Lawrence challenges existing interpretations of conventional warfare and shows how such combat should be conducted in the future, simultaneously broadening our understanding of what it means to fight wars by the numbers.

The book is available in paperback directly from Potomac Books and in paperback and Kindle from Amazon.

Human Factors In Warfare: Fatigue

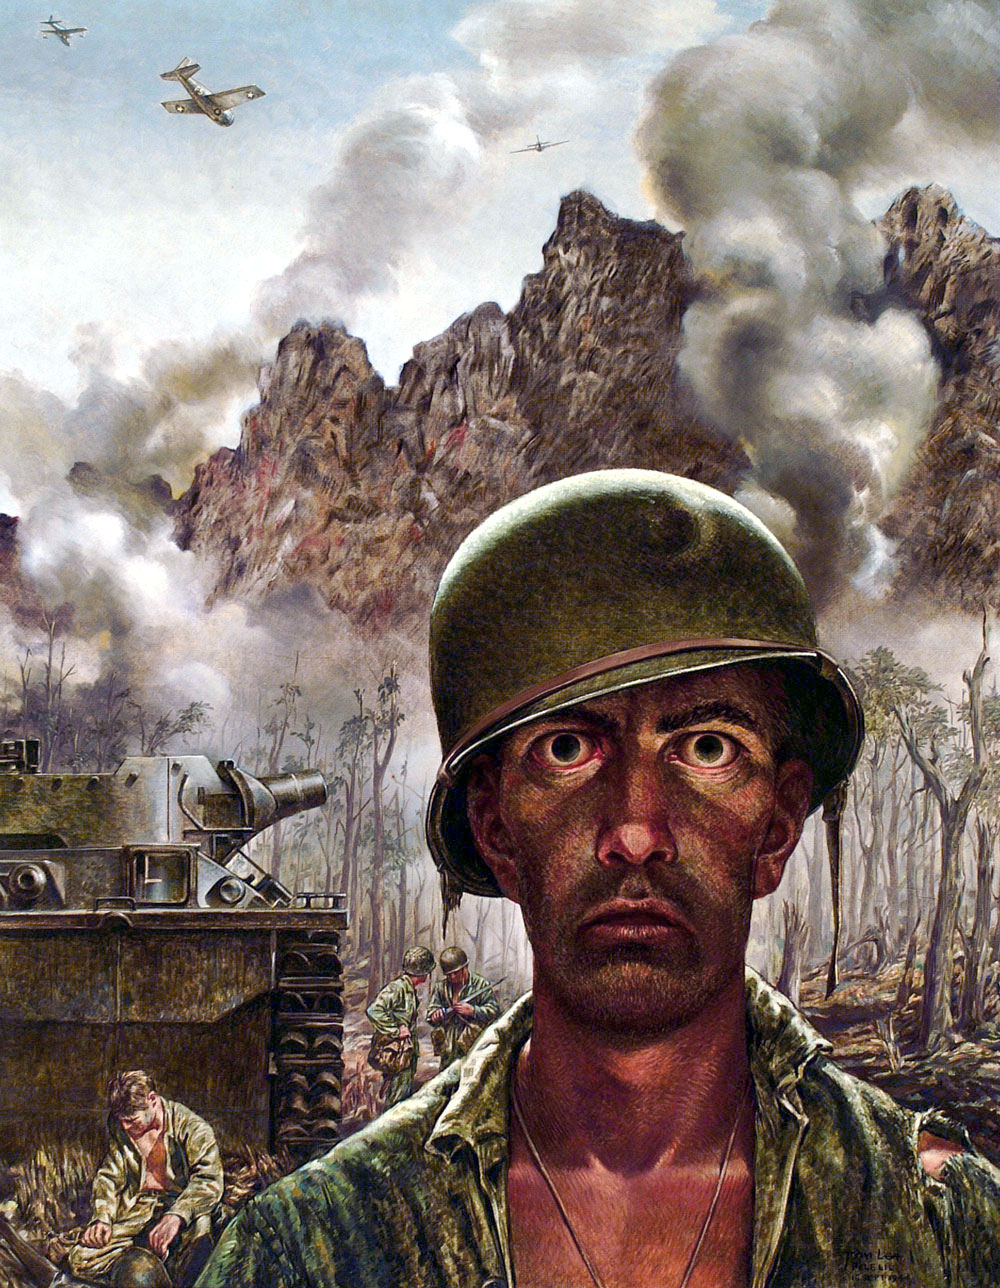
Tom Lea, “The 2,000 Yard Stare” 1944 [Oil on canvas, 36 x 28 Life Collection of Art WWII, U.S. Army Center of Military History, Fort Belvoir, Virginia]

That idea that fatigue is a human factor in combat seems relatively uncontroversial. Military history is replete with examples of how the limits of human physical and mental endurance have affected the character of fighting and the outcome of battles. Perhaps the most salient aspect of military training is preparing soldiers to deal with the rigors of warfare.

Trevor Dupuy was aware that fatigue has a degrading effect on the effectiveness of troops in combat, but he never was able to study the topic specifically himself. He was aware of other examinations of historical experience that were relevant to the issue.

The effectiveness of a military force declines steadily every day that it is engaged in sustained combat. This is an indication that fear has a physical effect on human beings equitable with severe exertion. S.L.A. Marshall documented this extremely well in a report that he wrote a few years before he died. I shall shortly have more to say about S.L.A. Marshall…

An approximate value for the daily effect of fatigue upon the effectiveness of weapons employment emerged from a HERO study several years ago. There is no question that fatigue has a comparable degrading effect upon the ability of a force to advance. I know of no research to ascertain that effect. Until such research is performed, I have arbitrarily assumed that the degrading effect of fatigue upon advance rates is the same as its degrading effect upon weapons effectiveness. To those who might be shocked at such an assumption, my response is: We know there is an effect; it is better to use a crude approximation of that effect than to ignore it…

During World War II when Colonel S.L.A. Marshall was the Chief Historian of the US European Theater of Operations, he undertook a number of interviews of units just after they had been in combat. After the war, in his book Men Against Fire, Marshall asserted that his interviews revealed that only 15% of US infantry soldiers fired their small arms weapons in combat. This revelation created something of a sensation at the time.

It has since been demonstrated that Marshall did not really have solid, scientific data for his assertion. But those who criticize Marshall for unscholarly, unscientific work should realize that in private life he was an exceptionally good newspaper reporter. His conclusions, based upon his observations, may have been largely intuitive, but I am convinced that they were generally, if not specifically, sound…

One of the few examples of the use of military history in the West in recent years was an important study done at the British Defence Operational Analysis Establishment (DOAE) by David Rowland. An unclassified condensation of that study was published in the June 1986 issue of the Journal of the Royal United Services Institution (RUSI). The article, “Assessments of Combat Degradation,” demonstrates conclusively that, in historical combat, small arms weapons have had only one-seventh to one-tenth of their theoretical effectiveness. Rowland does not attempt to say why this is so, but it is interesting that his value of one-seventh is very close to the S. L. A. Marshall 15% figure. Both values translate into casualty effects very similar to those that have emerged from my own research.

The intent of this post is not to rehash the debate on Marshall. As Dupuy noted above, even if Marshall’s conclusions were not based on empirical evidence, his observations on combat were nevertheless on to something important. (Details on the Marshall debate can be easily found with a Google search. A brief discussion took place on the old TDI Forum in 2007.)

David Rowland also presented a paper on the same topic Dupuy referenced above at the Military Operations Research Society (MORS) MORIMOC II conference in 1989, “Assessment of Combat Performance With Small Arms” He later published a book detailing his research on the subject in 2006, The Stress of Battle: Quantifying Human Performance in Combat, which is very much worth tracking down and reading.

Dupuy provided a basic version of his theoretical combat exhaustion methodology on pages 223-224 in Numbers, Predictions and War: Using History to Evaluate Combat Factors and Predict the Outcome of Battles (Indianapolis; New York: The Bobbs-Merrill Co., 1979).

Rules For Exhaustion Rates, 20th Century*

  1. The exhaustion factor (ex) of a fresh unit is 1.0; this is the maximum ex value.
  2. At the conclusion of an engagement, a new ex factor will be calculated for each side.
  3. A unit in normal offensive or defensive combat has its ex factor reduced by .05 for each consecutive day of combat; the ex factor cannot be less than 0.5.
  4. An attacking unit opposed by delaying tactics has its ex factor reduced by 0.05 per day.
  5. A defending unit in delay posture neither loses nor gains in its ex factor.
  6. A withdrawing unit, not seriously engaged, has its ex factor augmented at the rate of 0.05 per day.
  7. An advancing unit in pursuit, and not seriously delayed, neither loses nor gains in its ex factor.
  8. For a unit in reserve, or in non-active posture, an exhaustion factor of less than 1.0 is augmented at the rate of .1 per day.
  9. When a unit in combat, or recently in combat, is reinforced by a unit at least half of its size (in numbers of men), it adopts the ex factor of the reinforcing unit or—if the ex factor of the reinforcing unit is the same or lower than that of the reinforced—both adopt an ex factor 0.1 higher than that of the reinforced unit at the time of reinforcement, save that an ex factor cannot be greater than 1.0.
  10. When a unit in combat, or recently in combat, is reinforced by a unit less than half its size, but not less than one quarter its size, augmentations or modifications of ex factors will be 0.5 times those provided for in paragraph 9, above. When the reinforcing unit is less than one-quarter the size of the reinforced unit, but not less than one-tenth its size, augmentations or modifications of ex factors will be 0.25 times those provided for in paragraph 9, above.

* Approximate reflection of preliminary QJM assessment of effects of casualty and fatigue, WWII engagements. These rates are for division or smaller size; for corps and larger units exhaustion rates are calculated for component divisions and smaller separate units.

EXAMPLES OF APPLICATION

  1. A division in continuous offensive combat for five days stays in the line in inactive posture for two days, then resumes the offensive:
    1. Combat exhaustion effect: 1 – (5 x .05) = 0.75;
    2. Recuperation effect: 75 + (2 x .l) = 0.95.
  2. A division in defensive posture for fifteen days is ordered to undertake a counterattack:
    1. Combat exhaustion effect: 1 – (15 x .05) =0.25; this is below the minimum ex factor, which therefore applies: 0.5;
    2. Recuperation effect: None; ex factor is 0.5.
  3. A division in offensive posture for three days is reinforced by two fresh brigades:
    1. Combat exhaustion effect: 1 – (3 x .05) = 0.85;
    2. Reinforcement effect: Augmentation from 0.85 to 1.0.
  4. A division in offensive posture for three days is reinforced by one fresh brigade:
    1. Combat exhaustion effect: 1 – (3 x .05) = 0.85;
    2. Reinforcement effect: 0.5 x augmentation from 0.85 to 1 = 0.93.

Human Factors In Warfare: Combat Intensity

Battle of Spotsylvania by Thure de Thulstrup (1886) [Library of Congress]

Trevor Dupuy considered intensity to be another combat phenomena influenced by human factors. The variation in the intensity of combat is an aspect of battle that is widely acknowledged but little studied.

No one who has paid any attention at all to historical combat statistics can have failed to notice that some battles have been very bloody and hard-fought, while others—often under circumstances superficially similar—have reached a conclusion with relatively light casualties on one or both sides. I don’t believe that it is terribly important to find a quantitative reason for such differences, mainly because I don’t think there is any quantitative reason. The differences are usually due to such things as the general circumstances existing when the battles are fought, the personalities of the commanders, and the natures of the missions or objectives of one or both of the hostile forces, and the interactions of these personalities and missions.

From my standpoint the principal reason for trying to quantify the intensity of a battle is for purposes of comparative analysis. Just because casualties are relatively low on one or both sides does not necessarily mean that the battle was not intensive. And if the casualty rates are misinterpreted, then the analysis of the outcome can be distorted. For instance, a battle fought on a flat plain between two military forces will almost invariably have higher casualty rates for both sides than will a battle between those same two forces in mountainous terrain. A battle between those two forces in a heavy downpour, or in cold, wintry weather, will have lower casualties than when the forces are opposed to each other, under otherwise identical circumstances, in good weather. Casualty rates for small forces in a given set of circumstances are invariably higher than the rates for larger forces under otherwise identical circumstances.

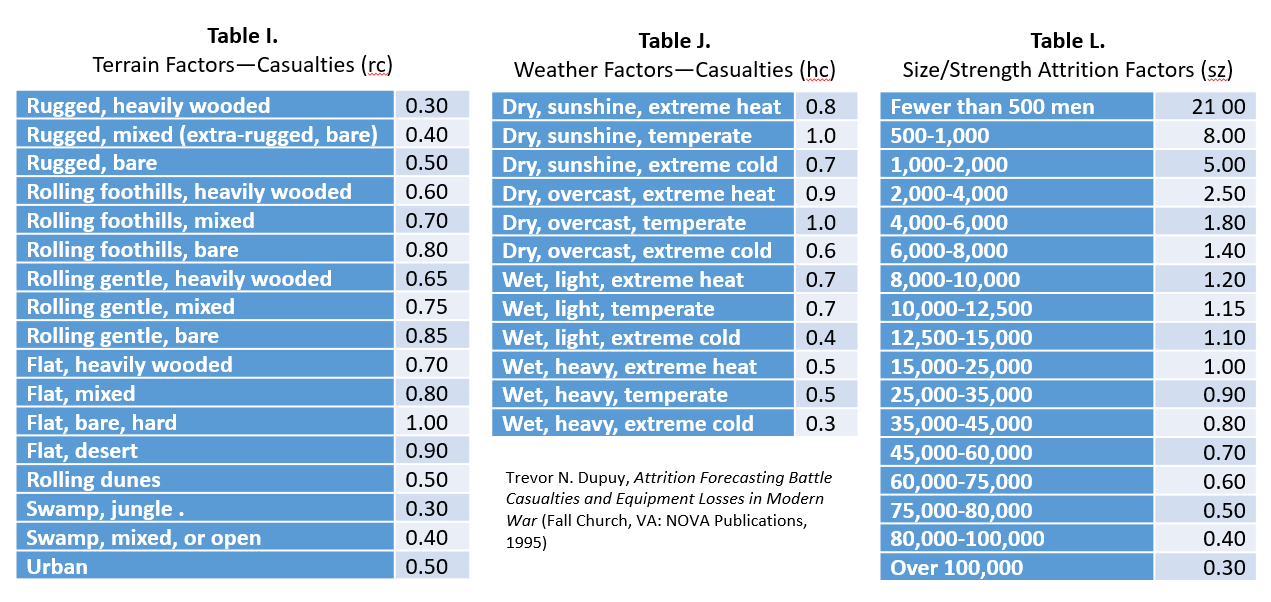
If all of these things are taken into consideration, then it is possible to assess combat intensity fairly consistently. The formula I use is as follows:

CI = CR / (sz’ x rc x hc)

When:     CI = Combat Intensity Measure

CR = Casualty rate in percent per day

sz’ = Square root of sz, a factor reflecting the effect of size upon casualty rates, derived from historical experience

rc = The effect of terrain on casualty rates, derived from historical experience

hc = The effect of weather on casualty rates, derived from historical experience

I then (somewhat arbitrarily) identify seven levels of intensity:

0.00 to 0.49 Very low intensity (1)

0.50 to 0.99 Low intensity (56)

1.00 to 1.99 Normal intensity (213)

2.00 to 2.99 High intensity (101)

3.00 to 3.99 Very high intensity (30)

4.00 to 5.00 Extremely high intensity (17)

Over 5.00 Catastrophic outcome (20)

The numbers in parentheses show the distribution of intensity on each side in 219 battles in DMSi’s QJM data base. The catastrophic battles include: the Russians in the Battles of Tannenberg and Gorlice Tarnow on the Eastern Front in World War I; the Russians on the first day of the Battle of Kursk in July 1943; a British defeat in Malaya in December, 1941; and 16 Japanese defeats on Okinawa. Each of these catastrophic instances, quantitatively identified, is consistent with a qualitative assessment of the outcome.

[UPDATE]

As Clinton Reilly pointed out in the comments, this works better when the equation variables are provided. These are from Trevor N. Dupuy, Attrition Forecasting Battle Casualties and Equipment Losses in Modern War (Fall Church, VA: NOVA Publications, 1995), pp. 146, 147, 149.

Human Factors In Warfare: Surprise

By John Trumbull (1756-1843) – Yale University Art Gallery – The Death of Paulus Aemilius at the Battle of Cannae, Public Domain

Trevor Dupuy considered surprise to be one of the most important human factors on the battlefield.

A military force that is surprised is severely disrupted, and its fighting capability is severely degraded. Surprise is usually achieved by the side that has the initiative, and that is attacking. However, it can be achieved by a defending force. The most common example of defensive surprise is the ambush.

Perhaps the best example of surprise achieved by a defender was that which Hannibal gained over the Romans at the Battle of Cannae, 216 BC, in which the Romans were surprised by the unexpected defensive maneuver of the Carthaginians. This permitted the outnumbered force, aided by the multiplying effect of surprise, to achieve a double envelopment of their numerically stronger force.

It has been hypothesized, and the hypothesis rather conclusively substantiated, that surprise can be quantified in terms of the enhanced mobility (quantifiable) which surprise provides to the surprising force, by the reduced vulnerability (quantifiable) of the surpriser, and the increased vulnerability (quantifiable) of the side that is surprised.

I have written in detail previously about Dupuy’s treatment of surprise. He cited it as one of his timeless verities of combat.  As one of the most powerful force multipliers available in battle, he calculated that achieving complete surprise could more than double the combat power of a force.

Aussie OR

Over the years I have run across a number of Australian Operations Research and Historical Analysis efforts. Overall, I have been impressed with what I have seen. Below is one of their papers written by Nigel Perry. He is not otherwise known to me. It is dated December 2011: Applications of Historical Analyses in Combat Modeling

It does address the value of Lanchester equations in force-on-force combat models, which in my mind is already a settled argument (see: Lanchester Equations Have Been Weighed). His is the latest argument that I gather reinforces this point.

The author of this paper references the work of Robert Helmbold and Dean Hartley (see page 14). He does favorably reference the work of Trevor Dupuy but does not seem to be completely aware of the extent or full nature of it (pages 14, 16, 17, 24 and 53). He does not seem to aware that the work of Helmbold and Hartley was both built from a database that was created by Trevor Dupuy’s companies HERO & DMSI. Without Dupuy, Helmbold and Hartley would not have had data to work from.

Specifically, Helmbold was using the Chase database, which was programmed by the government from the original paper version provided by Dupuy. I think it consisted of 597-599 battles (working from memory here). It also included a number of coding errors when they programmed it and did not include the battle narratives. Hartley had Oakridge National Laboratories purchase a computerized copy from Dupuy of what was now called the Land Warfare Data Base (LWDB). It consisted of 603 or 605 engagements (and did not have the coding errors but still did not include the narratives). As such, they both worked from almost the same databases.

Dr. Perrty does take a copy of Hartley’s  database and expands it to create more engagements. He says he expanded it from 750 battles (except the database we sold to Harley had 603 or 605 cases) to around 1600. It was estimated in the 1980s by Curt Johnson (Director and VP of HERO) to take three man-days to create a battle. If this estimate is valid (actually I think it is low), then to get to 1600 engagements the Australian researchers either invested something like 10 man-years of research, or relied heavily on secondary sources without any systematic research, or only partly developed each engagement (for example, only who won and lost). I suspect the latter.

Dr. Perry shows on page 25:

Data-segment……..Start…….End……Number of……Attacker…….Defender

Epoch…………………Year…….Year……..Battles………Victories……Victories

Ancient………………- 490…….1598………….63………………36……………..27

17th Century……….1600…….1692………….93………………67……………..26

18th Century……….1700…….1798………..147…………….100……………..47

Revolution…………..1792……1800…………238…………….168…………….70

Empire……………….1805……1815…………327……………..203…………..124

ACW………………….1861……1865…………143……………….75…………….68

19th Century……….1803…….1905…………126……………….81…………….45

WWI………………….1914…….1918…………129……………….83…………….46

WWII…………………1920…….1945…………233……………..165…………….68

Korea………………..1950…….1950…………..20……………….20………………0

Post WWII………….1950……..2008…………118……………….86…………….32


We, of course, did something very similar. We took the Land Warfare Data Base (the 605 engagement version), expanded in considerably with WWII and post-WWII data, proofed and revised a number of engagements using more primarily source data, divided it into levels of combat (army-level, division-level, battalion-level, company-level) and conducted analysis with the 1280 or so engagements we had. This was a much more powerful and better organized tool. We also looked at winner and loser, but used the 605 engagement version (as we did the analysis in 1996). An example of this, from pages 16 and 17 of my manuscript for War by Numbers shows:

Attacker Won:


                        Force Ratio                Force Ratio    Percent Attack Wins:

                        Greater than or         less than          Force Ratio Greater Than

                        equal to 1-to-1            1-to1                or equal to 1-to-1

1600-1699        16                              18                         47%

1700-1799        25                              16                         61%

1800-1899        47                              17                         73%

1900-1920        69                              13                         84%

1937-1945      104                                8                         93%

1967-1973        17                              17                         50%

Total               278                              89                         76%


Defender Won:


                        Force Ratio                Force Ratio    Percent Defense Wins:

                        Greater than or         less than          Force Ratio Greater Than

                        equal to 1-to-1            1-to1                or equal to 1-to-1

1600-1699           7                                6                       54%

1700-1799         11                              13                       46%

1800-1899         38                              20                       66%

1900-1920         30                              13                       70%

1937-1945         33                              10                       77%

1967-1973         11                                5                       69%

Total                130                              67                       66%


Anyhow, from there (pages 26-59) the report heads into an extended discussion of the analysis done by Helmbold and Hartley (which I am not that enamored with). My book heads in a different direction: War by Numbers III (Table of Contents)