Tag Prediction

Attrition In Future Land Combat

Soldiers with Battery C, 1st Battalion, 82nd Field Artillery Regiment, 1st Brigade Combat Team, 1st Cavalry Division maneuver their Paladins through Hohenfels Training Area, Oct. 26. Photo Credit: Capt. John Farmer, 1st Brigade Combat Team, 1st Cav

Last autumn, U.S. Army Chief of Staff General Mark Milley asserted that “we are on the cusp of a fundamental change in the character of warfare, and specifically ground warfare. It will be highly lethal, very highly lethal, unlike anything our Army has experienced, at least since World War II.” He made these comments while describing the Army’s evolving Multi-Domain Battle concept for waging future combat against peer or near-peer adversaries.

How lethal will combat on future battlefields be? Forecasting the future is, of course, an undertaking fraught with uncertainties. Milley’s comments undoubtedly reflect the Army’s best guesses about the likely impact of new weapons systems of greater lethality and accuracy, as well as improved capabilities for acquiring targets. Many observers have been closely watching the use of such weapons on the battlefield in the Ukraine. The spectacular success of the Zelenopillya rocket strike in 2014 was a convincing display of the lethality of long-range precision strike capabilities.

It is possible that ground combat attrition in the future between peer or near-peer combatants may be comparable to the U.S. experience in World War II (although there were considerable differences between the experiences of the various belligerents). Combat losses could be heavier. It certainly seems likely that they would be higher than those experienced by U.S. forces in recent counterinsurgency operations.

Unfortunately, the U.S. Defense Department has demonstrated a tenuous understanding of the phenomenon of combat attrition. Despite wildly inaccurate estimates for combat losses in the 1991 Gulf War, only modest effort has been made since then to improve understanding of the relationship between combat and casualties. The U.S. Army currently does not have either an approved tool or a formal methodology for casualty estimation.

Historical Trends in Combat Attrition

Trevor Dupuy did a great deal of historical research on attrition in combat. He found several trends that had strong enough empirical backing that he deemed them to be verities. He detailed his conclusions in Understanding War: History and Theory of Combat (1987) and Attrition: Forecasting Battle Casualties and Equipment Losses in Modern War (1995).

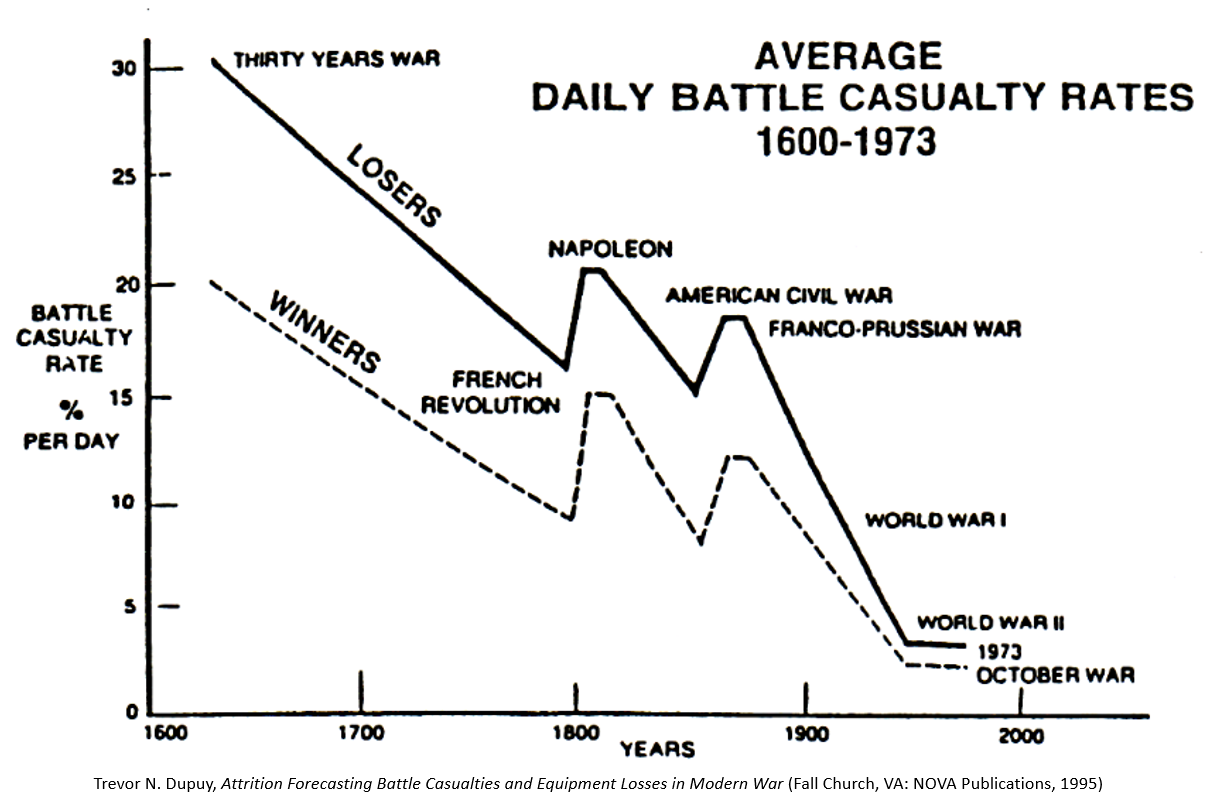
Dupuy documented a clear relationship over time between increasing weapon lethality, greater battlefield dispersion, and declining casualty rates in conventional combat. Even as weapons became more lethal, greater dispersal in frontage and depth among ground forces led daily personnel loss rates in battle to decrease.

The average daily battle casualty rate in combat has been declining since 1600 as a consequence. Since battlefield weapons continue to increase in lethality and troops continue to disperse in response, it seems logical to presume the trend in loss rates continues to decline, although this may not necessarily be the case. There were two instances in the 19th century where daily battle casualty rates increased—during the Napoleonic Wars and the American Civil War—before declining again. Dupuy noted that combat casualty rates in the 1973 Arab-Israeli War remained roughly the same as those in World War II (1939-45), almost thirty years earlier. Further research is needed to determine if average daily personnel loss rates have indeed continued to decrease into the 21st century.

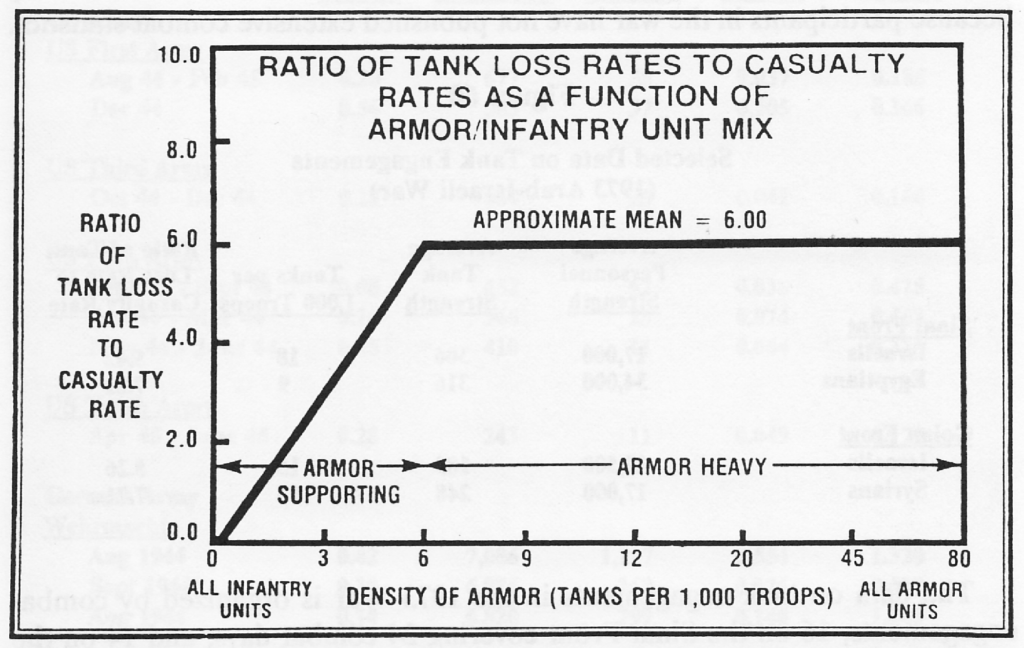
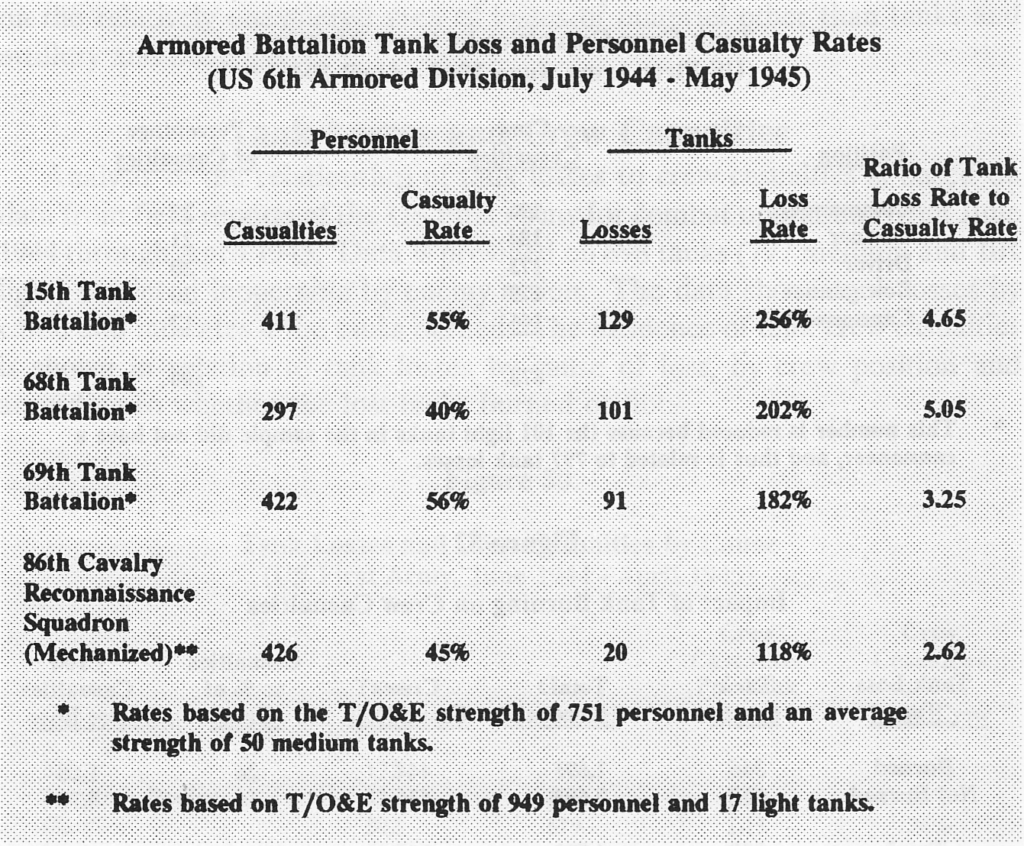
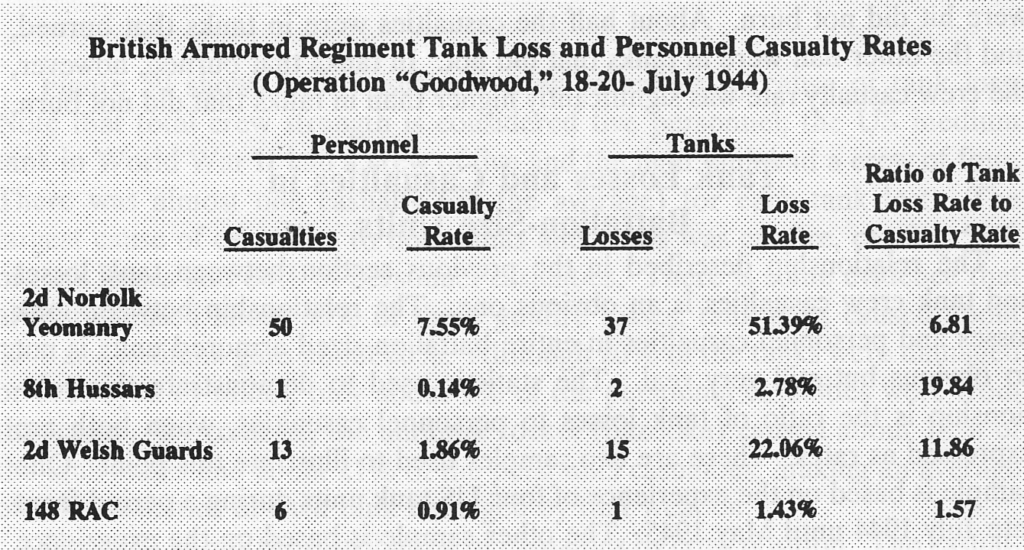
Dupuy also discovered that, as with battle outcomes, casualty rates are influenced by the circumstantial variables of combat. Posture, weather, terrain, season, time of day, surprise, fatigue, level of fortification, and “all out” efforts affect loss rates. (The combat loss rates of armored vehicles, artillery, and other other weapons systems are directly related to personnel loss rates, and are affected by many of the same factors.) Consequently, yet counterintuitively, he could find no direct relationship between numerical force ratios and combat casualty rates. Combat power ratios which take into account the circumstances of combat do affect casualty rates; forces with greater combat power inflict higher rates of casualties than less powerful forces do.

Winning forces suffer lower rates of combat losses than losing forces do, whether attacking or defending. (It should be noted that there is a difference between combat loss rates and numbers of losses. Depending on the circumstances, Dupuy found that the numerical losses of the winning and losing forces may often be similar, even if the winner’s casualty rate is lower.)

Dupuy’s research confirmed the fact that the combat loss rates of smaller forces is higher than that of larger forces. This is in part due to the fact that smaller forces have a larger proportion of their troops exposed to enemy weapons; combat casualties tend to concentrated in the forward-deployed combat and combat support elements. Dupuy also surmised that Prussian military theorist Carl von Clausewitz’s concept of friction plays a role in this. The complexity of interactions between increasing numbers of troops and weapons simply diminishes the lethal effects of weapons systems on real world battlefields.

Somewhat unsurprisingly, higher quality forces (that better manage the ambient effects of friction in combat) inflict casualties at higher rates than those with less effectiveness. This can be seen clearly in the disparities in casualties between German and Soviet forces during World War II, Israeli and Arab combatants in 1973, and U.S. and coalition forces and the Iraqis in 1991 and 2003.

Combat Loss Rates on Future Battlefields

What do Dupuy’s combat attrition verities imply about casualties in future battles? As a baseline, he found that the average daily combat casualty rate in Western Europe during World War II for divisional-level engagements was 1-2% for winning forces and 2-3% for losing ones. For a divisional slice of 15,000 personnel, this meant daily combat losses of 150-450 troops, concentrated in the maneuver battalions (The ratio of wounded to killed in modern combat has been found to be consistently about 4:1. 20% are killed in action; the other 80% include mortally wounded/wounded in action, missing, and captured).

It seems reasonable to conclude that future battlefields will be less densely occupied. Brigades, battalions, and companies will be fighting in spaces formerly filled with armies, corps, and divisions. Fewer troops mean fewer overall casualties, but the daily casualty rates of individual smaller units may well exceed those of WWII divisions. Smaller forces experience significant variation in daily casualties, but Dupuy established average daily rates for them as shown below.

For example, based on Dupuy’s methodology, the average daily loss rate unmodified by combat variables for brigade combat teams would be 1.8% per day, battalions would be 8% per day, and companies 21% per day. For a brigade of 4,500, that would result in 81 battle casualties per day, a battalion of 800 would suffer 64 casualties, and a company of 120 would lose 27 troops. These rates would then be modified by the circumstances of each particular engagement.

Several factors could push daily casualty rates down. Milley envisions that U.S. units engaged in an anti-access/area denial environment will be constantly moving. A low density, highly mobile battlefield with fluid lines would be expected to reduce casualty rates for all sides. High mobility might also limit opportunities for infantry assaults and close quarters combat. The high operational tempo will be exhausting, according to Milley. This could also lower loss rates, as the casualty inflicting capabilities of combat units decline with each successive day in battle.

It is not immediately clear how cyberwarfare and information operations might influence casualty rates. One combat variable they might directly impact would be surprise. Dupuy identified surprise as one of the most potent combat power multipliers. A surprised force suffers a higher casualty rate and surprisers enjoy lower loss rates. Russian combat doctrine emphasizes using cyber and information operations to achieve it and forces with degraded situational awareness are highly susceptible to it. As Zelenopillya demonstrated, surprise attacks with modern weapons can be devastating.

Some factors could push combat loss rates up. Long-range precision weapons could expose greater numbers of troops to enemy fires, which would drive casualties up among combat support and combat service support elements. Casualty rates historically drop during night time hours, although modern night-vision technology and persistent drone reconnaissance might will likely enable continuous night and day battle, which could result in higher losses.

Drawing solid conclusions is difficult but the question of future battlefield attrition is far too important not to be studied with greater urgency. Current policy debates over whether or not the draft should be reinstated and the proper size and distribution of manpower in active and reserve components of the Army hinge on getting this right. The trend away from mass on the battlefield means that there may not be a large margin of error should future combat forces suffer higher combat casualties than expected.

Insurgency In The DPRK?


North Korean leader Kim Jong Un visits the Kumsusan Palace of the Sun in Pyongyang, July 27, 2014. [KCNA/REUTERS]

As tensions have ratcheted up on the Korean peninsula following a new round of provocative actions by the Democratic People’s Republic of Korea (DPRK; North Korea), the prospect of war has once more become prominent. Renewed hostilities between the DPRK and the Republic of Korea (ROK; South Korea) is an old and oft studied scenario for the U.S. military. Although potential combat is likely to be intense, there is consensus that ROK forces and their U.S. allies would eventually prevail.

There is a great deal less clarity about what might happen after a military defeat of the DPRK. Military analyst and Columbia University professor Austin Long has taken a very interesting look at the prospect of an insurgency arising from the ashes of the regime of Kim Jong Un. Long does not confine the prospect of an insurgency in the north to a post-war scenario; it would be possible following any abrupt or forcible collapse of authority.

Long begins by looking at some of the historical factors for insurgency in a post-regime change environment and then examines each in the North Korean context. These include 1) unsecured weapons stockpiles; 2) elite regime forces;3) disbanded mass armies; 4) social network ties; 5) mobilizing ideology; and 6) sanctuary. He concludes that “the potential for an insurgency beginning after the collapse of the DPRK appears contingent but significant.”

With so much focus on the balance of conventional conflict, the potential for insurgency in North Korea might be of secondary concern. Hopefully, recent U.S. experience with the consequences of regime change will lead political and military planners to take it seriously.

Insurgencies, Civil Conflicts, And Messy Endings

[© Reuters/Navesh Chitrakar]

The question of how insurgencies end is crucially important. There is no consensus on how to effectively wage counterinsurgency much less end one on favorable terms. Even successful counterinsurgencies may not end decisively. In the Dupuy Insurgency Spread Sheets (DISS) database of 83 post-World War II insurgencies, interventions, and stabilization operations, 42 are counterinsurgent successes and 11 had indeterminate conclusions. Of the counterinsurgent successes, about 1/3 failed to bring about stability or achieve long-term success.

George Frederick Willcoxon, an economist with the United Nations, recently looked into the question of why up to half of countries that suffer civil conflict relapse into violence between the same belligerents within a decade. He identified risk factors for reversion to war by examining the end of civil conflict and post-war recovery in 109 cases since 1970, drawing upon data from the Uppsala Conflict Data Program, the Peace Research Institute Oslo, the Polity IV project and the World Bank.

His conclusions were quite interesting:

Long-standing international conventional wisdom prioritizes economic reforms, transitional justice mechanisms or institutional continuity in post-war settings. However, my statistical analyses found that political institutions and military factors were actually the primary drivers of post-war risk. In particular, post-war states with more representative and competitive political systems as well as larger armed forces were better able to avoid war relapse.

These findings challenge a growing reluctance to consider early elections and political liberalization as critical steps for reestablishing authoritative, legitimate and sustainable political order after major armed conflict.

The non-results are perhaps as interesting as the results. With one exception discussed below, there is no evidence that the economic characteristics of post-war countries strongly influence the likelihood they will return to war. Income per capita, development assistance per capita, oil rents as a percent of GDP, overall unemployment rates and youth unemployment rates are not associated with civil war relapse.

Equally significant is there is no evidence that the culture, religion or geopolitics of the Middle East and North Africa will impede post-war recovery. I introduced into the statistical models measures for Islam, Arab culture and location in the region. None of these variables showed statistically significant correlations with the risk of war relapse since 1970, holding everything else constant, suggesting that such factors should not distinctively handicap post-war stabilization, recovery and transition in Iraq, Libya, Syria or Yemen.

Willcoxon’s research suggested a correlation between numbers of security forces and successfully preventing new violence.

Perhaps not surprisingly, larger security sectors reduce the risk of war relapse. For every additional soldier in the national armed forces per 1,000 people, the risk of relapse is about seven percent lower. Larger militaries are better able to deter renewed rebel activity, as well as prevent or reduce other forms of conflict such as terrorism, organized crime and communal violence.

He also found that the types of security forces had an influence as well.

The presence of outside troops also has significant influence on risk. The analysis lends support to a well-established finding in the political science literature that the presence of United Nations peacekeepers lowers the risk of conflict relapse. However, the presence of non-U.N. foreign troops almost triples the risk of relapsing back into civil war. There are at least two potential interpretations on this latter finding: Foreign troops may intervene in especially difficult circumstances, and therefore their presence indicates the post-war episodes most likely to fail; or foreign troops, particularly occupying armies, generate their own conflict risk.

These findings are strikingly similar to TDI’s research that suggests that higher force ratios of counterinsurgent troops to insurgents correlate with counterinsurgent success. You can check Willcoxon’s paper out here.

Predictions

We do like to claim we have predicted the casualty rates correctly in three wars (operations): 1) The 1991 Gulf War, 2) the 1995 Bosnia intervention, and 3) the Iraq insurgency.  Furthermore, these were predictions make of three very different types of operations, a conventional war, an “operation other than war” (OOTW) and an insurgency.

The Gulf War prediction was made in public testimony by Trevor Dupuy to Congress and published in his book If War Comes: How to Defeat Saddam Hussein. It is discussed in my book America’s Modern Wars (AMW) pages 51-52 and in some blog posts here.

The Bosnia intervention prediction is discussed in Appendix II of AMW and the Iraq casualty estimate is Chapter 1 and Appendix I.

We like to claim that we are three for three on these predictions. What does that really mean? If the odds of making a correct prediction are 50/50 (the same as a coin toss), then the odds of getting three correct predictions in a row is 12.5%. We may not be particularly clever, just a little lucky.

On the other hand, some might argue that these predictions were not that hard to make, and knowledgeable experts would certainly predict correctly at least two-thirds of the time. In that case the odds of getting three correct predictions in a row is more like 30%.

Still, one notes that there was a lot of predictions concerning the Gulf War that were higher than Trevor Dupuy’s. In the case of Bosnia, the Joint Staff was informed by a senior OR (Operations Research) office in the Army that there was no methodology for predicting losses in an “operation other than war” (AMW, page 309). In the case of the Iraq casualty estimate, we were informed by a director of an OR organization that our estimate was too high, and that the U.S. would suffer less than 2,000 killed and be withdrawn in a couple of years (Shawn was at that meeting). I think I left that out of my book in its more neutered final draft….my first draft was more detailed and maybe a little too “angry”. So maybe, predicting casualties in military operations is a little tricky. If the odds of a correct prediction was only one-in-three, then the odds of getting three correct predictions in a row is only 4%. For marketing purposes, we like this argument better 😉

Hard to say what are the odds of making a correct prediction are. The only war that had multiple public predictions (and of course, several private and classified ones) was the 1991 Gulf War. There were a number of predictions made and we believe most were pretty high. There was no other predictions we are aware of for Bosnia in 1995, other than the “it could turn into another Vietnam” ones. There are no other predictions we are aware of for Iraq in 2004, although lots of people were expressing opinions on the subject. So, it is hard to say how difficult it is to make a correct prediction in these cases.

P.S.: Yes, this post was inspired by my previous post on the Stanley Cup play-offs.


Tank Loss Rates in Combat: Then and Now

wwii-tank-battlefieldAs the U.S. Army and the national security community seek a sense of what potential conflicts in the near future might be like, they see the distinct potential for large tank battles. Will technological advances change the character of armored warfare? Perhaps, but it seems more likely that the next big tank battles – if they occur – will likely resemble those from the past.

One aspect of future battle of great interest to military planners is probably going to tank loss rates in combat. In a previous post, I looked at the analysis done by Trevor Dupuy on the relationship between tank and personnel losses in the U.S. experience during World War II. Today, I will take a look at his analysis of historical tank loss rates.

In general, Dupuy identified that a proportional relationship exists between personnel casualty rates in combat and losses in tanks, guns, trucks, and other equipment. (His combat attrition verities are discussed here.) Looking at World War II division and corps-level combat engagement data in 1943-1944 between U.S., British and German forces in the west, and German and Soviet forces in the east, Dupuy found similar patterns in tank loss rates.

attrition-fig-58

In combat between two division/corps-sized, armor-heavy forces, Dupuy found that the tank loss rates were likely to be between five to seven times the personnel casualty rate for the winning side, and seven to 10 for the losing side. Additionally, defending units suffered lower loss rates than attackers; if an attacking force suffered a tank losses seven times the personnel rate, the defending forces tank losses would be around five times.

Dupuy also discovered the ratio of tank to personnel losses appeared to be a function of the proportion of tanks to infantry in a combat force. Units with fewer than six tanks per 1,000 troops could be considered armor supporting, while those with a density of more than six tanks per 1,000 troops were armor-heavy. Armor supporting units suffered lower tank casualty rates than armor heavy units.

attrition-fig-59

Dupuy looked at tank loss rates in the 1973 Arab-Israeli War and found that they were consistent with World War II experience.

What does this tell us about possible tank losses in future combat? That is a very good question. One guess that is reasonably certain is that future tank battles will probably not involve forces of World War II division or corps size. The opposing forces will be brigade combat teams, or more likely, battalion-sized elements.

Dupuy did not have as much data on tank combat at this level, and what he did have indicated a great deal more variability in loss rates. Examples of this can be found in the tables below.

attrition-fig-53attrition-fig-54

These data points showed some consistency, with a mean of 6.96 and a standard deviation of 6.10, which is comparable to that for division/corps loss rates. Personnel casualty rates are higher and much more variable than those at the division level, however. Dupuy stated that more research was necessary to establish a higher degree of confidence and relevance of the apparent battalion tank loss ratio. So one potentially fruitful area of research with regard to near future combat could very well be a renewed focus on historical experience.

NOTES

Trevor N. Dupuy, Attrition: Forecasting Battle Casualties and Equipment Losses in Modern War (Falls Church, VA: NOVA Publications, 1995), pp. 41-43; 81-90; 102-103

Forecasting U.S. Casualties in Bosnia

Photo by Ssgt. Lisa Zunzanyika-Carpenter 1st Combat Camera Charleston AFB SC

In previous posts, I highlighted a call for more prediction and accountability in the field of security studies, and detailed Trevor N. Dupuy’s forecasts for the 1990-1991 Gulf War. Today, I will look at The Dupuy Institute’s 1995 estimate of potential casualties in Operation JOINT ENDEAVOR, the U.S. contribution to the North Atlantic Treaty Organization (NATO) peacekeeping effort in Bosnia and Herzegovina.

On 1 November 1995, the leaders of the Serbia, Croatia, and Bosnia, rump states left from the breakup of Yugoslavia, along with representatives from the United States, European Union, and Russia, convened in Dayton, Ohio to negotiate an end to a three-year civil war. The conference resulted from Operation DELIBERATE FORCE, a 21-day air campaign conducted by NATO in August and September against Bosnian Serb forces in Bosnia.

A key component of the negotiation involved deployment of a NATO-led Implementation Force (IFOR) to replace United Nations troops charged with keeping the peace between the warring factions. U.S. European Command (USEUCOM) and NATO had been evaluating potential military involvement in the former Yugoslavia since 1992, and U.S. Army planners started operational planning for a ground mission in Bosnia in August 1995. The Joint Chiefs of Staff alerted USEUCOM for a possible deployment to Bosnia on 2 November.[1]

Up to that point, U.S. President Bill Clinton had been reluctant to commit U.S. ground forces to the conflict and had not yet agreed to do so as part of the Dayton negotiations. As part of the planning process, Joint Staff planners contacted the Deputy Undersecretary of the Army for Operations Research for assistance in developing an estimate of potential U.S. casualties in a peacekeeping operation. The planners were told that no methodology existed for forecasting losses in such non-combat contingency operations.[2]

On the same day the Dayton negotiation began, the Joint Chiefs contracted The Dupuy Institute to use its historical expertise on combat casualties to produce an estimate within three weeks for likely losses in a commitment of 20,000 U.S. troops to a 12-month peacekeeping mission in Bosnia. Under the overall direction of Nicholas Krawciw (Major General, USA, ret.), then President of The Dupuy Institute, a two-track analytical effort began.

One line of effort analyzed the different phases of the mission and compiled list of potential lethal threats for each, including non-hostile accidents. Losses were forecasted using The Dupuy Institute’s combat model, the Tactical Numerical Deterministic Model (TNDM), and estimates of lethality and frequency for specific events. This analysis yielded a probabilistic range for possible casualties.

The second line of inquiry looked at data on 144 historical cases of counterinsurgency and peacekeeping operations compiled for a 1985 study by The Dupuy Institute’s predecessor, the Historical Evaluation and Research Organization (HERO), and other sources. Analysis of 90 of these cases, including all 38 United Nations peacekeeping operation to that date, yielded sufficient data to establish baseline estimates for casualties related to force size and duration.

Coincidentally and fortuitously, both lines of effort produced estimates that overlapped, reinforcing confidence in their validity. The Dupuy Institute delivered its forecast to the Joint Chiefs of Staff within two weeks. It estimated possible U.S. casualties for two scenarios, one a minimal deployment intended to limit risk, and the other for an extended year-long mission.

For the first scenario, The Dupuy Institute estimated 11 to 29 likely U.S. fatalities with a pessimistic potential for 17 to 42 fatalities. There was also the real possibility for a high-casualty event, such as a transport plane crash. For the 12-month deployment, The Dupuy Institute forecasted a 50% chance that U.S. killed from all causes would be below 17 (12 combat deaths and 5 non-combat fatalities) and a 90% chance that total U.S. fatalities would be below 25.

Chairman of the Joint Chiefs of Staff General John Shalikashvili carried The Dupuy Institute’s casualty estimate with him during the meeting in which President Clinton decided to commit U.S. forces to the peacekeeping mission. The participants at Dayton reached agreement on 17 November and an accord was signed on 14 December. Operation JOINT ENDEAVOR began on 2 December with 20,000 U.S. and 60,000 NATO troops moving into Bosnia to keep the peace. NATO’s commitment in Bosnia lasted until 2004 when European Union forces assumed responsibility for the mission.

There were six U.S. casualties from all causes and no combat deaths during JOINT ENDEAVOR.

NOTES

[1] Details of U.S. military involvement in Bosnia peacekeeping can be found in Robert F. Baumann, George W. Gawrych, Walter E. Kretchik, Armed Peacekeepers in Bosnia (Combat Fort Leavenworth, KS: Studies Institute Press, 2004); R. Cody Phillips, Bosnia-Herzegovina: The U.S. Army’s Role in Peace Enforcement Operations, 1995-2004 (Washington, D.C.: U.S. Army Center for Military History, 2005); Harold E. Raugh,. Jr., ed., Operation JOINT ENDEAVOR: V Corps in Bosnia-Herzogovina, 1995-1996: An Oral History (Fort Leavenworth, KS. : Combat Studies Institute Press, 2010).

[2] The Dupuy Instiute’s Bosnia casualty estimate is detailed in Christopher A. Lawrence, America’s Modern Wars: Understanding Iraq, Afghanistan and Vietnam (Philadelphia, PA: Casemate, 2015); and Christopher A. Lawrence, “How Military Historians Are Using Quantitative Analysis — And You Can Too,” History News Network, 15 March 2015.

Estimating Combat Casualties II

Just a few comments on this article:

  1. One notes the claim of 30,000 killed for the 1991 Gulf War. This was typical of some of the discussion at the time. As we know, the real figure was much, much lower.
  2. Note that Jack Anderson is quoting some “3-to-1 Rule.” We are not big fans of “3-to-1 Rules.” Trevor Dupuy does briefly refute it.
  3. Trevor Dupuy does end the discussion by mentioning “combat power ratios.” This is not quite the same as “force ratios.”

Anyhow, interesting blast from the past, although some of this discussion we were also conducting a little over a week ago at a presentation we provided.


Estimating Combat Casualties I

Shawn Woodford was recently browsing in a used bookstore in Annapolis. He came across a copy of Genius for War. Tucked in the front cover was this clipping from the Washington Post. It is undated, but makes reference to a Jack Anderson article from 1 November, presumably 1990. So it must have been published sometime shortly thereafter.

19901100EstimatingCombatCasualties


Assessing the 1990-1991 Gulf War Forecasts

Wargames
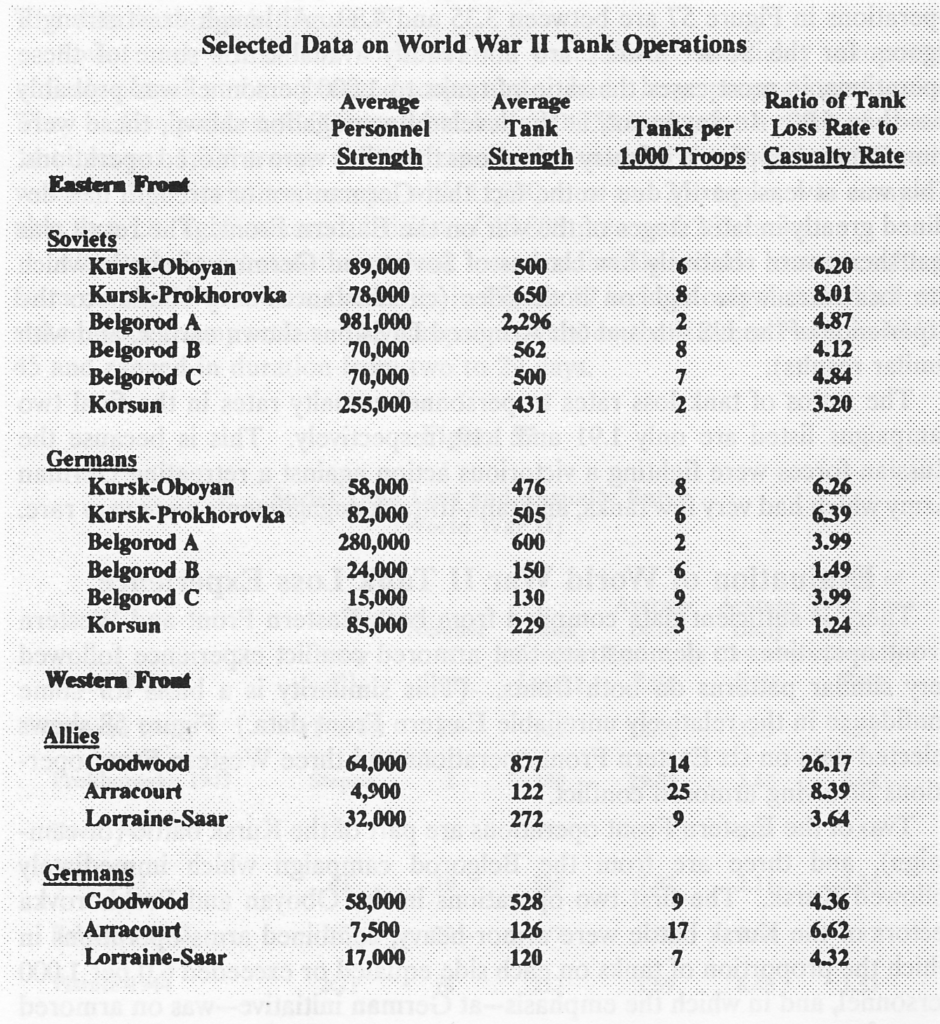
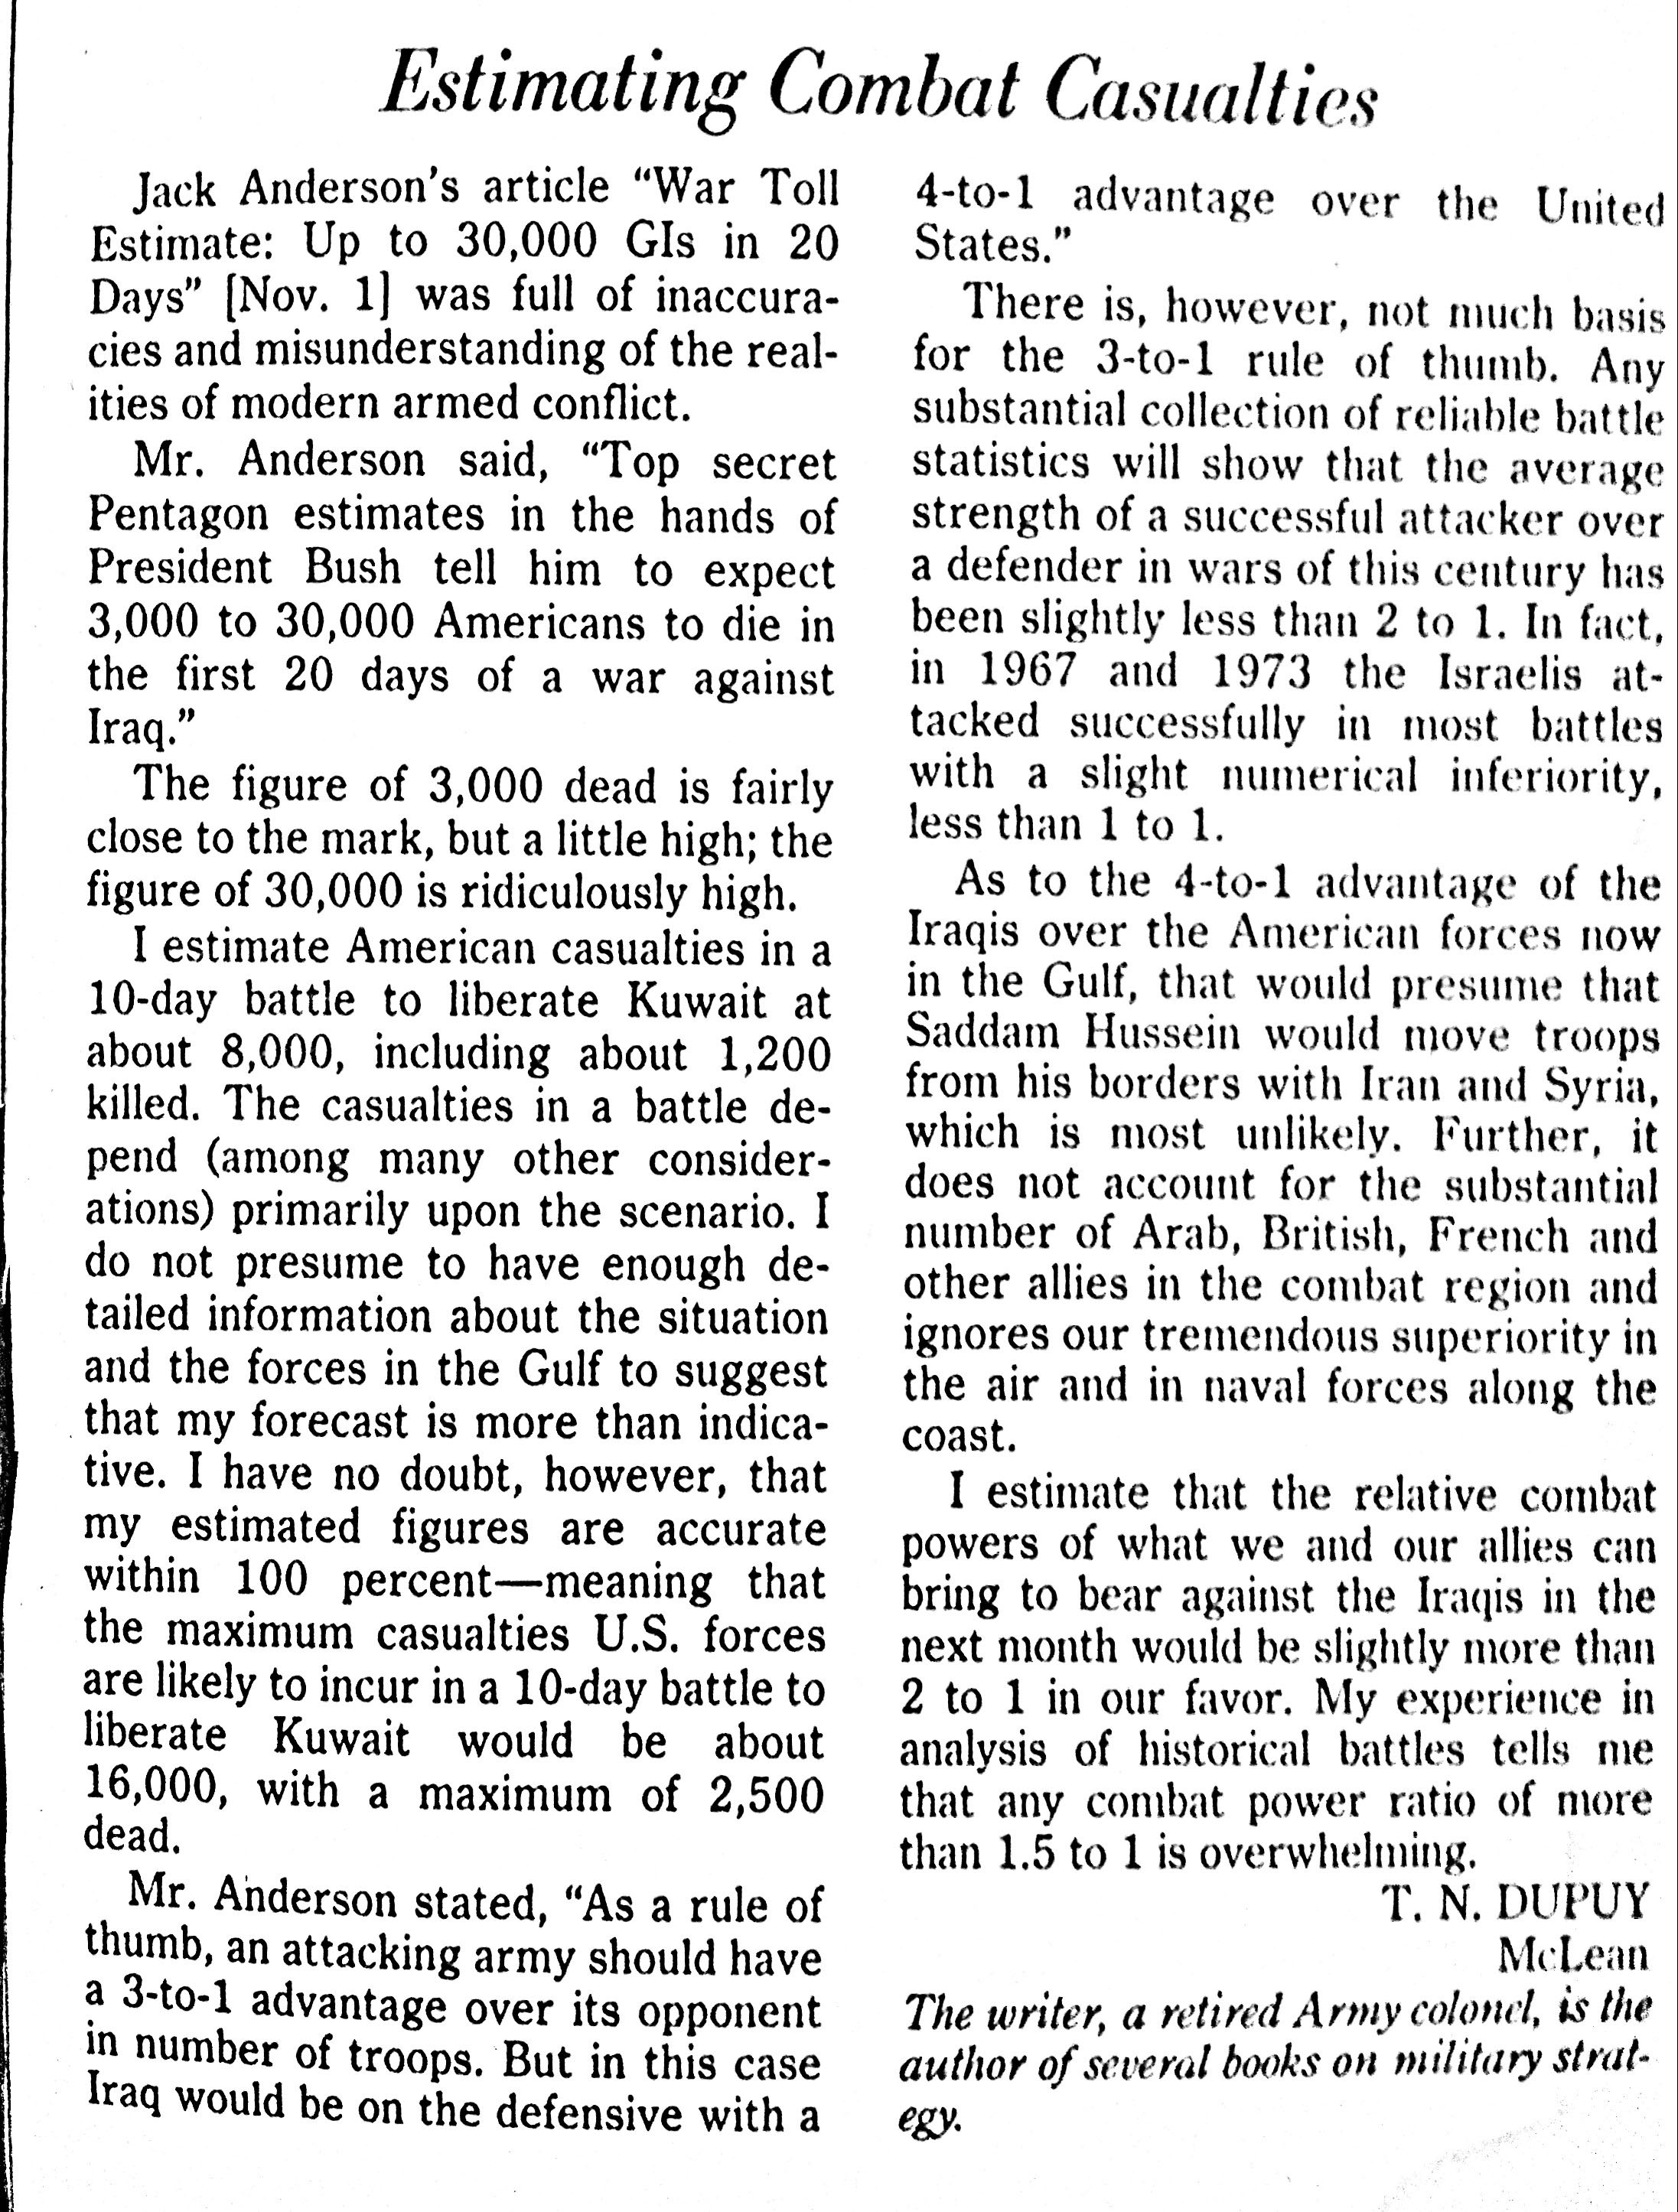
A number of forecasts of potential U.S. casualties in a war to evict Iraqi forces from Kuwait appeared in the media in the autumn of 1990. The question of the human costs became a political issue for the administration of George H. W. Bush and influenced strategic and military decision-making.

Almost immediately following President Bush’s decision to commit U.S. forces to the Middle East in August 1990, speculation appeared in the media about what a war between Iraq and a U.S.-led international coalition might entail. In early September, U.S. News & World Report reported “that the U.S. Joint Chiefs of Staff and the National Security Council estimated that the United States would lose between 20,000 and 30,000 dead and wounded soldiers in a Gulf war.” The Bush administration declined official comment on these figures at the time, but the media indicated that they were derived from Defense Department computer models used to wargame possible conflict scenarios.[1] The numbers shocked the American public and became unofficial benchmarks in subsequent public discussion and debate.

A Defense Department wargame exploring U.S. options in Iraq had taken place on 25 August, the results of which allegedly led to “major changes” in military planning.[2] Although linking the wargame and the reported casualty estimate is circumstantial, the cited figures were very much in line with other contemporary U.S. military casualty estimates. A U.S. Army Personnel Command [PERSCOM] document that informed U.S. Central Command [USCENTCOM] troop replacement planning, likely based on pre-crisis plans for the defense of Saudi Arabia against possible Iraqi invasion, anticipated “about 40,000” total losses.[3]

These early estimates were very likely to have been based on a concept plan involving a frontal attack on Iraqi forces in Kuwait using a single U.S. Army corps and a U.S. Marine Expeditionary Force. In part due to concern about potential casualties from this course of action, the Bush administration approved USCENTCOM commander General Norman Schwarzkopf’s preferred concept for a flanking offensive using two U.S. Army corps and additional Marine forces.[4] Despite major reinforcements and a more imaginative battle plan, USCENTCOM medical personnel reportedly briefed Defense Secretary Dick Cheney and Joint Chiefs Chairman Colin Powell in December 1990 that they were anticipating 20,000 casualties, including 7,000 killed in action.[5] Even as late as mid-February 1991, PERSCOM was forecasting 20,000 U.S. casualties in the first five days of combat.[6]

The reported U.S. government casualty estimates prompted various public analysts to offer their own public forecasts. One anonymous “retired general” was quoted as saying “Everyone wants to have the number…Everyone wants to be able to say ‘he’s right or he’s wrong, or this is the way it will go, or this is the way it won’t go, or better yet, the senator or the higher-ranking official is wrong because so-and-so says that the number is this and such.’”[7]

Trevor Dupuy’s forecast was among the first to be cited by the media[8], and he presented it before a hearing of the Senate Armed Services Committee in December.

Other prominent public estimates were offered by political scientists Barry Posen and John J. Mearshimer, and military analyst Joshua Epstein. In November, Posen projected that the Coalition would initiate an air offensive that would quickly gain air superiority, followed by a frontal ground attack lasting approximately 20 days incurring 4,000 (with 1,000 dead) to 10,000 (worst case) casualties. He used the historical casualty rates experienced by Allied forces in Normandy in 1944 and the Israelis in 1967 and 1973 as a rough baseline for his prediction.[9]

Epstein’s prediction in December was similar to Posen’s. Coalition forces would begin with a campaign to obtain control of the air, followed by a ground attack that would succeed within 15-21 days, incurring between 3,000 and 16,000 U.S. casualties, with 1,049-4,136 killed. Like Dupuy, Epstein derived his forecast from a combat model, the Adaptive Dynamic Model.[10]

On the eve of the beginning of the air campaign in January 1991, Mearshimer estimated that Coalition forces would defeat the Iraqis in a week or less and that U.S. forces would suffer fewer than 1,000 killed in combat. Mearshimer’s forecast was based on a qualitative analysis of Coalition and Iraqi forces as opposed to a quantitative one. Although like everyone else he failed to foresee the extended air campaign and believed that successful air/land breakthrough battles in the heart of the Iraqi defenses would minimize casualties, he did fairly evaluate the disparity in quality between Coalition and Iraqi combat forces.[11]

In the aftermath of the rapid defeat of Iraqi forces in Kuwait, the media duly noted the singular accuracy of Mearshimer’s prediction.[12] The relatively disappointing performance of the quantitative models, especially the ones used by the Defense Department, punctuated debates within the U.S. military operations research community over the state of combat modeling. Dubbed “the base of sand problem” by RAND analysts Paul Davis and Donald Blumenthal, serious questions were raised about the accuracy and validity of the methodologies and constructs that underpinned the models.[13] Twenty-five years later, many of these questions remain unaddressed. Some of these will be explored in future posts.

NOTES

[1] “Potential War Casualties Put at 100,000; Gulf crisis: Fewer U.S. troops would be killed or wounded than Iraq soldiers, military experts predict,” Reuters, 5 September 1990; Benjamin Weiser, “Computer Simulations Attempting to Predict the Price of Victory,” Washington Post, 20 January 1991

[2] Brian Shellum, A Chronology of Defense Intelligence in the Gulf War: A Research Aid for Analysts (Washington, D.C.: DIA History Office, 1997), p. 20

[3] John Brinkerhoff and Theodore Silva, The United States Army Reserve in Operation Desert Storm: Personnel Services Support (Alexandria, VA: ANDRULIS Research Corporation, 1995), p. 9, cited in Brian L. Hollandsworth, “Personnel Replacement Operations during Operations Desert Storm and Desert Shield” Master’s Thesis (Ft. Leavenworth, KS: U.S. Army Command and General Staff College, 2015), p. 15

[4] Richard M. Swain, “Lucky War”: Third Army in Desert Storm (Ft. Leavenworth, KS: U.S. Army Command and General Staff College Press, 1994)

[5] Bob Woodward, The Commanders (New York: Simon and Schuster, 1991)

[6] Swain, “Lucky War”, p. 205

[7] Weiser, “Computer Simulations Attempting to Predict the Price of Victory”

[8] “Potential War Casualties Put at 100,000,” Reuters

[9] Barry R. Posen, “Political Objectives and Military Options in the Persian Gulf,” Defense and Arms Control Studies Working Paper, Cambridge, MA: Massachusetts Institute of Technology, November 1990)

[10] Joshua M. Epstein, “War with Iraq: What Price Victory?” Briefing Paper, Brookings Institution, December 1990, cited in Michael O’Hanlon, “Estimating Casualties in a War to Overthrow Saddam,” Orbis, Winter 2003; Weiser, “Computer Simulations Attempting to Predict the Price of Victory”

[11] John. J. Mearshimer, “A War the U.S. Can Win—Decisively,” Chicago Tribune, 15 January 1991

[12] Mike Royko, “Most Experts Really Blew It This Time,” Chicago Tribune, 28 February 1991

[13] Paul K. Davis and Donald Blumenthal, “The Base of Sand Problem: A White Paper on the State of Military Combat Modeling” (Santa Monica, CA: RAND, 1991)

Assessing the TNDA 1990-91 Gulf War Forecast

Map of ground operations of Operation Desert Storm starting invasion February 24-28th 1991. Shows allied and Iraqi forces. Special arrows indicate the American 101st Airborne division moved by air and where the French 6st light division and American 3rd Armored Cavalry Regiment provided security. Image created by Jeff Dahl and reposted under the terms of the GNU Free Documentation License, Version 1.2.

[NOTE: This post has been edited to more accurately characterize Trevor Dupuy’s public comments on TNDA’s estimates.]

Operation DESERT STORM began on 17 January 1991 with an extended aerial campaign that lasted 38 days. Ground combat operations were initiated on 24 February and concluded after four days and four hours, with U.S. and Coalition forces having routed the Iraqi Army in Kuwait and in position to annihilate surviving elements rapidly retreating northward. According to official accounting, U.S. forces suffered 148 killed in action and 467 wounded in action, for a total of 614 combat casualties. An additional 235 were killed in non-hostile circumstances.[1]

In retrospect, TNDA’s casualty forecasts turned out to be high, with the actual number of casualties falling below the lowest +/- 50% range of estimates. Forecasts, of course, are sensitive to the initial assumptions they are based upon. In public comments made after the air campaign had started but before the ground phase began, Trevor Dupuy forthrightly stated that TNDA’s estimates were likely to be too high.[2]

In a post-mortem on the forecast in March 1991, Dupuy identified three factors which TNDA’s estimates miscalculated:

  • an underestimation of the effects of the air campaign on Iraqi ground forces;
  • the apparent surprise of Iraqi forces; and
  • an underestimation of the combat effectiveness superiority of U.S. and Coalition forces.[3]

There were also factors that influenced the outcome that TNDA could not have known beforehand. Its estimates were based on an Iraqi Army force of 480,000, a figure derived from open source reports available at the time. However, the U.S. Air Force’s 1993 Gulf War Air Power Survey, using intelligence collected from U.S. government sources, calculated that there were only 336,000 Iraqi Army troops in and near Kuwait in January 1991 (out of a nominal 540,000) due to unit undermanning and troops on leave. The extended air campaign led a further 25-30% to desert and inflicted about 10% casualties, leaving only 200,000-220,000 depleted and demoralized Iraqi troops to face the U.S. and Coalition ground offensive.[4].

TNDA also underestimated the number of U.S. and Coalition ground troops, crediting them with a total of 435,000, when the actual number was approximately 540,000.[5] Instead of the Iraqi Army slightly outnumbering its opponents in Kuwait as TNDA approximated (480,000 to 435,000), U.S. and Coalition forces probably possessed a manpower advantage approaching 2 to 1 or more at the outset of the ground campaign.

There were some aspects of TNDA’s estimate that were remarkably accurate. Although no one foresaw the 38-day air campaign or the four-day ground battle, TNDA did come quite close to anticipating the overall duration of 42 days.

DESERT STORM as planned and executed also bore a striking resemblance to TNDA’s recommended course of action. The opening air campaign, followed by the “left hook” into the western desert by armored and airmobile forces, coupled with holding attacks and penetration of the Iraqi lines on the Kuwaiti-Saudi border were much like a combination of TNDA’s “Colorado Springs,” “Leavenworth,” and “Siege” scenarios. The only substantive difference was the absence of border raids and the use of U.S. airborne/airmobile forces to extend the depth of the “left hook” rather than seal off Kuwait from Iraq. The extended air campaign served much the same intent as TNDA’s “Siege” concept. TNDA even anticipated the potential benefit of the unprecedented effectiveness of the DESERT STORM aerial attack.

How effective “Colorado Springs” will be in damaging and destroying the military effectiveness of the Iraqi ground forces is debatable….On the other hand, the circumstances of this operation are different from past efforts of air forces to “go it alone.” The terrain and vegetation (or lack thereof) favor air attacks to an exceptional degree. And the air forces will be operating with weapons of hitherto unsuspected accuracy and effectiveness against fortified targets. Given these new circumstances, and considering recent historical examples in the 1967 and 1973 Arab-Israeli Wars, the possibility that airpower alone can cause such devastation, destruction, and demoralization as to destroy totally the effectiveness of the Iraqi ground forces cannot be ignored. [6]

In actuality, the U.S. Central Command air planners specifically targeted Saddam’s government in the belief that air power alone might force regime change, which would lead the Iraqi Army to withdraw from Kuwait. Another objective of the air campaign was to reduce the effectiveness of the Iraqi Army by 50% before initiating the ground offensive.[7]

Dupuy and his TNDA colleagues did anticipate that a combination of extended siege-like assault on Iraqi forces in Kuwait could enable the execution of a quick ground attack coup de grace with minimized losses.

The potential of success for such an operation, in the wake of both air and ground efforts made to reduce the Iraqi capacity for offensive along the lines of either Operation “Leavenworth’…or the more elaborate and somewhat riskier “RazzleDazzle”…would produce significant results within a short time. In such a case, losses for these follow-on ground operations would almost certainly be lower than if they had been launched shortly after the war began.[8]

Unfortunately, TNDA did not hazard a casualty estimate for a potential “Colorado Springs/ Siege/Leavenworth/RazzleDazzle” combination scenario, a forecast for which might very well have come closer to the actual outcome.

Dupuy took quite a risk in making such a prominently public forecast, opening his theories and methodology to criticism and judgement. In my next post, I will examine how it stacked up with other predictions and estimates made at the time.

NOTES

[1] Nese F. DeBruyne and Anne Leland, “American War and Military Operations Casualties: Lists and Statistics,” (Washington, D.C.: Congressional Research Service, 2 January 2015), pp. 3, 11

[2] Christopher A. Lawrence, America’s Modern Wars: Understanding Iraq, Afghanistan and Vietnam (Philadelphia, PA: Casemate, 2015) p. 52

[3] Trevor N. Dupuy, “Report on Pre-War Forecasting For Information and Comment: Accuracy of Pre-Kuwait War Forecasts by T.N. Dupuy and HERO-TNDA,” 18 March, 1991. This was published in the April 1991 edition of the online wargaming “fanzine” Simulations Online. The post-mortem also included a revised TNDM casualty calculation for U.S. forces in the ground war phase, using the revised assumptions, of 70 killed and 417 wounded, for a total of 496 casualties. The details used in this revised calculation were not provided in the post-mortem report, so its veracity cannot be currently assessed.

[4] Thomas A. Keaney and Eliot A. Cohen, Gulf War Airpower Survey Summary Report (Washington, D.C.: U.S. Department of the Air Force, 1993), pp. 7, 9-10, 107

[5] Keaney and Cohen, Gulf War Airpower Survey Summary Report, p. 7

[6] Trevor N. Dupuy, Curt Johnson, David L. Bongard, Arnold C. Dupuy, How To Defeat Saddam Hussein: Scenarios and Strategies for the Gulf War (New York: Warner Books, 1991), p. 58

[7] Gulf War Airpower Survey, Vol. I: Planning and Command and Control, Pt. 1 (Washington, D.C.: U.S. Department of the Air Force, 1993), pp. 157, 162-165

[8] Dupuy, et al, How To Defeat Saddam Hussein, p. 114