Tag human factors

The Lanchester Equations and Historical Warfare

Allied force dispositions at the Battle of Anzio, on 1 February 1944. [U.S. Army/Wikipedia]

[The article below is reprinted from History, Numbers And War: A HERO Journal, Vol. 1, No. 1, Spring 1977, pp. 34-52]

The Lanchester Equations and Historical Warfare: An Analysis of Sixty World War II Land Engagements

By Janice B. Fain

Background and Objectives

The method by which combat losses are computed is one of the most critical parts of any combat model. The Lanchester equations, which state that a unit’s combat losses depend on the size of its opponent, are widely used for this purpose.

In addition to their use in complex dynamic simulations of warfare, the Lanchester equations have also sewed as simple mathematical models. In fact, during the last decade or so there has been an explosion of theoretical developments based on them. By now their variations and modifications are numerous, and “Lanchester theory” has become almost a separate branch of applied mathematics. However, compared with the effort devoted to theoretical developments, there has been relatively little empirical testing of the basic thesis that combat losses are related to force sizes.

One of the first empirical studies of the Lanchester equations was Engel’s classic work on the Iwo Jima campaign in which he found a reasonable fit between computed and actual U.S. casualties (Note 1). Later studies were somewhat less supportive (Notes 2 and 3), but an investigation of Korean war battles showed that, when the simulated combat units were constrained to follow the tactics of their historical counterparts, casualties during combat could be predicted to within 1 to 13 percent (Note 4).

Taken together, these various studies suggest that, while the Lanchester equations may be poor descriptors of large battles extending over periods during which the forces were not constantly in combat, they may be adequate for predicting losses while the forces are actually engaged in fighting. The purpose of the work reported here is to investigate 60 carefully selected World War II engagements. Since the durations of these battles were short (typically two to three days), it was expected that the Lanchester equations would show a closer fit than was found in studies of larger battles. In particular, one of the objectives was to repeat, in part, Willard’s work on battles of the historical past (Note 3).

The Data Base

Probably the most nearly complete and accurate collection of combat data is the data on World War II compiled by the Historical Evaluation and Research Organization (HERO). From their data HERO analysts selected, for quantitative analysis, the following 60 engagements from four major Italian campaigns:

Salerno, 9-18 Sep 1943, 9 engagements

Volturno, 12 Oct-8 Dec 1943, 20 engagements

Anzio, 22 Jan-29 Feb 1944, 11 engagements

Rome, 14 May-4 June 1944, 20 engagements

The complete data base is described in a HERO report (Note 5). The work described here is not the first analysis of these data. Statistical analyses of weapon effectiveness and the testing of a combat model (the Quantified Judgment Method, QJM) have been carried out (Note 6). The work discussed here examines these engagements from the viewpoint of the Lanchester equations to consider the question: “Are casualties during combat related to the numbers of men in the opposing forces?”

The variables chosen for this analysis are shown in Table 1. The “winners” of the engagements were specified by HERO on the basis of casualties suffered, distance advanced, and subjective estimates of the percentage of the commander’s objective achieved. Variable 12, the Combat Power Ratio, is based on the Operational Lethality Indices (OLI) of the units (Note 7).
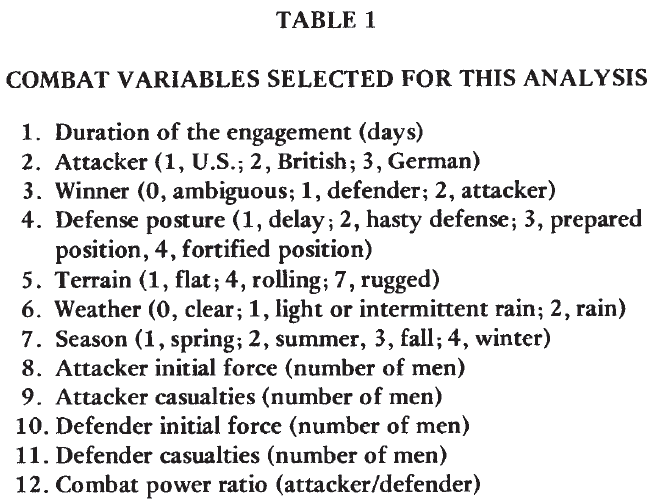
The general characteristics of the engagements are briefly described. Of the 60, there were 19 attacks by British forces, 28 by U.S. forces, and 13 by German forces. The attacker was successful in 34 cases; the defender, in 23; and the outcomes of 3 were ambiguous. With respect to terrain, 19 engagements occurred in flat terrain; 24 in rolling, or intermediate, terrain; and 17 in rugged, or difficult, terrain. Clear weather prevailed in 40 cases; 13 engagements were fought in light or intermittent rain; and 7 in medium or heavy rain. There were 28 spring and summer engagements and 32 fall and winter engagements.

Comparison of World War II Engagements With Historical Battles

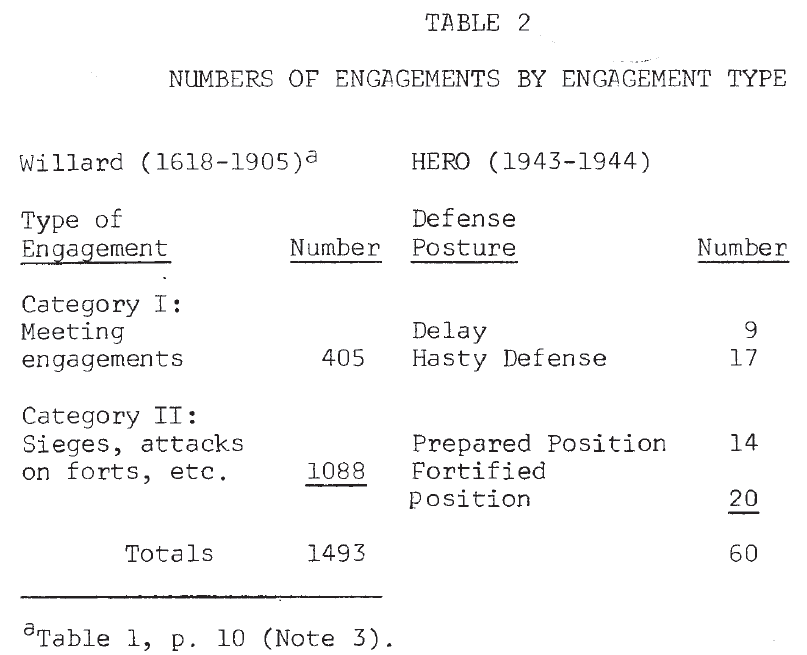
Since one purpose of this work is to repeat, in part, Willard’s analysis, comparison of these World War II engagements with the historical battles (1618-1905) studied by him will be useful. Table 2 shows a comparison of the distribution of battles by type. Willard’s cases were divided into two categories: I. meeting engagements, and II. sieges, attacks on forts, and similar operations. HERO’s World War II engagements were divided into four types based on the posture of the defender: 1. delay, 2. hasty defense, 3. prepared position, and 4. fortified position. If postures 1 and 2 are considered very roughly equivalent to Willard’s category I, then in both data sets the division into the two gross categories is approximately even.
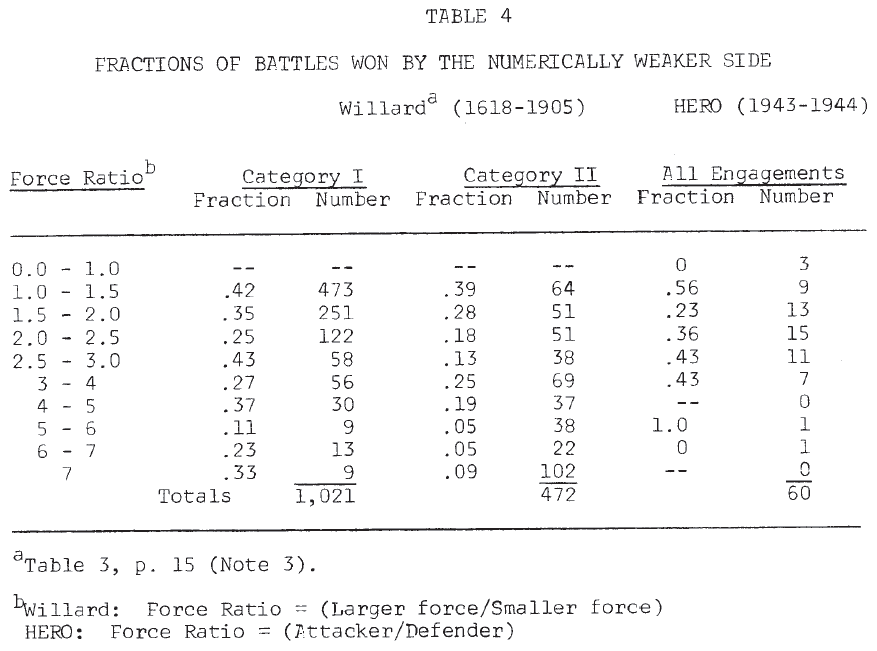
The distribution of engagements across force ratios, given in Table 3, indicated some differences. Willard’s engagements tend to cluster at the lower end of the scale (1-2) and at the higher end (4 and above), while the majority of the World War II engagements were found in mid-range (1.5 – 4) (Note 8). The frequency with which the numerically inferior force achieved victory is shown in Table 4. It is seen that in neither data set are force ratios good predictors of success in battle (Note 9).
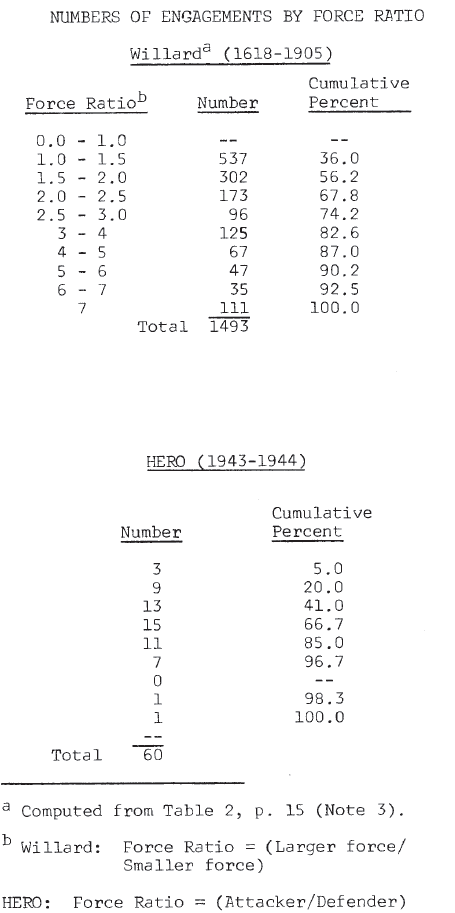
Table 3.

Results of the Analysis Willard’s Correlation Analysis

There are two forms of the Lanchester equations. One represents the case in which firing units on both sides know the locations of their opponents and can shift their fire to a new target when a “kill” is achieved. This leads to the “square” law where the loss rate is proportional to the opponent’s size. The second form represents that situation in which only the general location of the opponent is known. This leads to the “linear” law in which the loss rate is proportional to the product of both force sizes.

As Willard points out, large battles are made up of many smaller fights. Some of these obey one law while others obey the other, so that the overall result should be a combination of the two. Starting with a general formulation of Lanchester’s equations, where g is the exponent of the target unit’s size (that is, g is 0 for the square law and 1 for the linear law), he derives the following linear equation:

log (nc/mc) = log E + g log (mo/no) (1)

where nc and mc are the casualties, E is related to the exchange ratio, and mo and no are the initial force sizes. Linear regression produces a value for g. However, instead of lying between 0 and 1, as expected, the) g‘s range from -.27 to -.87, with the majority lying around -.5. (Willard obtains several values for g by dividing his data base in various ways—by force ratio, by casualty ratio, by historical period, and so forth.) A negative g value is unpleasant. As Willard notes:

Military theorists should be disconcerted to find g < 0, for in this range the results seem to imply that if the Lanchester formulation is valid, the casualty-producing power of troops increases as they suffer casualties (Note 3).

From his results, Willard concludes that his analysis does not justify the use of Lanchester equations in large-scale situations (Note 10).

Analysis of the World War II Engagements

Willard’s computations were repeated for the HERO data set. For these engagements, regression produced a value of -.594 for g (Note 11), in striking agreement with Willard’s results. Following his reasoning would lead to the conclusion that either the Lanchester equations do not represent these engagements, or that the casualty producing power of forces increases as their size decreases.

However, since the Lanchester equations are so convenient analytically and their use is so widespread, it appeared worthwhile to reconsider this conclusion. In deriving equation (1), Willard used binomial expansions in which he retained only the leading terms. It seemed possible that the poor results might he due, in part, to this approximation. If the first two terms of these expansions are retained, the following equation results:

log (nc/mc) = log E + log (Mo-mc)/(no-nc) (2)

Repeating this regression on the basis of this equation leads to g = -.413 (Note 12), hardly an improvement over the initial results.

A second attempt was made to salvage this approach. Starting with raw OLI scores (Note 7), HERO analysts have computed “combat potentials” for both sides in these engagements, taking into account the operational factors of posture, vulnerability, and mobility; environmental factors like weather, season, and terrain; and (when the record warrants) psychological factors like troop training, morale, and the quality of leadership. Replacing the factor (mo/no) in Equation (1) by the combat power ratio produces the result) g = .466 (Note 13).

While this is an apparent improvement in the value of g, it is achieved at the expense of somewhat distorting the Lanchester concept. It does preserve the functional form of the equations, but it requires a somewhat strange definition of “killing rates.”

Analysis Based on the Differential Lanchester Equations

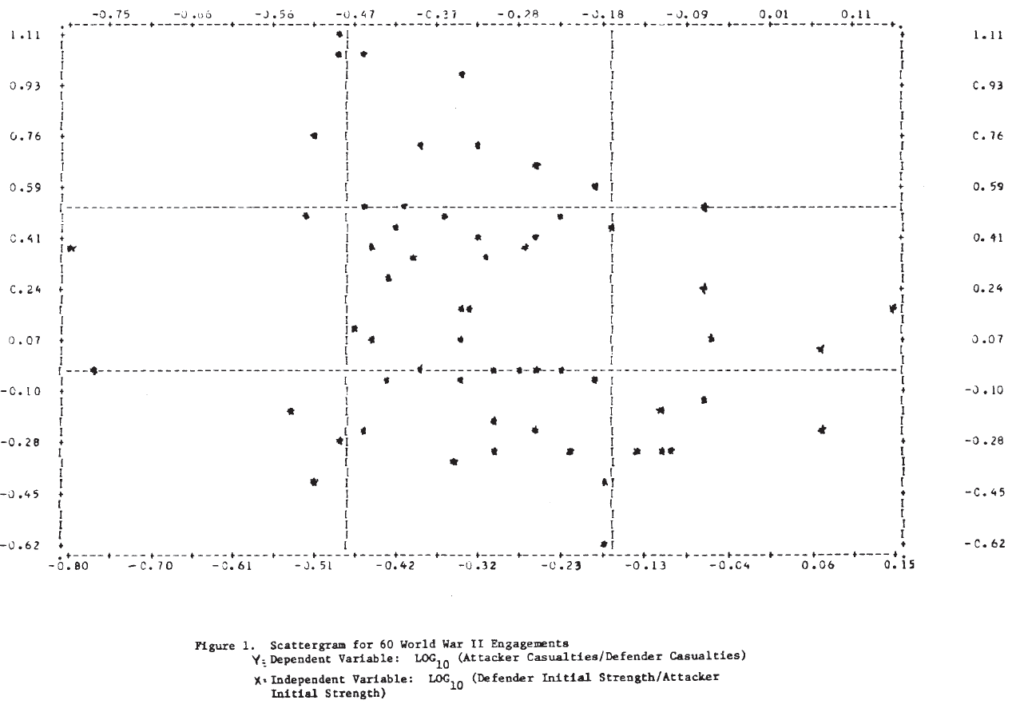
Analysis of the type carried out by Willard appears to produce very poor results for these World War II engagements. Part of the reason for this is apparent from Figure 1, which shows the scatterplot of the dependent variable, log (nc/mc), against the independent variable, log (mo/no). It is clear that no straight line will fit these data very well, and one with a positive slope would not be much worse than the “best” line found by regression. To expect the exponent to account for the wide variation in these data seems unreasonable.
Here, a simpler approach will be taken. Rather than use the data to attempt to discriminate directly between the square and the linear laws, they will be used to estimate linear coefficients under each assumption in turn, starting with the differential formulation rather than the integrated equations used by Willard.

In their simplest differential form, the Lanchester equations may be written;

Square Law; dA/dt = -kdD and dD/dt = kaA (3)

Linear law: dA/dt = -k’dAD and dD/dt = k’aAD (4)

where

A(D) is the size of the attacker (defender)

dA/dt (dD/dt) is the attacker’s (defender’s) loss rate,

ka, k’a (kd, k’d) are the attacker’s (defender’s) killing rates

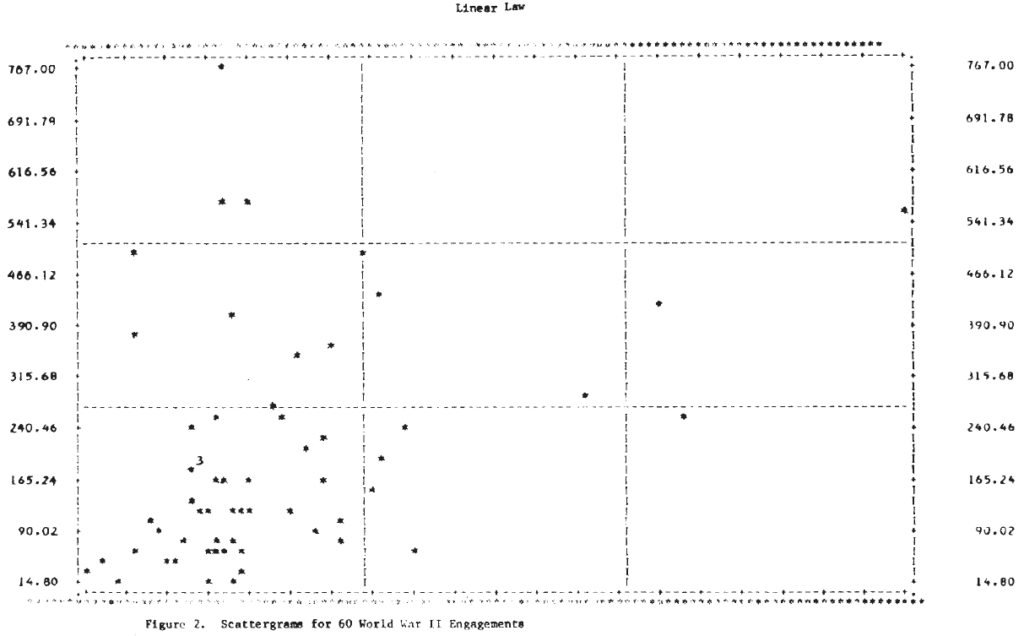
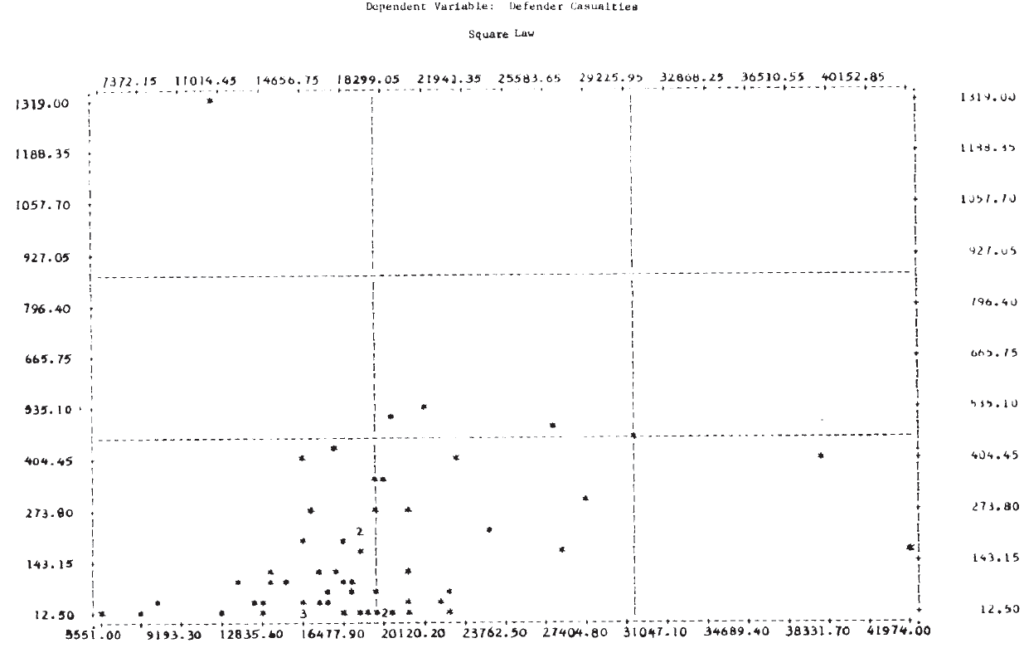
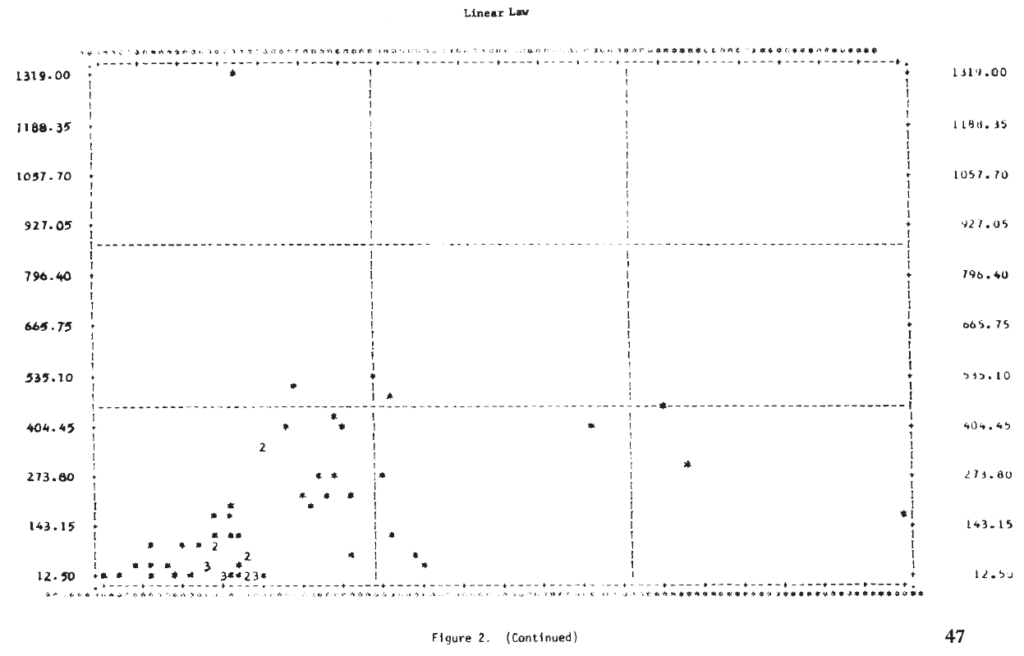
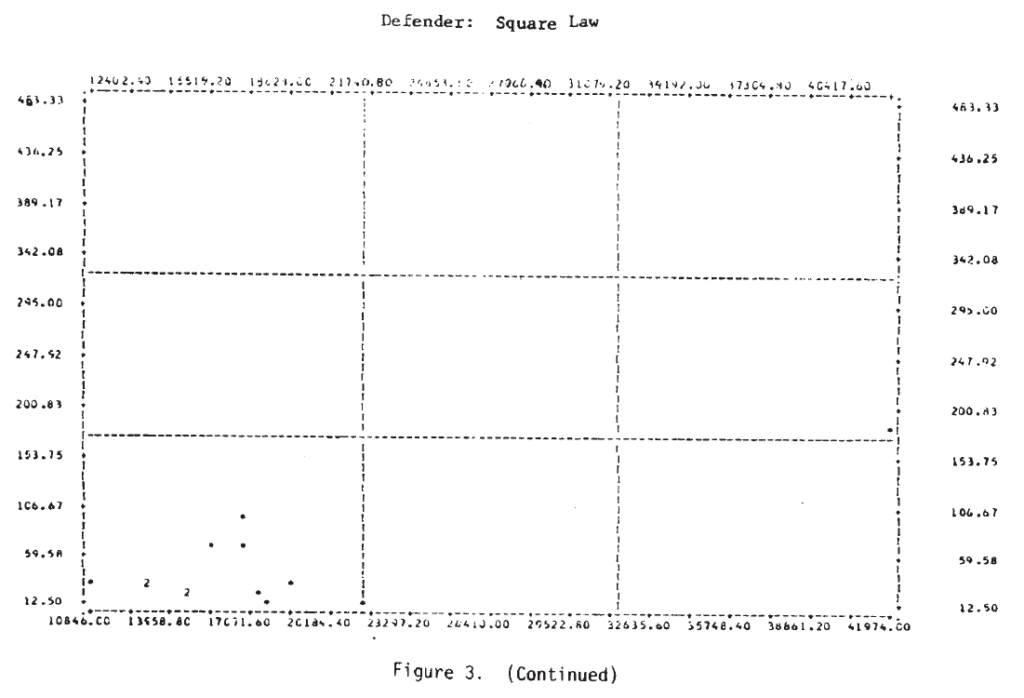
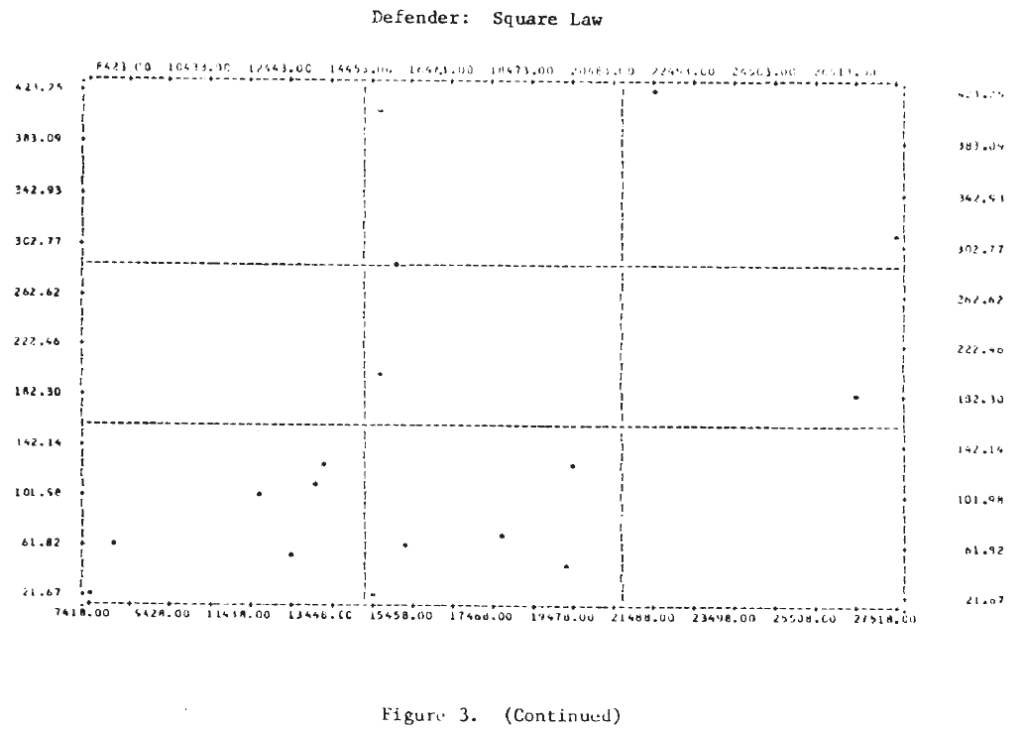
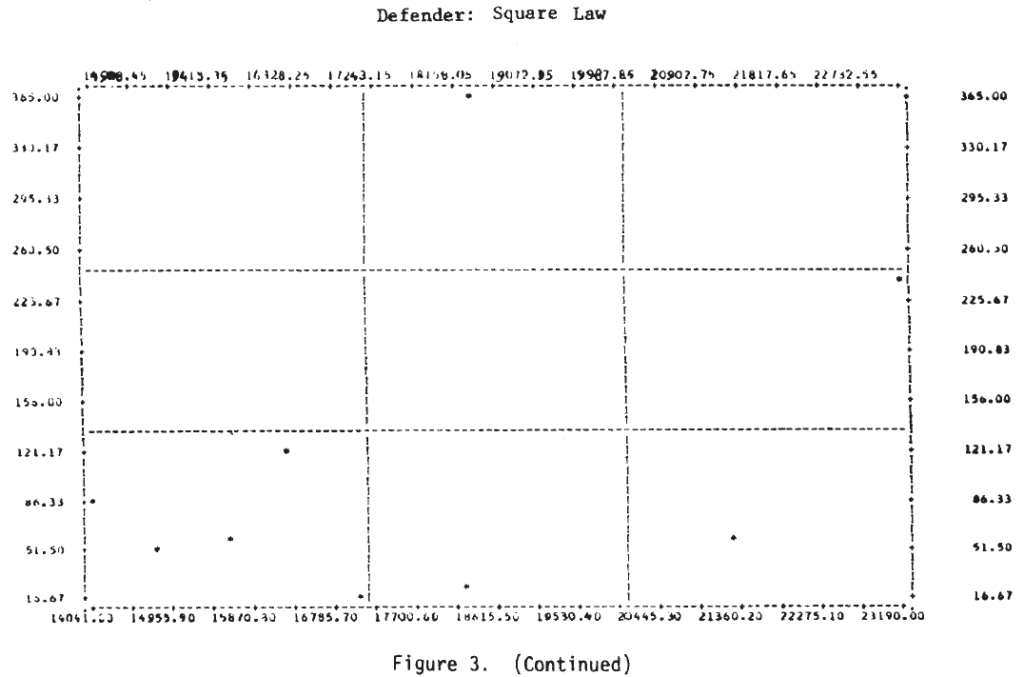
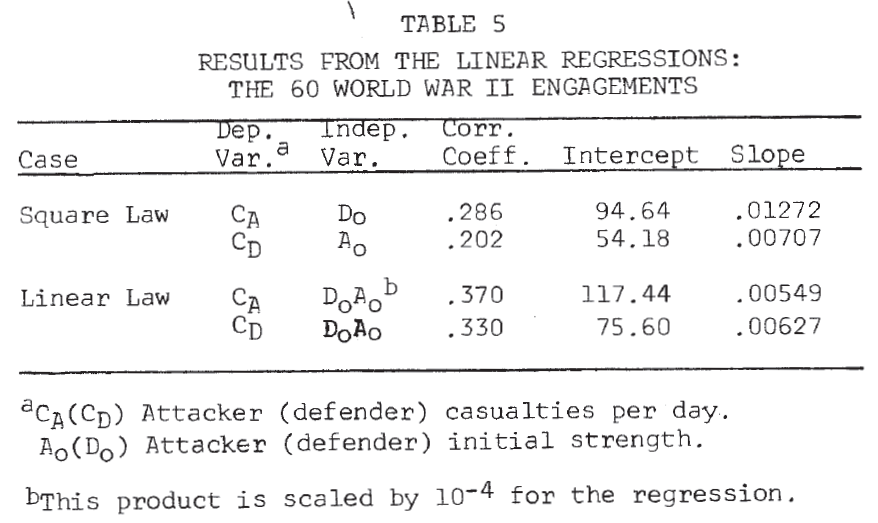
For this analysis, the day is taken as the basic time unit, and the loss rate per day is approximated by the casualties per day. Results of the linear regressions are given in Table 5. No conclusions should be drawn from the fact that the correlation coefficients are higher in the linear law case since this is expected for purely technical reasons (Note 14). A better picture of the relationships is again provided by the scatterplots in Figure 2. It is clear from these plots that, as in the case of the logarithmic forms, a single straight line will not fit the entire set of 60 engagements for either of the dependent variables.
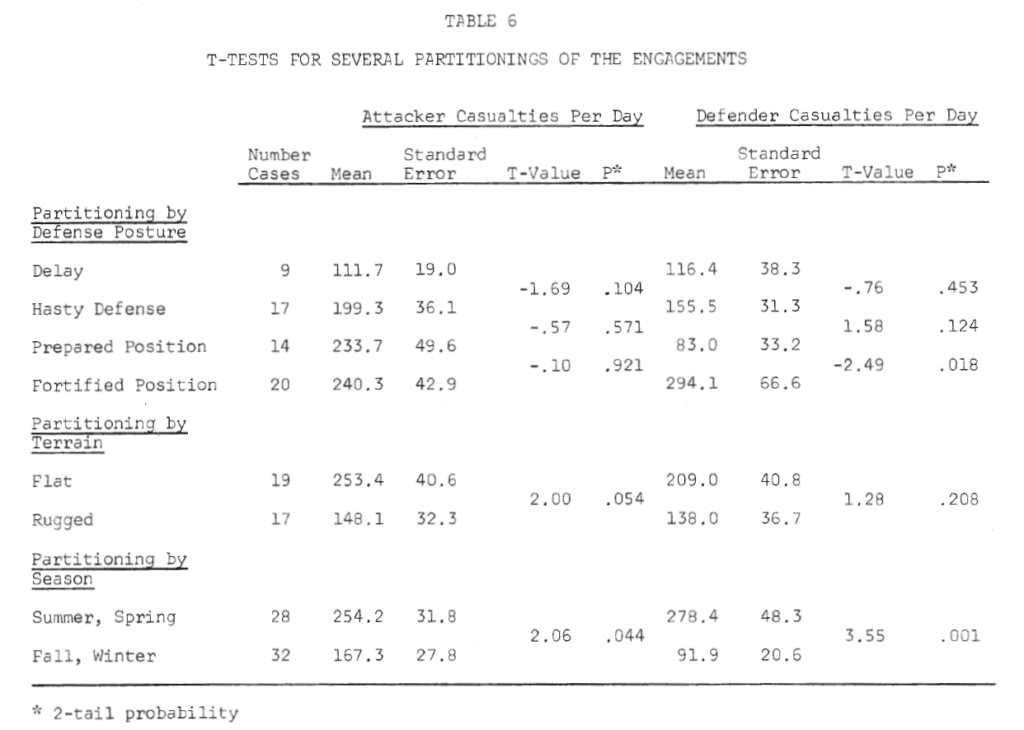
To investigate ways in which the data set might profitably be subdivided for analysis, T-tests of the means of the dependent variable were made for several partitionings of the data set. The results, shown in Table 6, suggest that dividing the engagements by defense posture might prove worthwhile.
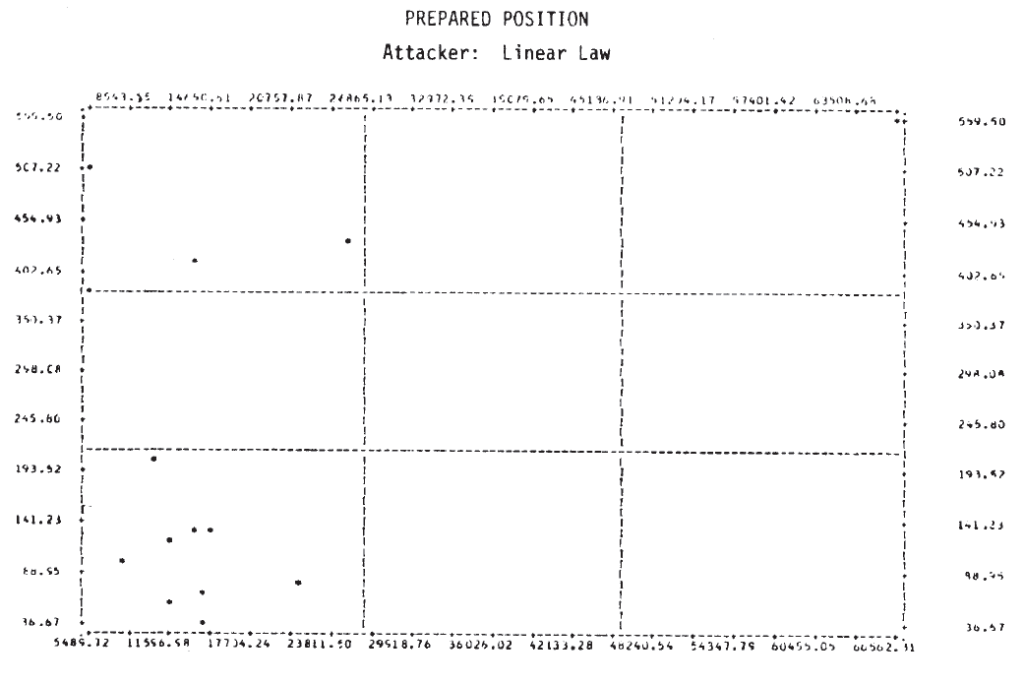
Results of the linear regressions by defense posture are shown in Table 7. For each posture, the equation that seemed to give a better fit to the data is underlined (Note 15). From this table, the following very tentative conclusions might be drawn:

  • In an attack on a fortified position, the attacker suffers casualties by the square law; the defender suffers casualties by the linear law. That is, the defender is aware of the attacker’s position, while the attacker knows only the general location of the defender. (This is similar to Deitchman’s guerrilla model. Note 16).
  • This situation is apparently reversed in the cases of attacks on prepared positions and hasty defenses.
  • Delaying situations seem to be treated better by the square law for both attacker and defender.
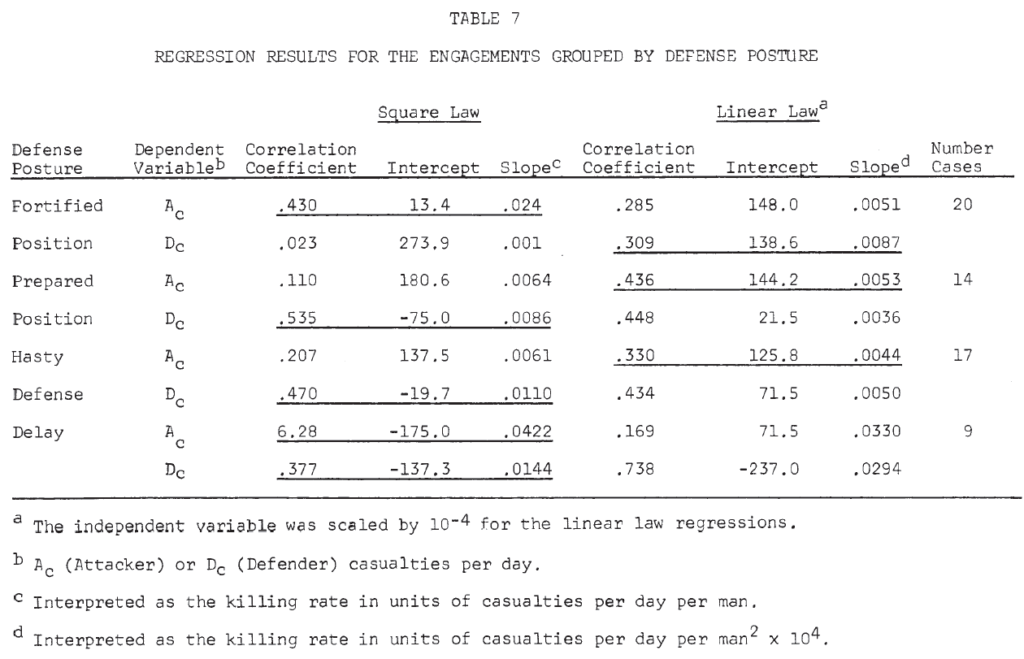
Table 8 summarizes the killing rates by defense posture. The defender has a much higher killing rate than the attacker (almost 3 to 1) in a fortified position. In a prepared position and hasty defense, the attacker appears to have the advantage. However, in a delaying action, the defender’s killing rate is again greater than the attacker’s (Note 17).
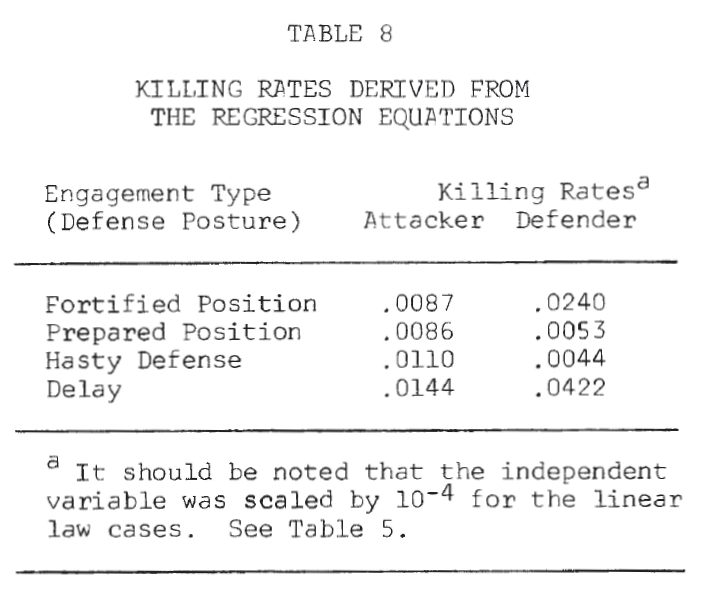
Figure 3 shows the scatterplots for these cases. Examination of these plots suggests that a tentative answer to the study question posed above might be: “Yes, casualties do appear to be related to the force sizes, but the relationship may not be a simple linear one.”
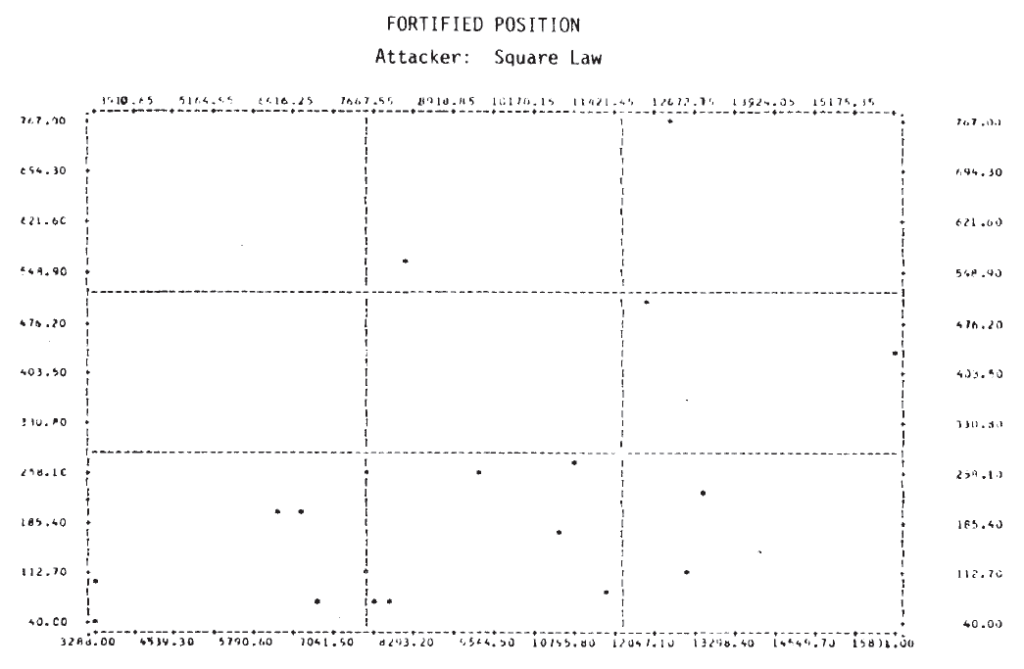
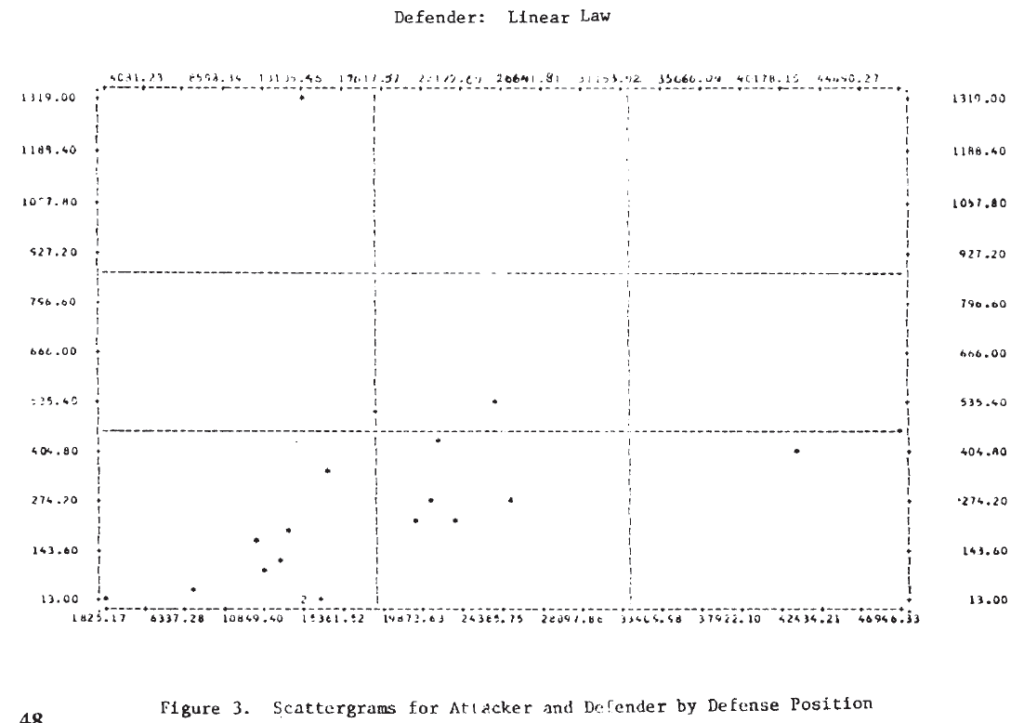
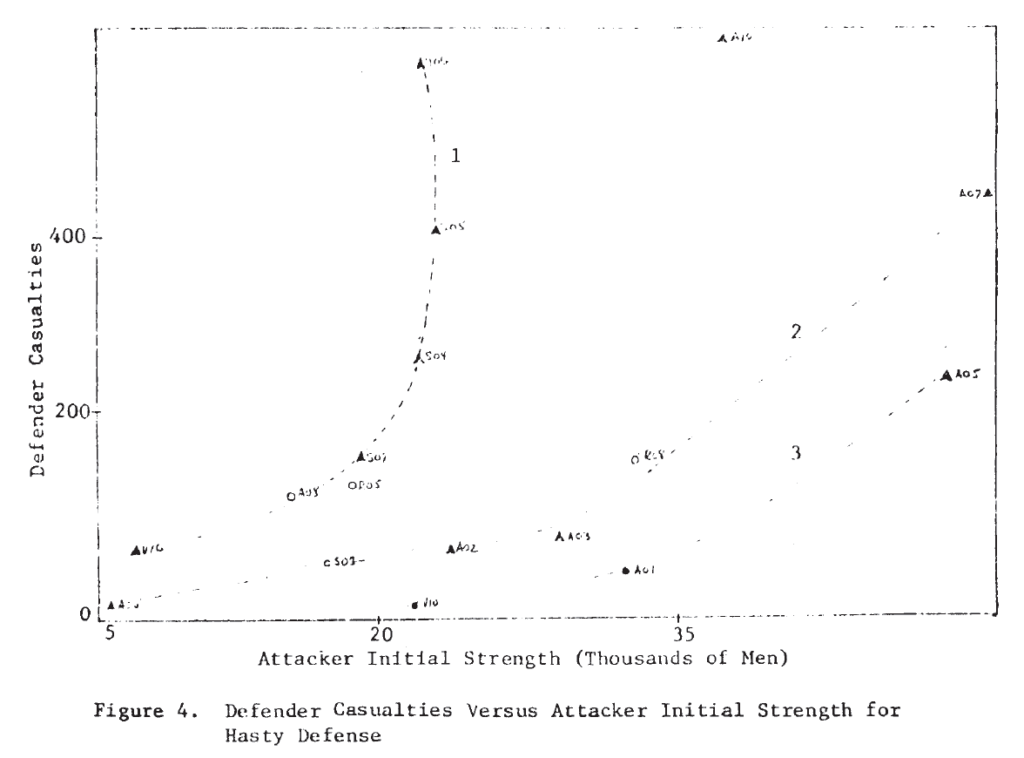
In several of these plots it appears that two or more functional forms may be involved. Consider, for example, the defender‘s casualties as a function of the attacker’s initial strength in the case of a hasty defense. This plot is repeated in Figure 4, where the points appear to fit the curves sketched there. It would appear that there are at least two, possibly three, separate relationships. Also on that plot, the individual engagements have been identified, and it is interesting to note that on the curve marked (1), five of the seven attacks were made by Germans—four of them from the Salerno campaign. It would appear from this that German attacks are associated with higher than average defender casualties for the attacking force size. Since there are so few data points, this cannot be more than a hint or interesting suggestion.

Future Research

This work suggests two conclusions that might have an impact on future lines of research on combat dynamics:

  • Tactics appear to be an important determinant of combat results. This conclusion, in itself, does not appear startling, at least not to the military. However, it does not always seem to have been the case that tactical questions have been considered seriously by analysts in their studies of the effects of varying force levels and force mixes.
  • Historical data of this type offer rich opportunities for studying the effects of tactics. For example, consideration of the narrative accounts of these battles might permit re-coding the engagements into a larger, more sensitive set of engagement categories. (It would, of course, then be highly desirable to add more engagements to the data set.)

While predictions of the future are always dangerous, I would nevertheless like to suggest what appears to be a possible trend. While military analysis of the past two decades has focused almost exclusively on the hardware of weapons systems, at least part of our future analysis will be devoted to the more behavioral aspects of combat.

Janice Bloom Fain, a Senior Associate of CACI, lnc., is a physicist whose special interests are in the applications of computer simulation techniques to industrial and military operations; she is the author of numerous reports and articles in this field. This paper was presented by Dr. Fain at the Military Operations Research Symposium at Fort Eustis, Virginia.

NOTES

[1.] J. H. Engel, “A Verification of Lanchester’s Law,” Operations Research 2, 163-171 (1954).

[2.] For example, see R. L. Helmbold, “Some Observations on the Use of Lanchester’s Theory for Prediction,” Operations Research 12, 778-781 (1964); H. K. Weiss, “Lanchester-Type Models of Warfare,” Proceedings of the First International Conference on Operational Research, 82-98, ORSA (1957); H. K. Weiss, “Combat Models and Historical Data; The U.S. Civil War,” Operations Research 14, 750-790 (1966).

[3.] D. Willard, “Lanchester as a Force in History: An Analysis of Land Battles of the Years 1618-1905,” RAC-TD-74, Research Analysis Corporation (1962). what appears to be a possible trend. While military analysis of the past two decades has focused almost exclusively on the hardware of weapons systems, at least part of our future analysis will be devoted to the more behavioral aspects of combat.

[4.] The method of computing the killing rates forced a fit at the beginning and end of the battles. See W. Fain, J. B. Fain, L. Feldman, and S. Simon, “Validation of Combat Models Against Historical Data,” Professional Paper No. 27, Center for Naval Analyses, Arlington, Virginia (1970).

[5.] HERO, “A Study of the Relationship of Tactical Air Support Operations to Land Combat, Appendix B, Historical Data Base.” Historical Evaluation and Research Organization, report prepared for the Defense Operational Analysis Establishment, U.K.T.S.D., Contract D-4052 (1971).

[6.] T. N. Dupuy, The Quantified Judgment Method of Analysis of Historical Combat Data, HERO Monograph, (January 1973); HERO, “Statistical Inference in Analysis in Combat,” Annex F, Historical Data Research on Tactical Air Operations, prepared for Headquarters USAF, Assistant Chief of Staff for Studies and Analysis, Contract No. F-44620-70-C-0058 (1972).

[7.] The Operational Lethality Index (OLI) is a measure of weapon effectiveness developed by HERO.

[8.] Since Willard’s data did not indicate which side was the attacker, his force ratio is defined to be (larger force/smaller force). The HERO force ratio is (attacker/defender).

[9.] Since the criteria for success may have been rather different for the two sets of battles, this comparison may not be very meaningful.

[10.] This work includes more complex analysis in which the possibility that the two forces may be engaging in different types of combat is considered, leading to the use of two exponents rather than the single one, Stochastic combat processes are also treated.

[11.] Correlation coefficient = -.262;

Intercept = .00115; slope = -.594.

[12.] Correlation coefficient = -.184;

Intercept = .0539; slope = -,413.

[13.] Correlation coefficient = .303;

Intercept = -.638; slope = .466.

[14.] Correlation coefficients for the linear law are inflated with respect to the square law since the independent variable is a product of force sizes and, thus, has a higher variance than the single force size unit in the square law case.

[15.] This is a subjective judgment based on the following considerations Since the correlation coefficient is inflated for the linear law, when it is lower the square law case is chosen. When the linear law correlation coefficient is higher, the case with the intercept closer to 0 is chosen.

[16.] S. J. Deitchman, “A Lanchester Model of Guerrilla Warfare,” Operations Research 10, 818-812 (1962).

[17.] As pointed out by Mr. Alan Washburn, who prepared a critique on this paper, when comparing numerical values of the square law and linear law killing rates, the differences in units must be considered. (See footnotes to Table 7).

What Is A Breakpoint?

French retreat from Russia in 1812 by Illarion Mikhailovich Pryanishnikov (1812) [Wikipedia]

After discussing with Chris the series of recent posts on the subject of breakpoints, it seemed appropriate to provide a better definition of exactly what a breakpoint is.

Dorothy Kneeland Clark was the first to define the notion of a breakpoint in her study, Casualties as a Measure of the Loss of Combat Effectiveness of an Infantry Battalion (Operations Research Office, The Johns Hopkins University: Baltimore, 1954). She found it was not quite as clear-cut as it seemed and the working definition she arrived at was based on discussions and the specific combat outcomes she found in her data set [pp 9-12].

DETERMINATION OF BREAKPOINT

The following definitions were developed out of many discussions. A unit is considered to have lost its combat effectiveness when it is unable to carry out its mission. The onset of this inability constitutes a breakpoint. A unit’s mission is the objective assigned in the current operations order or any other instructional directive, written or verbal. The objective may be, for example, to attack in order to take certain positions, or to defend certain positions. 

How does one determine when a unit is unable to carry out its mission? The obvious indication is a change in operational directive: the unit is ordered to stop short of its original goal, to hold instead of attack, to withdraw instead of hold. But one or more extraneous elements may cause the issue of such orders: 

(1) Some other unit taking part in the operation may have lost its combat effectiveness, and its predicament may force changes, in the tactical plan. For example the inability of one infantry battalion to take a hill may require that the two adjoining battalions be stopped to prevent exposing their flanks by advancing beyond it. 

(2) A unit may have been assigned an objective on the basis of a G-2 estimate of enemy weakness which, as the action proceeds, proves to have been over-optimistic. The operations plan may, therefore, be revised before the unit has carried out its orders to the point of losing combat effectiveness. 

(3) The commanding officer, for reasons quite apart from the tactical attrition, may change his operations plan. For instance, General Ridgway in May 1951 was obliged to cancel his plans for a major offensive north of the 38th parallel in Korea in obedience to top level orders dictated by political considerations. 

(4) Even if the supposed combat effectiveness of the unit is the determining factor in the issuance of a revised operations order, a serious difficulty in evaluating the situation remains. The commanding officer’s decision is necessarily made on the basis of information available to him plus his estimate of his unit’s capacities. Either or both of these bases may be faulty. The order may belatedly recognize a collapse which has in factor occurred hours earlier, or a commanding officer may withdraw a unit which could hold for a much longer time. 

It was usually not hard to discover when changes in orders resulted from conditions such as the first three listed above, but it proved extremely difficult to distinguish between revised orders based on a correct appraisal of the unit’s combat effectiveness and those issued in error. It was concluded that the formal order for a change in mission cannot be taken as a definitive indication of the breakpoint of a unit. It seemed necessary to go one step farther and search the records to learn what a given battalion did regardless of provisions in formal orders… 

CATEGORIES OF BREAKPOINTS SELECTED 

In the engagements studied the following categories of breakpoint were finally selected: 

Category of Breakpoint 

No. Analyzed 

I. Attack [Symbol] rapid reorganization [Symbol] attack 

9 

II. Attack [Symbol] defense (no longer able to attack without a few days of recuperation and reinforcement 

21 

III. Defense [Symbol] withdrawal by order to a secondary line 

13 

IV. Defense [Symbol] collapse 

5 

Disorganization and panic were taken as unquestionable evidence of loss of combat effectiveness. It appeared, however, that there were distinct degrees of magnitude in these experiences. In addition to the expected breakpoints at attack [Symbol] defense and defense [Symbol] collapse, a further category, I, seemed to be indicated to include situations in which an attacking battalion was ‘pinned down” or forced to withdraw in partial disorder but was able to reorganize in 4 to 24 hours and continue attacking successfully. 

Category II includes (a) situations in which an attacking battalion was ordered into the defensive after severe fighting or temporary panic; (b) situations in which a battalion, after attacking successfully, failed to gain ground although still attempting to advance and was finally ordered into defense, the breakpoint being taken as occurring at the end of successful advance. In other words, the evident inability of the unit to fulfill its mission was used as the criterion for the breakpoint whether orders did or did not recognize its inability. Battalions after experiencing such a breakpoint might be able to recuperate in a few days to the point of renewing successful attack or might be able to continue for some time in defense. 

The sample of breakpoints coming under category IV, defense [Symbol] collapse, proved to be very small (5) and unduly weighted in that four of the examples came from the same engagement. It was, therefore, discarded as probably not representative of the universe of category IV breakpoints,* and another category (III) was added: situations in which battalions on the defense were ordered withdrawn to a quieter sector. Because only those instances were included in which the withdrawal orders appeared to have been dictated by the condition of the unit itself, it is believed that casualty levels for this category can be regarded as but slightly lower than those associated with defense [Symbol] collapse. 

In both categories II and III, “‘defense” represents an active situation in which the enemy is attacking aggressively. 

* It had been expected that breakpoints in this category would be associated with very high losses. Such did not prove to be the case. In whatever way the data were approached, most of the casualty averages were only slightly higher than those associated with category II (attack [Symbol] defense), although the spread in data was wider. It is believed that factors other than casualties, such as bad weather, difficult terrain, and heavy enemy artillery fire undoubtedly played major roles in bringing about the collapse in the four units taking part in the same engagement. Furthermore, the casualty figures for the four units themselves is in question because, as the situation deteriorated, many of the men developed severe cases of trench foot and combat exhaustion, but were not evacuated, as they would have been in a less desperate situation, and did not appear in the casualty records until they had made their way to the rear after their units had collapsed.

In 1987-1988, Trevor Dupuy and colleagues at Data Memory Systems, Inc. (DMSi), Janice Fain, Rich Anderson, Gay Hammerman, and Chuck Hawkins sought to create a broader, more generally applicable definition for breakpoints for the study, Forced Changes of Combat Posture (DMSi, Fairfax, VA, 1988) [pp. I-2-3]

The combat posture of a military force is the immediate intention of its commander and troops toward the opposing enemy force, together with the preparations and deployment to carry out that intention. The chief combat postures are attack, defend, delay, and withdraw.

A change in combat posture (or posture change) is a shift from one posture to another, as, for example, from defend to attack or defend to withdraw. A posture change can be either voluntary or forced. 

A forced posture change (FPC) is a change in combat posture by a military unit that is brought about, directly or indirectly, by enemy action. Forced posture changes are characteristically and almost always changes to a less aggressive posture. The most usual FPCs are from attack to defend and from defend to withdraw (or retrograde movement). A change from withdraw to combat ineffectiveness is also possible. 

Breakpoint is a term sometimes used as synonymous with forced posture change, and sometimes used to mean the collapse of a unit into ineffectiveness or rout. The latter meaning is probably more common in general usage, while forced posture change is the more precise term for the subject of this study. However, for brevity and convenience, and because this study has been known informally since its inception as the “Breakpoints” study, the term breakpoint is sometimes used in this report. When it is used, it is synonymous with forced posture change.

Hopefully this will help clarify the previous discussions of breakpoints on the blog.

Human Factors In Combat: Syrian Strike Edition

Missile fire lit up the Damascus sky last week as the U.S. and allies launched an attack on chemical weapons sites. [Hassan Ammar, AP/USA Today]

Even as pundits and wonks debate the political and strategic impact of the 14 April combined U.S., British, and French cruise missile strike on Assad regime chemical warfare targets in Syria, it has become clear that effort was a notable tactical success.

Despite ample warning that the strike was coming, the Syrian regime’s Russian-made S-200 surface-to-air missile defense system failed to shoot down a single incoming missile. The U.S. Defense Department claimed that all 105 cruise missiles fired struck their targets. It also reported that the Syrians fired 40 interceptor missiles but nearly all launched after the incoming cruise missiles had already struck their targets.

Although cruise missiles are difficult to track and engage even with fully modernized air defense systems, the dismal performance of the Syrian network was a surprise to many analysts given the wary respect paid to it by U.S. military leaders in the recent past. Although the S-200 dates from the 1960s, many surmise an erosion in the combat effectiveness of the personnel manning the system is the real culprit.

[A] lack of training, command and control and other human factors are probably responsible for the failure, analysts said.

“It’s not just about the physical capability of the air defense system,” said David Deptula, a retired, three-star Air Force general. “It’s about the people who are operating the system.”

The Syrian regime has become dependent upon assistance from Russia and Iran to train, equip, and maintain its military forces. Russian forces in Syria have deployed the more sophisticated S-400 air defense system to protect their air and naval bases, which reportedly tracked but did not engage the cruise missile strike. The Assad regime is also believed to field the Russian-made Pantsir missile and air-defense artillery system, but it likely was not deployed near enough to the targeted facilities to help.

Despite the pervasive role technology plays in modern warfare, the human element remains the most important factor in determining combat effectiveness.

Breakpoints in U.S. Army Doctrine

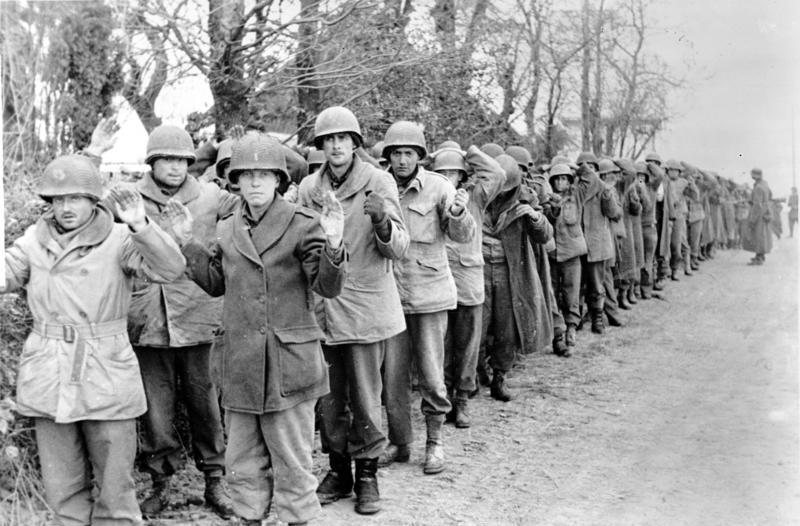
U.S. Army prisoners of war captured by German forces during the Battle of the Bulge in 1944. [Wikipedia]

One of the least studied aspects of combat is battle termination. Why do units in combat stop attacking or defending? Shifts in combat posture (attack, defend, delay, withdrawal) are usually voluntary, directed by a commander, but they can also be involuntary, as a result of direct or indirect enemy action. Why do involuntary changes in combat posture, known as breakpoints, occur?

As Chris pointed out in a previous post, the topic of breakpoints has only been addressed by two known studies since 1954. Most existing military combat models and wargames address breakpoints in at least a cursory way, usually through some calculation based on personnel casualties. Both of the breakpoints studies suggest that involuntary changes in posture are seldom related to casualties alone, however.

Current U.S. Army doctrine addresses changes in combat posture through discussions of culmination points in the attack, and transitions from attack to defense, defense to counterattack, and defense to retrograde. But these all pertain to voluntary changes, not breakpoints.

Army doctrinal literature has little to say about breakpoints, either in the context of friendly forces or potential enemy combatants. The little it does say relates to the effects of fire on enemy forces and is based on personnel and material attrition.

According to ADRP 1-02 Terms and Military Symbols, an enemy combat unit is considered suppressed after suffering 3% personnel casualties or material losses, neutralized by 10% losses, and destroyed upon sustaining 30% losses. The sources and methodology for deriving these figures is unknown, although these specific terms and numbers have been a part of Army doctrine for decades.

The joint U.S. Army and U.S. Marine Corps vision of future land combat foresees battlefields that are highly lethal and demanding on human endurance. How will such a future operational environment affect combat performance? Past experience undoubtedly offers useful insights but there seems to be little interest in seeking out such knowledge.

Trevor Dupuy criticized the U.S. military in the 1980s for its lack of understanding of the phenomenon of suppression and other effects of fire on the battlefield, and its seeming disinterest in studying it. Not much appears to have changed since then.

TDI Friday Read: Links You May Have Missed, 30 March 2018

This week’s list of links is an odds-and-ends assortment.

David Vergun has an interview with General Stephen J. Townshend, commander of the U.S. Army Training and Doctrine Command (TRADOC) on the Army website about the need for smaller, lighter, and faster equipment for future warfare.

Defense News’s apparently inexhaustible Jen Judson details the Army’s newest forthcoming organization, “US Army’s Futures Command sets groundwork for battlefield transformation.”

At West Point’s Modern War Institute, Army Lionel Beehner, Liam Collins, Steve Ferenzi, Robert Person and Aaron Brantly have a very interesting analysis of the contemporary Russian approach to warfare, “Analyzing the Russian Way of War: Evidence from the 2008 Conflict with Georgia.”

Also at the Modern War Institute, Ethan Olberding examines ways to improve the planning skills of the U.S. Army’s junior leaders, “You Can Lead, But Can You Plan? Time to Change the Way We Develop Junior Leaders.”

Kyle Mizokami at Popular Mechanics takes a look at the state of the art in drone defenses, “Watch Microwave and Laser Weapons Knock Drones Out of the Sky.”

Jared Keller at Task & Purpose looks into the Army’s interest in upgunning its medium-weight armored vehicles, “The Army Is Eyeing This Beastly 40mm Cannon For Its Ground Combat Vehicles.”

And finally, MeritTalk, a site focused on U.S. government information technology, has posted a piece, “Pentagon Wants An Early Warning System For Hybrid Warfare,” looking at the Defense Advanced Research Projects Agency’s (DARPA) ambitious Collection and Monitoring via Planning for Active Situational Scenarios (COMPASS) program, which will incorporate AI, game theory, modeling, and estimation technologies to attempt to decipher the often subtle signs that precede a full-scale attack.

Technology And The Human Factor In War

A soldier waves an Israeli flag on the Golan front during the 1973 Yom Kippur War. (IDF Spokesperson’s unit, Jerusalem Report Archives)

[The article below is reprinted from the August 1997 edition of The International TNDM Newsletter.]

Technology and the Human Factor in War
by Trevor N. Dupuy

The Debate

It has become evident to many military theorists that technology has become increasingly important in war. In fact (even though many soldiers would not like to admit it) most such theorists believe that technology has actually reduced the significance of the human factor in war, In other words, the more advanced our military technology, these “technocrats” believe, the less we need to worry about the professional capability and competence of generals, admirals, soldiers, sailors, and airmen.

The technocrats believe that the results of the Kuwait, or Gulf, War of 1991 have confirmed their conviction. They cite the contribution to those results of the U.N. (mainly U.S.) command of the air, stealth aircraft, sophisticated guided missiles, and general electronic superiority, They believe that it was technology which simply made irrelevant the recent combat experience of the Iraqis in their long war with Iran.

Yet there are a few humanist military theorists who believe that the technocrats have totally misread the lessons of this century‘s wars! They agree that, while technology was important in the overwhelming U.N. victory, the principal reason for the tremendous margin of U.N. superiority was the better training, skill, and dedication of U.N. forces (again, mainly U.S.).

And so the debate rests. Both sides believe that the result of the Kuwait War favors their point of view, Nevertheless, an objective assessment of the literature in professional military journals, of doctrinal trends in the U.S. services, and (above all) of trends in the U.S. defense budget, suggest that the technocrats have stronger arguments than the humanists—or at least have been more convincing in presenting their arguments.

I suggest, however, that a completely impartial comparison of the Kuwait War results with those of other recent wars, and with some of the phenomena of World War II, shows that the humanists should not yet concede the debate.

I am a humanist, who is also convinced that technology is as important today in war as it ever was (and it has always been important), and that any national or military leader who neglects military technology does so to his peril and that of his country, But, paradoxically, perhaps to an extent even greater than ever before, the quality of military men is what wins wars and preserves nations.

To elevate the debate beyond generalities, and demonstrate convincingly that the human factor is at least as important as technology in war, I shall review eight instances in this past century when a military force has been successful because of the quality if its people, even though the other side was at least equal or superior in the technological sophistication of its weapons. The examples I shall use are:

  • Germany vs. the USSR in World War II
  • Germany vs. the West in World War II
  • Israel vs. Arabs in 1948, 1956, 1967, 1973 and 1982
  • The Vietnam War, 1965-1973
  • Britain vs. Argentina in the Falklands 1982
  • South Africans vs. Angolans and Cubans, 1987-88
  • The U.S. vs. Iraq, 1991

The demonstration will be based upon a marshaling of historical facts, then analyzing those facts by means of a little simple arithmetic.

Relative Combat Effectiveness Value (CEV)

The purpose of the arithmetic is to calculate relative combat effectiveness values (CEVs) of two opposing military forces. Let me digress to set up the arithmetic. Although some people who hail from south of the Mason-Dixon Line may be reluctant to accept the fact, statistics prove that the fighting quality of Northern soldiers and Southern soldiers was virtually equal in the American Civil War. (I invite those who might disagree to look at Livermore’s Numbers and Losses in the Civil War). That assumption of equality of the opposing troop quality in the Civil War enables me to assert that the successful side in every important battle in the Civil War was successful either because of numerical superiority or superior generalship. Three of Lee’s battles make the point:

  • Despite being outnumbered, Lee won at Antietam. (Though Antietam is sometimes claimed as a Union victory, Lee, the defender, held the battlefield; McClellan, the attacker, was repulsed.) The main reason for Lee’s success was that on a scale of leadership his generalship was worth 10, while McClellan was barely a 6.
  • Despite being outnumbered, Lee won at Chancellorsville because he was a 10 to Hooker’s 5.
  • Lee lost at Gettysburg mainly because he was outnumbered. Also relevant: Meade did not lose his nerve (like McClellan and Hooker) with generalship worth 8 to match Lee’s 8.

Let me use Antietam to show the arithmetic involved in those simple analyses of a rather complex subject:

The numerical strength of McClellan’s army was 89,000; Lee’s army was only 39,000 strong, but had the multiplier benefit of defensive posture. This enables us to calculate the theoretical combat power ratio of the Union Army to the Confederate Army as 1.4:1.0. In other words, with substantial preponderance of force, the Union Army should have been successful. (The combat power ratio of Confederates to Northerners, of course, was the reciprocal, or 0.71:1.04)

However, Lee held the battlefield, and a calculation of the actual combat power ratio of the two sides (based on accomplishment of mission, gaining or holding ground, and casualties) was a scant, but clear cut: 1.16:1.0 in favor of the Confederates. A ratio of the actual combat power ratio of the Confederate/Union armies (1.16) to their theoretical combat power (0.71) gives us a value of 1.63. This is the relative combat effectiveness of the Lee’s army to McClellan’s army on that bloody day. But, if we agree that the quality of the troops was the same, then the differential must essentially be in the quality of the opposing generals. Thus, Lee was a 10 to McClellan‘s 6.

The simple arithmetic equation[1] on which the above analysis was based is as follows:

CEV = (R/R)/(P/P)

When:
CEV is relative Combat Effectiveness Value
R/R is the actual combat power ratio
P/P is the theoretical combat power ratio.

At Antietam the equation was: 1.63 = 1.16/0.71.

We’ll be revisiting that equation in connection with each of our examples of the relative importance of technology and human factors.

Air Power and Technology

However, one more digression is required before we look at the examples. Air power was important in all eight of the 20th Century examples listed above. Offhand it would seem that the exercise of air superiority by one side or the other is a manifestation of technological superiority. Nevertheless, there are a few examples of an air force gaining air superiority with equivalent, or even inferior aircraft (in quality or numbers) because of the skill of the pilots.

However, the instances of such a phenomenon are rare. It can be safely asserted that, in the examples used in the following comparisons, the ability to exercise air superiority was essentially a technological superiority (even though in some instances it was magnified by human quality superiority). The one possible exception might be the Eastern Front in World War II, where a slight German technological superiority in the air was offset by larger numbers of Soviet aircraft, thanks in large part to Lend-Lease assistance from the United States and Great Britain.

The Battle of Kursk, 5-18 July, 1943

Following the surrender of the German Sixth Army at Stalingrad, on 2 February, 1943, the Soviets mounted a major winter offensive in south-central Russia and Ukraine which reconquered large areas which the Germans had overrun in 1941 and 1942. A brilliant counteroffensive by German Marshal Erich von Manstein‘s Army Group South halted the Soviet advance, and recaptured the city of Kharkov in mid-March. The end of these operations left the Soviets holding a huge bulge, or salient, jutting westward around the Russian city of Kursk, northwest of Kharkov.

The Germans promptly prepared a new offensive to cut off the Kursk salient, The Soviets energetically built field fortifications to defend the salient against expected German attacks. The German plan was for simultaneous offensives against the northern and southern shoulders of the base of the Kursk salient, Field Marshal Gunther von K1uge’s Army Group Center, would drive south from the vicinity of Orel, while Manstein’s Army Group South pushed north from the Kharkov area, The offensive was originally scheduled for early May, but postponements by Hitler, to equip his forces with new tanks, delayed the operation for two months, The Soviets took advantage of the delays to further improve their already formidable defenses.

The German attacks finally began on 5 July. In the north General Walter Model’s German Ninth Army was soon halted by Marshal Konstantin Rokossovski’s Army Group Center. In the south, however, German General Hermann Hoth’s Fourth Panzer Army and a provisional army commanded by General Werner Kempf, were more successful against the Voronezh Army Group of General Nikolai Vatutin. For more than a week the XLVIII Panzer Corps advanced steadily toward Oboyan and Kursk through the most heavily fortified region since the Western Front of 1918. While the Germans suffered severe casualties, they inflicted horrible losses on the defending Soviets. Advancing similarly further east, the II SS Panzer Corps, in the largest tank battle in history, repulsed a vigorous Soviet armored counterattack at Prokhorovka on July 12-13, but was unable to continue to advance.

The principal reason for the German halt was the fact that the Soviets had thrown into the battle General Ivan Konev’s Steppe Army Group, which had been in reserve. The exhausted, heavily outnumbered Germans had no comparable reserves to commit to reinvigorate their offensive.

A comparison of forces and losses of the Soviet Voronezh Army Group and German Army Group South on the south face of the Kursk Salient is shown below. The strengths are averages over the 12 days of the battle, taking into consideration initial strengths, losses, and reinforcements.

A comparison of the casualty tradeoff can be found by dividing Soviet casualties by German strength, and German losses by Soviet strength. On that basis, 100 Germans inflicted 5.8 casualties per day on the Soviets, while 100 Soviets inflicted 1.2 casualties per day on the Germans, a tradeoff of 4.9 to 1.0

The statistics for the 8-day offensive of the German XLVIII Panzer Corps toward Oboyan are shown below. Also shown is the relative combat effectiveness value (CEV) of Germans and Soviets, as calculated by the TNDM. As was the case for the Battle of Antietam, this is derived from a mathematical comparison of the theoretical combat power ratio of the two forces (simply considering numbers and weapons characteristics), and the actual combat power ratios reflected by the battle results:

The calculated CEVs suggest that 100 German troops were the combat equivalent of 240 Soviet troops, comparably equipped. The casualty tradeoff in this battle shows that 100 Germans inflicted 5.15 casualties per day on the Soviets, while 100 Soviets inflicted 1.11 casualties per day on the Germans, a tradeoff of4.64. It is a rule of thumb that the casualty tradeoff is usually about the square of the CEV.

A similar comparison can be made of the two-day battle of Prokhorovka. Soviet accounts of that battle have claimed this as a great victory by the Soviet Fifth Guards Tank Army over the German II SS Panzer Corps. In fact, since the German advance was halted, the outcome was close to a draw, but with the advantage clearly in favor of the Germans.

The casualty tradeoff shows that 100 Germans inflicted 7.7 casualties per on the Soviets, while 100 Soviets inflicted 1.0 casualties per day on the Germans, for a tradeoff value of 7.7.

When the German offensive began, they had a slight degree of local air superiority. This was soon reversed by German and Soviet shifts of air elements, and during most of the offensive, the Soviets had a slender margin of air superiority. In terms of technology, the Germans probably had a slight overall advantage. However, the Soviets had more tanks and, furthermore, their T-34 was superior to any tank the Germans had available at the time. The CEV calculations demonstrate that the Germans had a great qualitative superiority over the Russians, despite near-equality in technology, and despite Soviet air superiority. The Germans lost the battle, but only because they were overwhelmed by Soviet numbers.

German Performance, Western Europe, 1943-1945

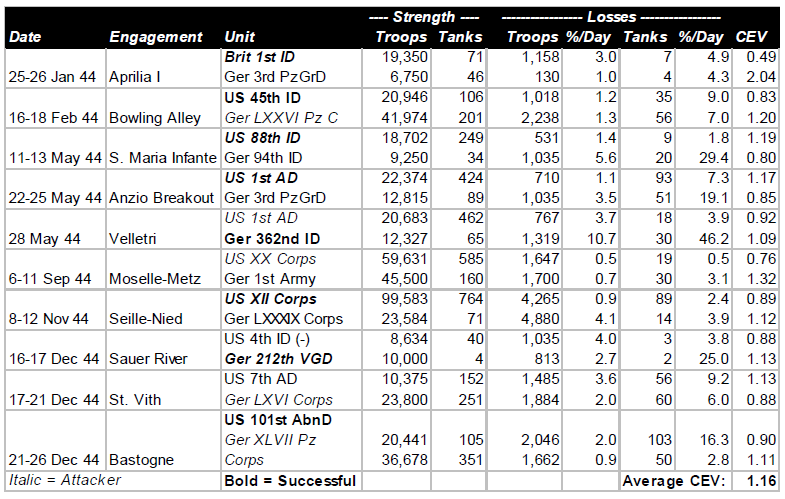
Beginning with operations between Salerno and Naples in September, 1943, through engagements in the closing days of the Battle of the Bulge in January, 1945, the pattern of German performance against the Western Allies was consistent. Some German units were better than others, and a few Allied units were as good as the best of the Germans. But on the average, German performance, as measured by CEV and casualty tradeoff, was better than the Western allies by a CEV factor averaging about 1.2, and a casualty tradeoff factor averaging about 1.5. Listed below are ten engagements from Italy and Northwest Europe during that 1944.

Technologically, German forces and those of the Western Allies were comparable. The Germans had a higher proportion of armored combat vehicles, and their best tanks were considerably better than the best American and British tanks, but the advantages were at least offset by the greater quantity of Allied armor, and greater sophistication of much of the Allied equipment. The Allies were increasingly able to achieve and maintain air superiority during this period of slightly less than two years.

The combination of vast superiority in numbers of troops and equipment, and in increasing Allied air superiority, enabled the Allies to fight their way slowly up the Italian boot, and between June and December, 1944, to drive from the Normandy beaches to the frontier of Germany. Yet the presence or absence of Allied air support made little difference in terms of either CEVs or casualty tradeoff values. Despite the defeats inflicted on them by the numerically superior Allies during the latter part of 1944, in December the Germans were able to mount a major offensive that nearly destroyed an American army corps, and threatened to drive at least a portion of the Allied armies into the sea.

Clearly, in their battles against the Soviets and the Western Allies, the Germans demonstrated that quality of combat troops was able consistently to overcome Allied technological and air superiority. It was Allied numbers, not technology, that defeated the quantitatively superior Germans.

The Six-Day War, 1967

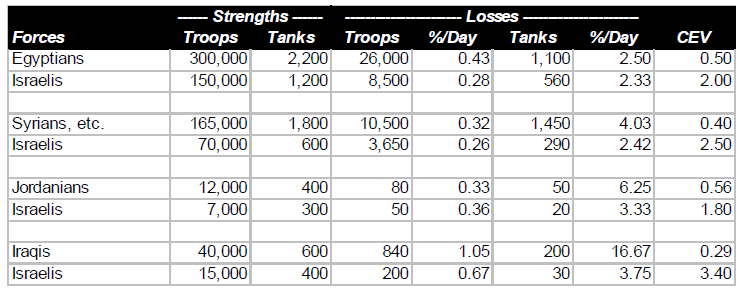
The remarkable Israeli victories over far more numerous Arab opponents—Egyptian, Jordanian, and Syrian—in June, 1967 revealed an Israeli combat superiority that had not been suspected in the United States, the Soviet Union or Western Europe. This superiority was equally awesome on the ground as in the air. (By beginning the war with a surprise attack which almost wiped out the Egyptian Air Force, the Israelis avoided a serious contest with the one Arab air force large enough, and possibly effective enough, to challenge them.) The results of the three brief campaigns are summarized in the table below:

It should be noted that some Israelis who fought against the Egyptians and Jordanians also fought against the Syrians. Thus, the overall Arab numerical superiority was greater than would be suggested by adding the above strength figures, and was approximately 328,000 to 200,000.

It should also be noted that the technological sophistication of the Israeli and Arab ground forces was comparable. The only significant technological advantage of the Israelis was their unchallenged command of the air. (In terms of battle outcomes, it was irrelevant how they had achieved air superiority.) In fact this was a very significant advantage, the full import of which would not be realized until the next Arab-Israeli war.

The results of the Six Day War do not provide an unequivocal basis for determining the relative importance of human factors and technological superiority (as evidenced in the air). Clearly a major factor in the Israeli victories was the superior performance of their ground forces due mainly to human factors. At least as important in those victories was Israeli command of the air, in which both technology and human factors both played a part.

The October War, 1973

A better basis for comparing the relative importance of human factors and technology is provided by the results of the October War of 1973 (known to Arabs as the War of Ramadan, and to Israelis as the Yom Kippur War). In this war the Israeli unquestioned superiority in the air was largely offset by the Arabs possession of highly sophisticated Soviet air defense weapons.

One important lesson of this war was a reassessment of Israeli contempt for the fighting quality of Arab ground forces (which had stemmed from the ease with which they had won their ground victories in 1967). When Arab ground troops were protected from Israeli air superiority by their air defense weapons, they fought well and bravely, demonstrating that Israeli control of the air had been even more significant in 1967 than anyone had then recognized.

It should be noted that the total Arab (and Israeli) forces are those shown in the first two comparisons, above. A Jordanian brigade and two Iraqi divisions formed relatively minor elements of the forces under Syrian command (although their presence on the ground was significant in enabling the Syrians to maintain a defensive line when the Israelis threatened a breakthrough around 20 October). For the comparison of Jordanians and Iraqis the total strength is the total of the forces in the battles (two each) on which these comparisons are based.

One other thing to note is how the Israelis, possibly unconsciously, confirmed that validity of their CEVs with respect to Egyptians and Syrians by the numerical strengths of their deployments to the two fronts. Since the war ended up in a virtual stalemate on both fronts, the overall strength figures suggest rough equivalence of combat capability.

The CEV values shown in the above table are very significant in relation to the debate about human factors and technology, There was little if anything to choose between the technological sophistication of the two sides. The Arabs had more tanks than the Israelis, but (as Israeli General Avraham Adan once told the author) there was little difference in the quality of the tanks. The Israelis again had command of the air, but this was neutralized immediately over the battlefields by the Soviet air defense equipment effectively manned by the Arabs. Thus, while technology was of the utmost importance to both sides, enabling each side to prevent the enemy from gaining a significant advantage, the true determinant of battlefield outcomes was the fighting quality of the troops, And, while the Arabs fought bravely, the Israelis fought much more effectively. Human factors made the difference.

Israeli Invasion of Lebanon, 1982

In terms of the debate about the relative importance of human factors and technology, there are two significant aspects to this small war, in which Syrians forces and PLO guerrillas were the Arab participants. In the first place, the Israelis showed that their air technology was superior to the Syrian air defense technology, As a result, they regained complete control of the skies over the battlefields. Secondly, it provides an opportunity to include a highly relevant quotation.

The statistical comparison shows the results of the two major battles fought between Syrians and Israelis:

In assessing the above statistics, a quotation from the Israeli Chief of Staff, General Rafael Eytan, is relevant.

In late 1982 a group of retired American generals visited Israel and the battlefields in Lebanon. Just before they left for home, they had a meeting with General Eytan. One of the American generals asked Eytan the following question: “Since the Syrians were equipped with Soviet weapons, and your troops were equipped with American (or American-type) weapons, isn’t the overwhelming Israeli victory an indication of the superiority of American weapons technology over Soviet weapons technology?”

Eytan’s reply was classic: “If we had had their weapons, and they had had ours, the result would have been absolutely the same.”

One need not question how the Israeli Chief of Staff assessed the relative importance of the technology and human factors.

Falkland Islands War, 1982

It is difficult to get reliable data on the Falkland Islands War of 1982. Furthermore, the author of this article had not undertaken the kind of detailed analysis of such data as is available. However, it is evident from the information that is available about that war that its results were consistent with those of the other examples examined in this article.

The total strength of Argentine forces in the Falklands at the time of the British counter-invasion was slightly more than 13,000. The British appear to have landed close to 6,400 troops, although it may have been fewer. In any event, it is evident that not more than 50% of the total forces available to both sides were actually committed to battle. The Argentine surrender came 27 days after the British landings, but there were probably no more than six days of actual combat. During these battles the British performed admirably, the Argentinians performed miserably. (Save for their Air Force, which seems to have fought with considerable gallantry and effectiveness, at the extreme limit of its range.) The British CEV in ground combat was probably between 2.5 and 4.0. The statistics were at least close to those presented below:

It is evident from published sources that the British had no technological advantage over the Argentinians; thus the one-sided results of the ground battles were due entirely to British skill (derived from training and doctrine) and determination.

South African Operations in Angola, 1987-1988

Neither the political reasons for, nor political results of, the South African military interventions in Angola in the 1970s, and again in the late 1980s, need concern us in our consideration of the relative significance of technology and of human factors. The combat results of those interventions, particularly in 1987-1988 are, however, very relevant.

The operations between elements of the South African Defense Force (SADF) and forces of the Popular Movement for the Liberation of Angola (FAPLA) took place in southeast Angola, generally in the region east of the city of Cuito-Cuanavale. Operating with the SADF units were a few small units of Jonas Savimbi’s National Union for the Total Independence of Angola (UNITA). To provide air support to the SADF and UNITA ground forces, it would have been necessary for the South Africans to establish air bases either in Botswana, Southwest Africa (Namibia), or in Angola itself. For reasons that were largely political, they decided not to do that, and thus operated under conditions of FAPLA air supremacy. This led them, despite terrain generally unsuited for armored warfare, to use a high proportion of armored vehicles (mostly light armored cars) to provide their ground troops with some protection from air attack.

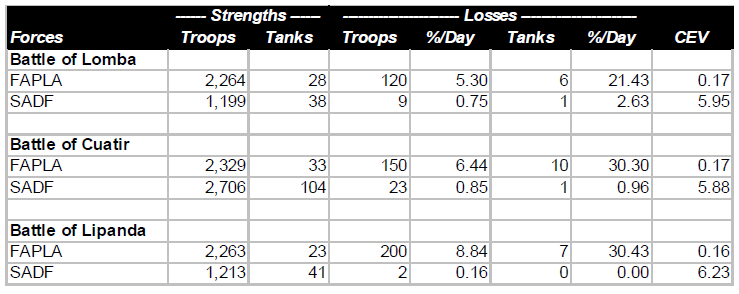
Summarized below are the results of three battles east of Cuito-Cuanavale in late 1987 and early 1988. Included with FAPLA forces are a few Cubans (mostly in armored units); included with the SADF forces are a few UNITA units (all infantry).

FAPLA had complete command of air, and substantial numbers of MiG-21 and MiG-23 sorties were flown against the South Africans in all of these battles. This technological superiority was probably partly offset by greater South African EW (electronic warfare) capability. The ability of the South Africans to operate effectively despite hostile air superiority was reminiscent of that of the Germans in World War II. It was a further demonstration that, no matter how important technology may be, the fighting quality of the troops is even more important.

The tank figures include armored cars. In the first of the three battles considered, FAPLA had by far the more powerful and more numerous medium tanks (20 to 0). In the other two, SADF had a slight or significant advantage in medium tank numbers and quality. But it didn’t seem to make much difference in the outcomes.

Kuwait War, 1991

The previous seven examples permit us to examine the results of Kuwait (or Second Gulf) War with more objectivity than might otherwise have possible. First, let’s look at the statistics. Note that the comparison shown below is for four days of ground combat, February 24-28, and shows only operations of U.S. forces against the Iraqis.

There can be no question that the single most important contribution to the overwhelming victory of U.S. and other U.N. forces was the air war that preceded, and accompanied, the ground operations. But two comments are in order. The air war alone could not have forced the Iraqis to surrender. On the other hand, it is evident that, even without the air war, U.S. forces would have readily overwhelmed the Iraqis, probably in more than four days, and with more than 285 casualties. But the outcome would have been hardly less one-sided.

The Vietnam War, 1965-1973

It is impossible to make the kind of mathematical analysis for the Vietnam War as has been done in the examples considered above. The reason is that we don’t have any good data on the Vietcong—North Vietnamese forces,

However, such quantitative analysis really isn’t necessary There can be no doubt that one of the opponents was a superpower, the most technologically advanced nation on earth, while the other side was what Lyndon Johnson called a “raggedy-ass little nation,” a typical representative of “the third world.“

Furthermore, even if we were able to make the analyses, they would very possibly be misinterpreted. It can be argued (possibly with some exaggeration) that the Americans won all of the battles. The detailed engagement analyses could only confirm this fact. Yet it is unquestionable that the United States, despite airpower and all other manifestations of technological superiority, lost the war. The human factor—as represented by the quality of American political (and to a lesser extent military) leadership on the one side, and the determination of the North Vietnamese on the other side—was responsible for this defeat.

Conclusion

In a recent article in the Armed Forces Journal International Col. Philip S. Neilinger, USAF, wrote: “Military operations are extremely difficult, if not impossible, for the side that doesn’t control the sky.” From what we have seen, this is only partly true. And while there can be no question that operations will always be difficult to some extent for the side that doesn’t control the sky, the degree of difficulty depends to a great degree upon the training and determination of the troops.

What we have seen above also enables us to view with a better perspective Colonel Neilinger’s subsequent quote from British Field Marshal Montgomery: “If we lose the war in the air, we lose the war and we lose it quickly.” That statement was true for Montgomery, and for the Allied troops in World War II. But it was emphatically not true for the Germans.

The examples we have seen from relatively recent wars, therefore, enable us to establish priorities on assuring readiness for war. It is without question important for us to equip our troops with weapons and other materiel which can match, or come close to matching, the technological quality of the opposition’s materiel. We must realize that we cannot—as some people seem to think—buy good forces, by technology alone. Even more important is to assure the fighting quality of the troops. That must be, by far, our first priority in peacetime budgets and in peacetime military activities of all sorts.

NOTES

[1] This calculation is automatic in analyses of historical battles by the Tactical Numerical Deterministic Model (TNDM).

[2] The initial tank strength of the Voronezh Army Group was about 1,100 tanks. About 3,000 additional Soviet tanks joined the battle between 6 and 12 July. At the end of the battle there were about 1,800 Soviet tanks operational in the battle area; at the same time there were about 1,000 German tanks still operational.

[3] The relative combat effectiveness value of each force is calculated in comparison to 1.0. Thus the CEV of the Germans is 2.40:1.0, while that of the Soviets is 0.42: 1.0. The opposing CEVs are always the reciprocals of each other.

Spotted In The New Books Section Of The U.S. Naval Academy Library…

Christopher A. Lawrence, War by Numbers: Understanding Conventional Combat (Lincoln, NE: Potomac Books, 2017) 390 pages, $39.95

War by Numbers assesses the nature of conventional warfare through the analysis of historical combat. Christopher A. Lawrence (President and Executive Director of The Dupuy Institute) establishes what we know about conventional combat and why we know it. By demonstrating the impact a variety of factors have on combat he moves such analysis beyond the work of Carl von Clausewitz and into modern data and interpretation.

Using vast data sets, Lawrence examines force ratios, the human factor in case studies from World War II and beyond, the combat value of superior situational awareness, and the effects of dispersion, among other elements. Lawrence challenges existing interpretations of conventional warfare and shows how such combat should be conducted in the future, simultaneously broadening our understanding of what it means to fight wars by the numbers.

The book is available in paperback directly from Potomac Books and in paperback and Kindle from Amazon.

TDI Friday Read: The Lanchester Equations

Frederick W. Lanchester (1868-1946), British engineer and author of the Lanchester combat attrition equations. [Lanchester.com]

Today’s edition of TDI Friday Read addresses the Lanchester equations and their use in U.S. combat models and simulations. In 1916, British engineer Frederick W. Lanchester published a set of calculations he had derived for determining the results of attrition in combat. Lanchester intended them to be applied as an abstract conceptualization of aerial combat, stating that he did not believe they were applicable to ground combat.

Due to their elegant simplicity, U.S. military operations researchers nevertheless began incorporating the Lanchester equations into their land warfare computer combat models and simulations in the 1950s and 60s. The equations are the basis for many models and simulations used throughout the U.S. defense community today.

The problem with using Lanchester’s equations is that, despite numerous efforts, no one has been able to demonstrate that they accurately represent real-world combat.

Lanchester equations have been weighed….

Really…..Lanchester?

Trevor Dupuy was critical of combat models based on the Lanchester equations because they cannot account for the role behavioral and moral (i.e. human) factors play in combat.

Human Factors In Warfare: Interaction Of Variable Factors

He was also critical of models and simulations that had not been tested to see whether they could reliably represent real-world combat experience. In the modeling and simulation community, this sort of testing is known as validation.

Military History and Validation of Combat Models

The use of unvalidated concepts, like the Lanchester equations, and unvalidated combat models and simulations persists. Critics have dubbed this the “base of sand” problem, and it continues to affect not only models and simulations, but all abstract theories of combat, including those represented in military doctrine.

https://dupuyinstitute.dreamhosters.com/2017/04/10/wargaming-multi-domain-battle-the-base-of-sand-problem/

Command and Combat Effectiveness: The Case of the British 51st Highland Division

Soldiers of the British 51st Highland Division take cover in bocage in Normandy, 1944. [Daily Record (UK)]

While Trevor Dupuy’s concept of combat effectiveness has been considered controversial by some, he was hardly the only one to observe that throughout history, some military forces have fought more successfully on the battlefield than others. While the sources of victory and defeat in battle remain a fertile, yet understudied topic, there is a growing literature on the topic of military effectiveness in the fields of strategic and security studies.

Anthony King, a professor in War Studies at the University of Warwick, has published an outstanding article in the most recent edition of British Journal of Military History, “Why did 51st Highland Division Fail? A case-study in command and combat effectiveness.” In it, he examined military command and combat effectiveness through the experience of the British 51st Highland Division in the 1944 Normandy Campaign. Most usefully, King developed a definition of military command that clarifies its relationship to combat effectiveness: “The function of a commander is to maximise combat power by defining achievable missions and, then, orchestrating subordinates into a cohesive whole committed to mission accomplishment.”

Defining Military Command

In order to analyze the relationship between command and combat effectiveness, King sought to “define the concept of command and to specify its relationship to management and leadership.” The construct he developed drew upon the work of Peter Drucker, an Austrian-born American business consultant and writer who is considered by many to be “the founder of modern management.” From Drucker, King distilled a definition of the function and process of military command: “command always consists of three elements: mission definition, mission management and mission motivation.”

As King explained, “When command is understood in this way, its connection to combat effectiveness begins to become clear.”

[C]ommand is an institutional solution to an organizational problem; it generates cohesion in a formation. Specifically, by uniting decision-making authority in one person and one role, a large military force is able to unite subordinate units, whose troops are not co-present with each other and who, in most cases, do not know each other. Crucially, the combat effectiveness of a formation, as a formation, is substantially dependent upon the ability of its commander to synchronise its disparate efforts in order to generate collective effects. Skillful command has a galvanising influence on a military force; by orchestrating the activities of subordinate units and motivating troops, command is able to create a level of combat power, which supervenes the capabilities of each of the parts. A well-commanded force has properties, which exceed those of its constituent units, fighting alone.

It is through the orchestration, synchronization, and motivation of effort, King concluded, that “command and combat effectiveness are immediately connected. Command fuses a formation together and increases its determination to fulfil its missions.”

Assessing the Combat Effectiveness of the 51st Division

The rest of King’s article is a detailed assessment of the combat effectiveness of the 51st Highland Division in Normandy in June and July 1944 using this military command construct. Observers at the time noted a decline in the division’s combat performance, which had been graded quite highly in North Africa and Sicily. The one obvious difference was the replacement of Major General Douglas Wimberley with Major General Charles Bullen-Smith in August 1943. After concluding that the 51st Division was no longer battleworthy, the commander of the British 21st Army Group, General Bernard Montgomery personally relieved Bullen-Smith in late July 1944.

In reviewing Bullen-Smith’s performance, King concluded that

Although a number of factors contributed to the struggles of the Highland Division in Normandy, there is little doubt that the shortcomings of its commander, Major General Charles Bullen-Smith, were the critical factor. Charles Bullen-Smith failed to fulfill the three essential functions required of a commander… Bullen-Smith’s inadequacies are highly suggestive of a direct relationship between command and combat effectiveness; they demonstrate how command can augment or undermine combat performance.

King’s approach to military studies once again demonstrates the relevance of multi-disciplinary analysis based on solid historical research. His military command model should prove to be a very useful tool for analyzing the elements of combat effectiveness and assessing combat power. Along with Dr. Jonathan Fennell’s work on measuring morale, among others, it appears that good progress is being made on the study of human factors in combat and military operations, at least in the British academic community (even if Tom Ricks thinks otherwise).

Validating Trevor Dupuy’s Combat Models

[The article below is reprinted from Winter 2010 edition of The International TNDM Newsletter.]

A Summation of QJM/TNDM Validation Efforts

By Christopher A. Lawrence

There have been six or seven different validation tests conducted of the QJM (Quantified Judgment Model) and the TNDM (Tactical Numerical Deterministic Model). As the changes to these two models are evolutionary in nature but do not fundamentally change the nature of the models, the whole series of validation tests across both models is worth noting. To date, this is the only model we are aware of that has been through multiple validations. We are not aware of any DOD [Department of Defense] combat model that has undergone more than one validation effort. Most of the DOD combat models in use have not undergone any validation.

The Two Original Validations of the QJM

After its initial development using a 60-engagement WWII database, the QJM was tested in 1973 by application of its relationships and factors to a validation database of 21 World War II engagements in Northwest Europe in 1944 and 1945. The original model proved to be 95% accurate in explaining the outcomes of these additional engagements. Overall accuracy in predicting the results of the 81 engagements in the developmental and validation databases was 93%.[1]

During the same period the QJM was converted from a static model that only predicted success or failure to one capable of also predicting attrition and movement. This was accomplished by adding variables and modifying factor values. The original QJM structure was not changed in this process. The addition of movement and attrition as outputs allowed the model to be used dynamically in successive “snapshot” iterations of the same engagement.

From 1973 to 1979 the QJM’s formulae, procedures, and variable factor values were tested against the results of all of the 52 significant engagements of the 1967 and 1973 Arab-Israeli Wars (19 from the former, 33 from the latter). The QJM was able to replicate all of those engagements with an accuracy of more than 90%?[2]

In 1979 the improved QJM was revalidated by application to 66 engagements. These included 35 from the original 81 engagements (the “development database”), and 31 new engagements. The new engagements included five from World War II and 26 from the 1973 Middle East War. This new validation test considered four outputs: success/failure, movement rates, personnel casualties, and tank losses. The QJM predicted success/failure correctly for about 85% of the engagements. It predicted movement rates with an error of 15% and personnel attrition with an error of 40% or less. While the error rate for tank losses was about 80%, it was discovered that the model consistently underestimated tank losses because input data included all kinds of armored vehicles, but output data losses included only numbers of tanks.[3]

This completed the original validations efforts of the QJM. The data used for the validations, and parts of the results of the validation, were published, but no formal validation report was issued. The validation was conducted in-house by Colonel Dupuy’s organization, HERO [Historical Evaluation Research Organization]. The data used were mostly from division-level engagements, although they included some corps- and brigade-level actions. We count these as two separate validation efforts.

The Development of the TNDM and Desert Storm

In 1990 Col. Dupuy, with the collaborative assistance of Dr. James G. Taylor (author of Lanchester Models of Warfare [vol. 1] [vol. 2], published by the Operations Research Society of America, Arlington, Virginia, in 1983) introduced a significant modification: the representation of the passage of time in the model. Instead of resorting to successive “snapshots,” the introduction of Taylor’s differential equation technique permitted the representation of time as a continuous flow. While this new approach required substantial changes to the software, the relationship of the model to historical experience was unchanged.[4] This revision of the model also included the substitution of formulae for some of its tables so that there was a continuous flow of values across the individual points in the tables. It also included some adjustment to the values and tables in the QJM. Finally, it incorporated a revised OLI [Operational Lethality Index] calculation methodology for modem armor (mobile fighting machines) to take into account all the factors that influence modern tank warfare.[5] The model was reprogrammed in Turbo PASCAL (the original had been written in BASIC). The new model was called the TNDM (Tactical Numerical Deterministic Model).

Building on its foundation of historical validation and proven attrition methodology, in December 1990, HERO used the TNDM to predict the outcome of, and losses from, the impending Operation DESERT STORM.[6] It was the most accurate (lowest) public estimate of U.S. war casualties provided before the war. It differed from most other public estimates by an order of magnitude.

Also, in 1990, Trevor Dupuy published an abbreviated form of the TNDM in the book Attrition: Forecasting Battle Casualties and Equipment Losses in Modern War. A brief validation exercise using 12 battles from 1805 to 1973 was published in this book.[7] This version was used for creation of M-COAT[8] and was also separately tested by a student (Lieutenant Gozel) at the Naval Postgraduate School in 2000.[9] This version did not have the firepower scoring system, and as such neither M-COAT, Lieutenant Gozel’s test, nor Colonel Dupuy’s 12-battle validation included the OLI methodology that is in the primary version of the TNDM.

For counting purposes, I consider the Gulf War the third validation of the model. In the end, for any model, the proof is in the pudding. Can the model be used as a predictive tool or not? If not, then there is probably a fundamental flaw or two in the model. Still the validation of the TNDM was somewhat second-hand, in the sense that the closely-related previous model, the QJM, was validated in the 1970s to 200 World War II and 1967 and 1973 Arab-Israeli War battles, but the TNDM had not been. Clearly, something further needed to be done.

The Battalion-Level Validation of the TNDM

Under the guidance of Christopher A. Lawrence, The Dupuy Institute undertook a battalion-level validation of the TNDM in late 1996. This effort tested the model against 76 engagements from World War I, World War II, and the post-1945 world including Vietnam, the Arab-Israeli Wars, the Falklands War, Angola, Nicaragua, etc. This effort was thoroughly documented in The International TNDM Newsletter.[10] This effort was probably one of the more independent and better-documented validations of a casualty estimation methodology that has ever been conducted to date, in that:

  • The data was independently assembled (assembled for other purposes before the validation) by a number of different historians.
  • There were no calibration runs or adjustments made to the model before the test.
  • The data included a wide range of material from different conflicts and times (from 1918 to 1983).
  • The validation runs were conducted independently (Susan Rich conducted the validation runs, while Christopher A. Lawrence evaluated them).
  • The results of the validation were fully published.
  • The people conducting the validation were independent, in the sense that:

a) there was no contract, management, or agency requesting the validation;
b) none of the validators had previously been involved in designing the model, and had only very limited experience in using it; and
c) the original model designer was not able to oversee or influence the validation.[11]

The validation was not truly independent, as the model tested was a commercial product of The Dupuy Institute, and the person conducting the test was an employee of the Institute. On the other hand, this was an independent effort in the sense that the effort was employee-initiated and not requested or reviewed by the management of the Institute. Furthermore, the results were published.

The TNDM was also given a limited validation test back to its original WWII data around 1997 by Niklas Zetterling of the Swedish War College, who retested the model to about 15 or so Italian campaign engagements. This effort included a complete review of the historical data used for the validation back to their primarily sources, and details were published in The International TNDM Newsletter.[12]

There has been one other effort to correlate outputs from QJM/TNDM-inspired formulae to historical data using the Ardennes and Kursk campaign-level (i.e., division-level) databases.[13] This effort did not use the complete model, but only selective pieces of it, and achieved various degrees of “goodness of fit.” While the model is hypothetically designed for use from squad level to army group level, to date no validation has been attempted below battalion level, or above division level. At this time, the TNDM also needs to be revalidated back to its original WWII and Arab-Israeli War data, as it has evolved since the original validation effort.

The Corps- and Division-level Validations of the TNDM

Having now having done one extensive battalion-level validation of the model and published the results in our newsletters, Volume 1, issues 5 and 6, we were then presented an opportunity in 2006 to conduct two more validations of the model. These are discussed in depth in two articles of this issue of the newsletter.

These validations were again conducted using historical data, 24 days of corps-level combat and 25 cases of division-level combat drawn from the Battle of Kursk during 4-15 July 1943. It was conducted using an independently-researched data collection (although the research was conducted by The Dupuy Institute), using a different person to conduct the model runs (although that person was an employee of the Institute) and using another person to compile the results (also an employee of the Institute). To summarize the results of this validation (the historical figure is listed first followed by the predicted result):

There was one other effort that was done as part of work we did for the Army Medical Department (AMEDD). This is fully explained in our report Casualty Estimation Methodologies Study: The Interim Report dated 25 July 2005. In this case, we tested six different casualty estimation methodologies to 22 cases. These consisted of 12 division-level cases from the Italian Campaign (4 where the attack failed, 4 where the attacker advanced, and 4 Where the defender was penetrated) and 10 cases from the Battle of Kursk (2 cases Where the attack failed, 4 where the attacker advanced and 4 where the defender was penetrated). These 22 cases were randomly selected from our earlier 628 case version of the DLEDB (Division-level Engagement Database; it now has 752 cases). Again, the TNDM performed as well as or better than any of the other casualty estimation methodologies tested. As this validation effort was using the Italian engagements previously used for validation (although some had been revised due to additional research) and three of the Kursk engagements that were later used for our division-level validation, then it is debatable whether one would want to call this a seventh validation effort. Still, it was done as above with one person assembling the historical data and another person conducting the model runs. This effort was conducted a year before the corps and division-level validation conducted above and influenced it to the extent that we chose a higher CEV (Combat Effectiveness Value) for the later validation. A CEV of 2.5 was used for the Soviets for this test, vice the CEV of 3.0 that was used for the later tests.

Summation

The QJM has been validated at least twice. The TNDM has been tested or validated at least four times, once to an upcoming, imminent war, once to battalion-level data from 1918 to 1989, once to division-level data from 1943 and once to corps-level data from 1943. These last four validation efforts have been published and described in depth. The model continues, regardless of which validation is examined, to accurately predict outcomes and make reasonable predictions of advance rates, loss rates and armor loss rates. This is regardless of level of combat (battalion, division or corps), historic period (WWI, WWII or modem), the situation of the combats, or the nationalities involved (American, German, Soviet, Israeli, various Arab armies, etc.). As the QJM, the model was effectively validated to around 200 World War II and 1967 and 1973 Arab-Israeli War battles. As the TNDM, the model was validated to 125 corps-, division-, and battalion-level engagements from 1918 to 1989 and used as a predictive model for the 1991 Gulf War. This is the most extensive and systematic validation effort yet done for any combat model. The model has been tested and re-tested. It has been tested across multiple levels of combat and in a wide range of environments. It has been tested where human factors are lopsided, and where human factors are roughly equal. It has been independently spot-checked several times by others outside of the Institute. It is hard to say what more can be done to establish its validity and accuracy.

NOTES

[1] It is unclear what these percentages, quoted from Dupuy in the TNDM General Theoretical Description, specify. We suspect it is a measurement of the model’s ability to predict winner and loser. No validation report based on this effort was ever published. Also, the validation figures seem to reflect the results after any corrections made to the model based upon these tests. It does appear that the division-level validation was “incremental.” We do not know if the earlier validation tests were tested back to the earlier data, but we have reason to suspect not.

[2] The original QJM validation data was first published in the Combat Data Subscription Service Supplement, vol. 1, no. 3 (Dunn Loring VA: HERO, Summer 1975). (HERO Report #50) That effort used data from 1943 through 1973.

[3] HERO published its QJM validation database in The QJM Data Base (3 volumes) Fairfax VA: HERO, 1985 (HERO Report #100).

[4] The Dupuy Institute, The Tactical Numerical Deterministic Model (TNDM): A General and Theoretical Description, McLean VA: The Dupuy Institute, October 1994.

[5] This had the unfortunate effect of undervaluing WWII-era armor by about 75% relative to other WWII weapons when modeling WWII engagements. This left The Dupuy Institute with the compromise methodology of using the old OLI method for calculating armor (Mobile Fighting Machines) when doing WWII engagements and using the new OLI method for calculating armor when doing modem engagements

[6] Testimony of Col. T. N. Dupuy, USA, Ret, Before the House Armed Services Committee, 13 Dec 1990. The Dupuy Institute File I-30, “Iraqi Invasion of Kuwait.”

[7] Trevor N. Dupuy, Attrition: Forecasting Battle Casualties and Equipment Losses in Modern War (HERO Books, Fairfax, VA, 1990), 123-4.

[8] M-COAT is the Medical Course of Action Tool created by Major Bruce Shahbaz. It is a spreadsheet model based upon the elements of the TNDM provided in Dupuy’s Attrition (op. cit.) It used a scoring system derived from elsewhere in the U.S. Army. As such, it is a simplified form of the TNDM with a different weapon scoring system.

[9] See Gözel, Ramazan. “Fitting Firepower Score Models to the Battle of Kursk Data,” NPGS Thesis. Monterey CA: Naval Postgraduate School.

[10] Lawrence, Christopher A. “Validation of the TNDM at Battalion Level.” The International TNDM Newsletter, vol. 1, no. 2 (October 1996); Bongard, Dave “The 76 Battalion-Level Engagements.” The International TNDM Newsletter, vol. 1, no. 4 (February 1997); Lawrence, Christopher A. “The First Test of the TNDM Battalion-Level Validations: Predicting the Winner” and “The Second Test of the TNDM Battalion-Level Validations: Predicting Casualties,” The International TNDM Newsletter, vol. 1 no. 5 (April 1997); and Lawrence, Christopher A. “Use of Armor in the 76 Battalion-Level Engagements,” and “The Second Test of the Battalion-Level Validation: Predicting Casualties Final Scorecard.” The International TNDM Newsletter, vol. 1, no. 6 (June 1997).

[11] Trevor N. Dupuy passed away in July 1995, and the validation was conducted in 1996 and 1997.

[12] Zetterling, Niklas. “CEV Calculations in Italy, 1943,” The International TNDM Newsletter, vol. 1, no. 6. McLean VA: The Dupuy Institute, June 1997. See also Research Plan, The Dupuy Institute Report E-3, McLean VA: The Dupuy Institute, 7 Oct 1998.

[13] See Gözel, “Fitting Firepower Score Models to the Battle of Kursk Data.”