Tag combat

The Effects Of Dispersion On Combat

[The article below is reprinted from the December 1996 edition of The International TNDM Newsletter. A revised version appears in Christopher A. Lawrence, War by Numbers: Understanding Conventional Combat (Potomac Books, 2017), Chapter 13.]

The Effects of Dispersion on Combat
by Christopher A. Lawrence

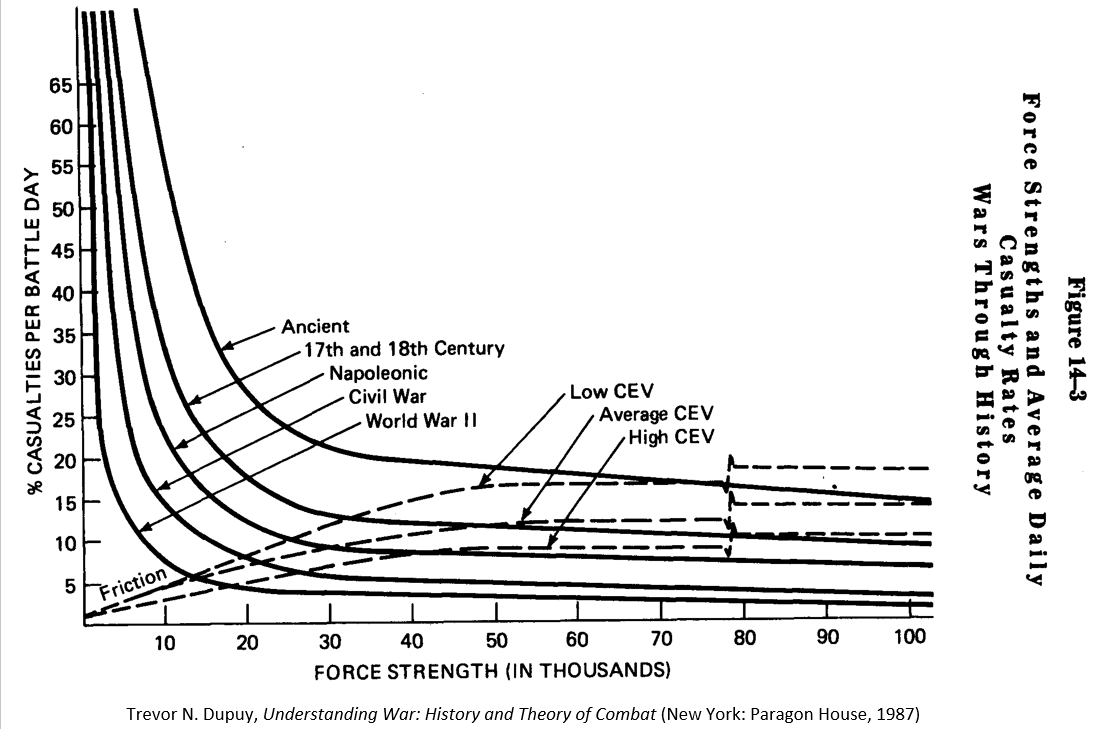
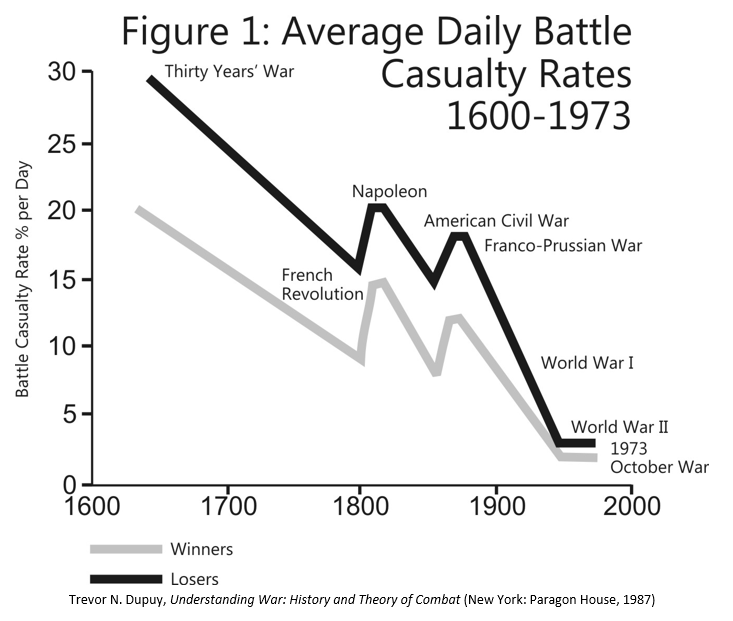
The TNDM[1] does not play dispersion. But it is clear that dispersion has continued to increase over time, and this must have some effect on combat. This effect was identified by Trevor N. Dupuy in his various writings, starting with the Evolution of Weapons and Warfare. His graph in Understanding War of the battle casualties trends over time is presented here as Figure 1. As dispersion changes over time (dramatically), one would expect the casualties would change over time. I therefore went back to the Land Warfare Database (the 605 engagement version[2]) and proceeded to look at casualties over time and dispersion from every angle that l could.

l eventually realized that l was going to need some better definition of the time periods l was measuring to, as measuring by years scattered the data, measuring by century assembled the data in too gross a manner, and measuring by war left a confusing picture due to the number of small wars with only two or three battles in them in the Land Warfare Database. I eventually defined the wars into 14 categories, so I could fit them onto one readable graph:

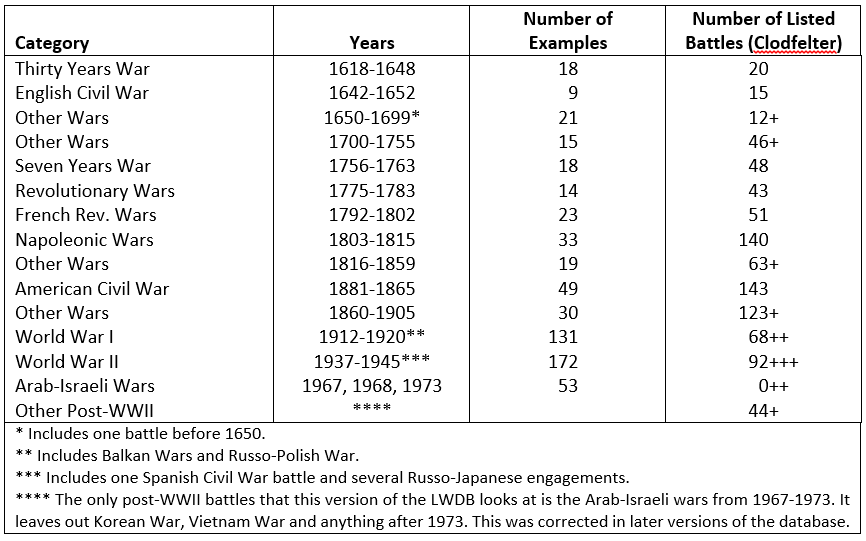
To give some idea of how representative the battles listed in the LWDB were for covering the period, I have included a count of the number of battles listed in Michael Clodfelter’s two-volume book Warfare and Armed Conflict, 1618-1991. In the case of WWI, WWII and later, battles tend to be defined as a divisional-level engagement, and there were literally tens of thousands of those.

I then tested my data again looking at the 14 wars that I defined:

  • Average Strength by War (Figure 2)
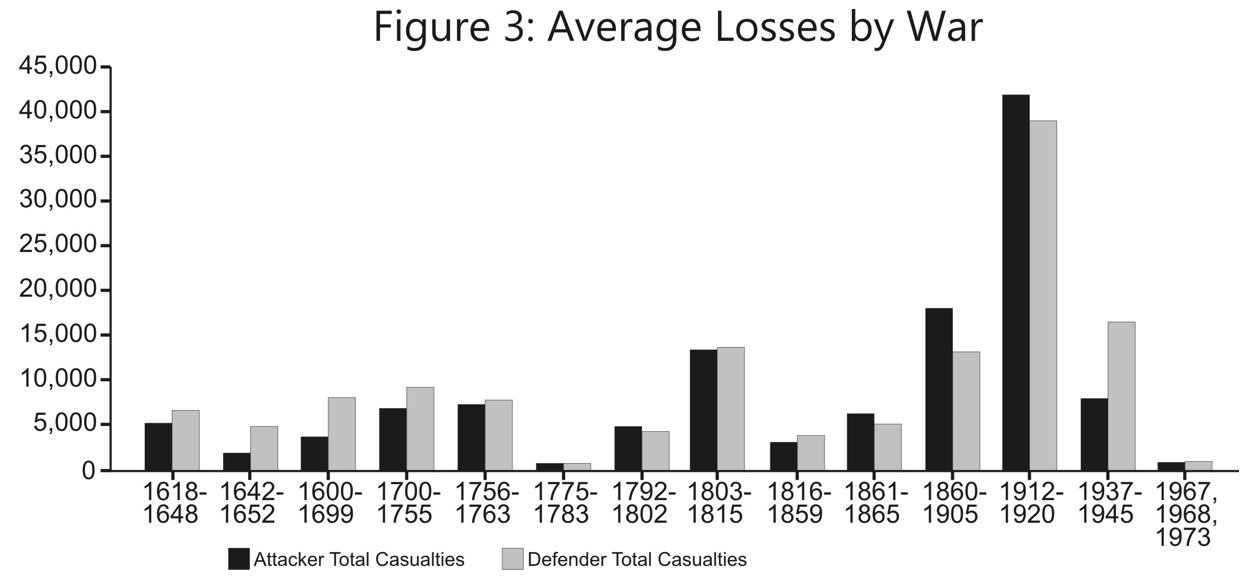
  • Average Losses by War (Figure 3)
  • Percent Losses Per Day By War (Figure 4)a
  • Average People Per Kilometer By War (Figure 5)
  • Losses per Kilometer of Front by War (Figure 6)
  • Strength and Losses Per Kilometer of Front By War (Figure 7)
  • Ratio of Strength and Losses per Kilometer of Front by War (Figure 8)
  • Ratio of Strength and Loses per Kilometer of Front by Century (Figure 9)

A review of average strengths over time by century and by war showed no surprises (see Figure 2). Up through around 1900, battles were easy to define: they were one- to three-day affairs between clearly defined forces at a locale. The forces had a clear left flank and right flank that was not bounded by other friendly forces. After 1900 (and in a few cases before), warfare was fought on continuous fronts

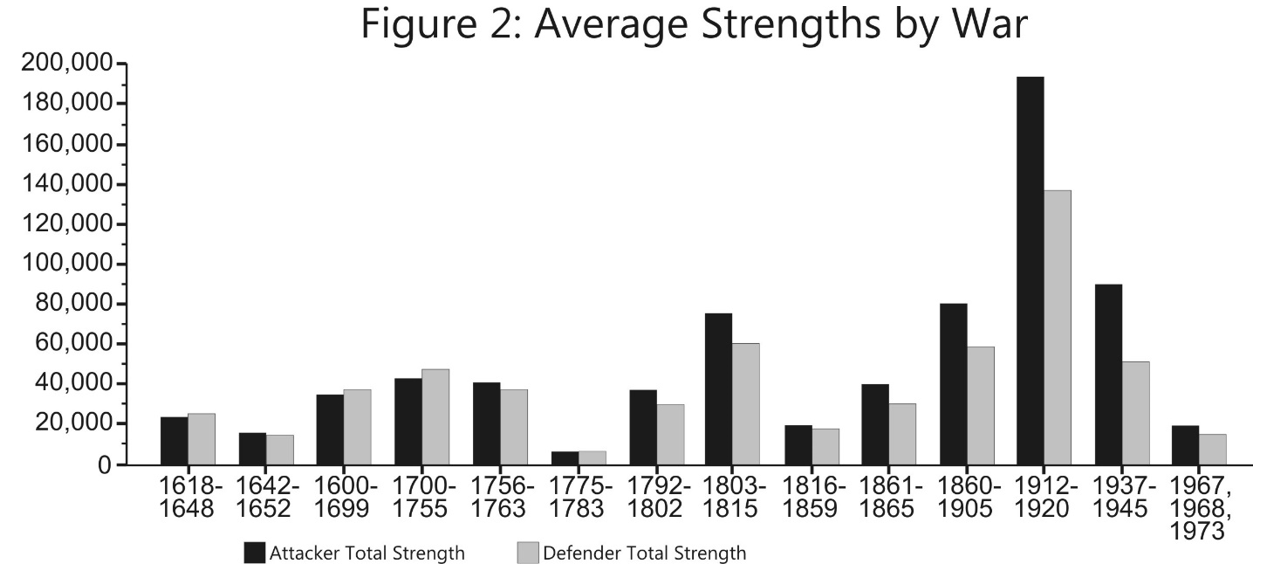
with a ‘battle’ often being a large multi-corps operation. It is no longer clearly understood what is meant by a battle, as the forces, area covered, and duration can vary widely. For the LWDB, each battle was defined as the analyst wished. ln the case of WWI, there are a lot of very large battles which drive the average battle size up. ln the cases of the WWII, there are a lot of division-level battles, which bring the average down. In the case of the Arab-Israeli Wars, there are nothing but division and brigade-level battles, which bring the average down.

The interesting point to notice is that the average attacker strength in the 16th and 17th century is lower than the average defender strength. Later it is higher. This may be due to anomalies in our data selection.

Average loses by war (see Figure 3) suffers from the same battle definition problem.

Percent losses per day (see Figure 4) is a useful comparison through the end of the 19th Century. After that, the battles get longer and the definition of a duration of the battle is up to the analyst. Note the very dear and definite downward pattern of percent loses per day from the Napoleonic Wars through the Arab-Israeli Wars. Here is a very clear indication of the effects of dispersion. It would appear that from the 1600s to the 1800s the pattern was effectively constant and level, then declines in a very systematic pattern. This partially contradicts Trevor Dupuy’s writing and graphs (see Figure 1). It does appear that after this period of decline that the percent losses per day are being set at a new, much lower plateau. Percent losses per day by war is attached.

Looking at the actual subject of the dispersion of people (measured in people per kilometer of front) remained relatively constant from 1600 through the American Civil War (see Figure 5). Trevor Dupuy defined dispersion as the number of people in a box-like area. Unfortunately, l do not know how to measure that. lean clearly identify the left and right of a unit, but it is more difficult to tell how deep it is Furthermore, density of occupation of this box is far from uniform, with a very forward bias By the same token, fire delivered into this box is also not uniform, with a very forward bias. Therefore, l am quite comfortable measuring dispersion based upon unit frontage, more so than front multiplied by depth.

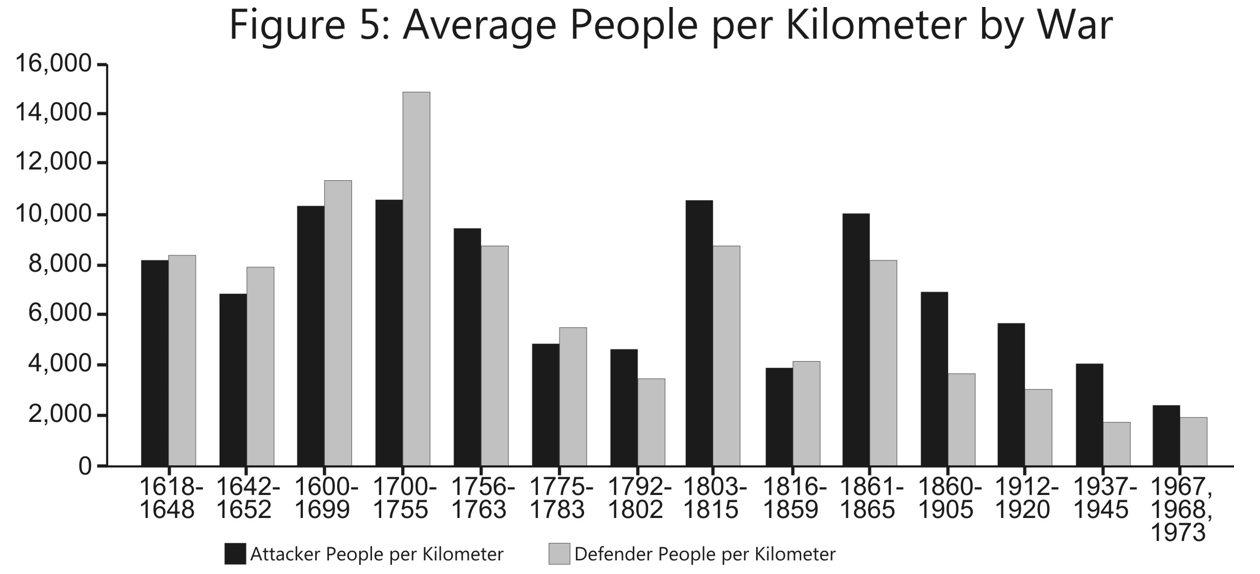
Note, when comparing the Napoleonic Wars to the American Civil War that the dispersion remains about the same. Yet, if you look at the average casualties (Figure 3) and the average percent casualties per day (Figure 4), it is clear that the rate of casualty accumulation is lower in the American Civil War (this again partially contradicts Dupuy‘s writings). There is no question that with the advent of the Minié ball, allowing for rapid-fire rifled muskets, the ability to deliver accurate firepower increased.

As you will also note, the average people per linear kilometer between WWI and WWII differs by a factor of a little over 1.5 to 1. Yet the actual difference in casualties (see Figure 4) is much greater. While one can just postulate that the difference is the change in dispersion squared (basically Dupuy‘s approach), this does not seem to explain the complete difference, especially the difference between the Napoleonic Wars and the Civil War.

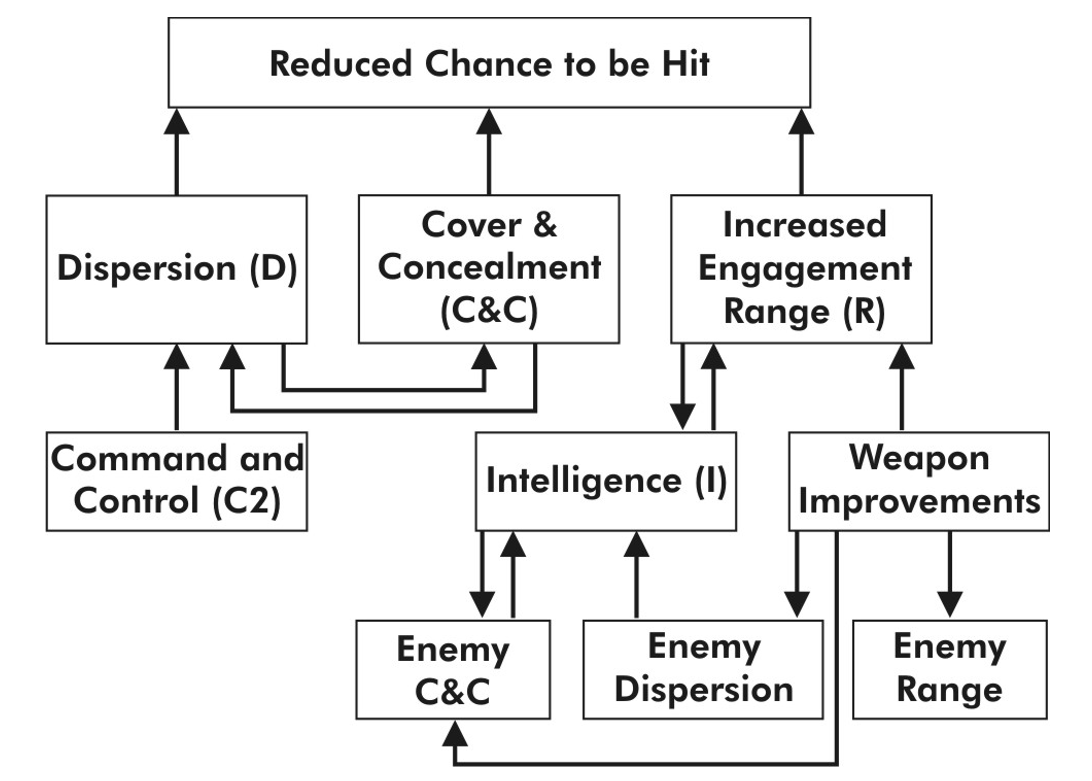
lnstead of discussing dispersion, we should be discussing “casualty reduction efforts.” This basically consists of three elements:

  • Dispersion (D)
  • Increased engagement ranges (R)
  • More individual use of cover and concealment (C&C).

These three factors together result in the reduced chance to hit. They are also partially interrelated, as one cannot make more individual use of cover and concealment unless one is allowed to disperse. So, therefore. The need for cover and concealment increases the desire to disperse and the process of dispersing allows one to use more cover and concealment.

Command and control are integrated into this construct as being something that allows dispersion, and dispersion creates the need for better command control. Therefore, improved command and control in this construct does not operate as a force modifier, but enables a force to disperse.

Intelligence becomes more necessary as the opposing forces use cover and concealment and the ranges of engagement increase. By the same token, improved intelligence allows you to increase the range of engagement and forces the enemy to use better concealment.

This whole construct could be represented by the diagram at the top of the next page.

Now, I may have said the obvious here, but this construct is probably provable in each individual element, and the overall outcome is measurable. Each individual connection between these boxes may also be measurable.

Therefore, to measure the effects of reduced chance to hit, one would need to measure the following formula (assuming these formulae are close to being correct):

(K * ΔD) + (K * ΔC&C) + (K * ΔR) = H

(K * ΔC2) = ΔD

(K * ΔD) = ΔC&C

(K * ΔW) + (K * ΔI) = ΔR

K = a constant
Δ = the change in….. (alias “Delta”)
D = Dispersion
C&C = Cover & Concealment
R = Engagement Range
W = Weapon’s Characteristics
H = the chance to hit
C2 = Command and control
I = Intelligence or ability to observe

Also, certain actions lead to a desire for certain technological and system improvements. This includes the effect of increased dispersion leading to a need for better C2 and increased range leading to a need for better intelligence. I am not sure these are measurable.

I have also shown in the diagram how the enemy impacts upon this. There is also an interrelated mirror image of this construct for the other side.

I am focusing on this because l really want to come up with some means of measuring the effects of a “revolution in warfare.” The last 400 years of human history have given us more revolutionary inventions impacting war than we can reasonably expect to see in the next 100 years. In particular, I would like to measure the impact of increased weapon accuracy, improved intelligence, and improved C2 on combat.

For the purposes of the TNDM, I would very specifically like to work out an attrition multiplier for battles before WWII (and theoretically after WWII) based upon reduced chance to be hit (“dispersion”). For example, Dave Bongard is currently using an attrition multiplier of 4 for his WWI engagements that he is running for the battalion-level validation data base.[3] No one can point to a piece of paper saying this is the value that should be used. Dave picked this value based upon experience and familiarity with the period.

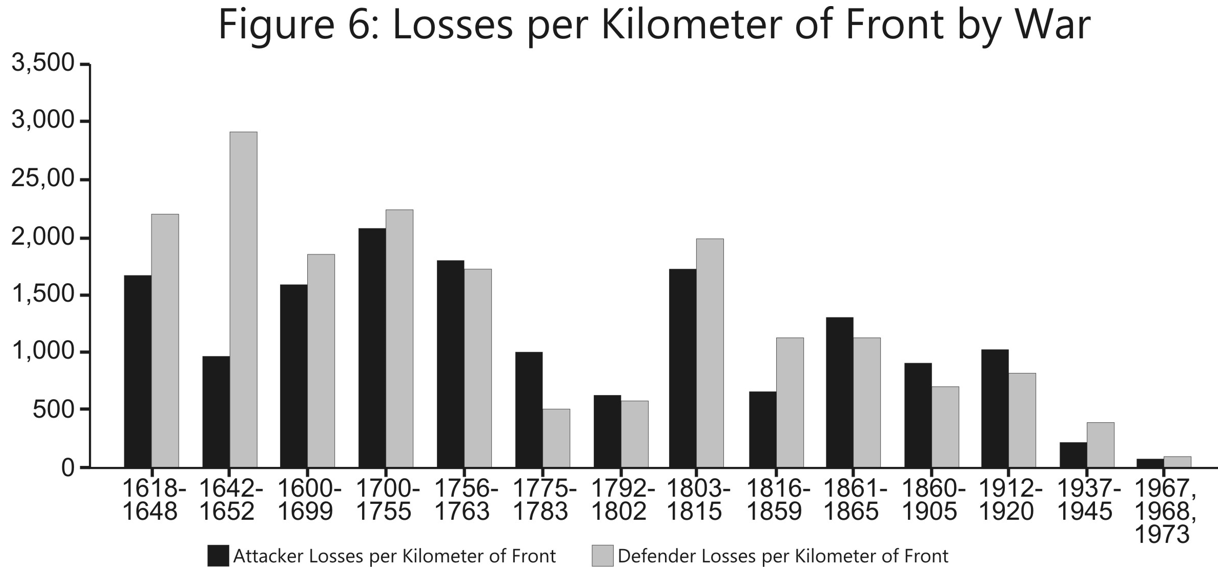
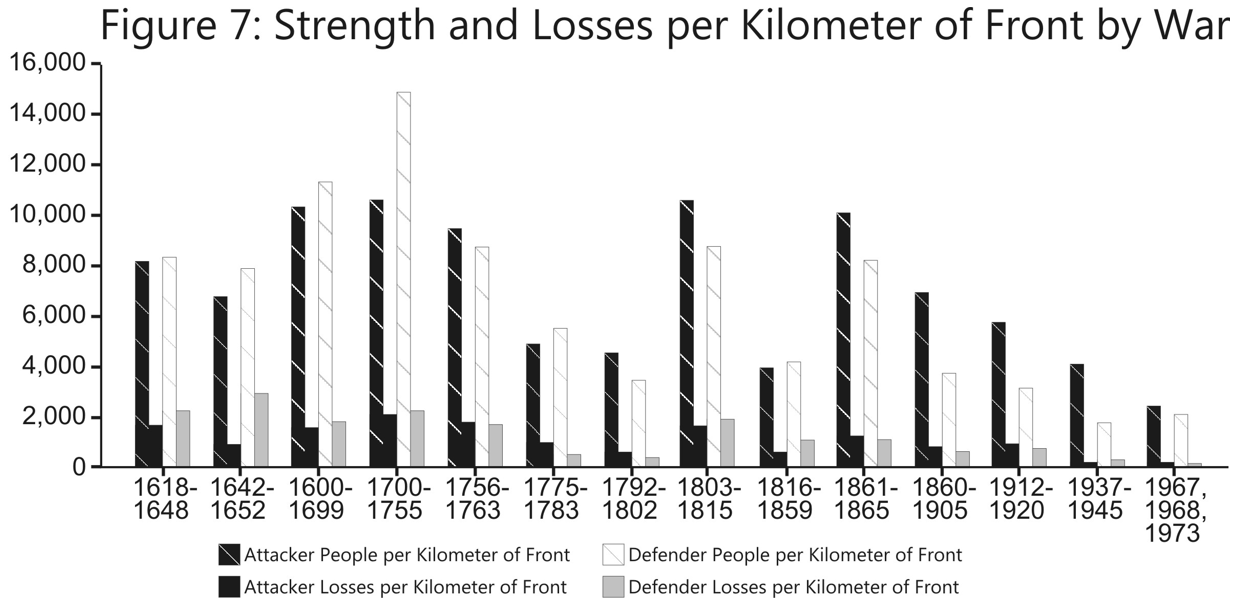
I have also attached Average Loses per Kilometer of Front by War (see Figure 6 above), and a summary chart showing the two on the same chart (see figure 7 above).

The values from these charts are:

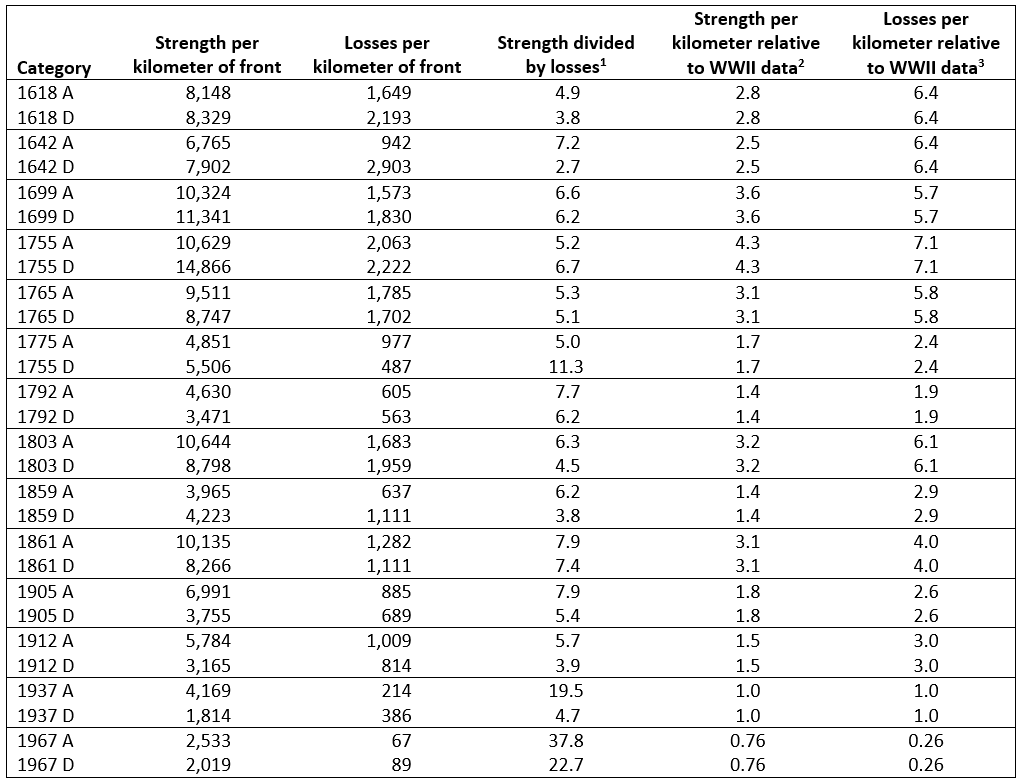
The TNDM sets WWII dispersion factor at 3,000 (which l gather translates into 30,000 men per square kilometer). The above data shows a linear dispersion per kilometer of 2,992 men, so this number parallels Dupuy‘s figures.

The final chart I have included is the Ratio of Strength and Losses per Kilometer of Front by War (Figure 8). Each line on the bar graph measures the average ratio of strength over casualties for either the attacker or defender. Being a ratio, unusual outcomes resulted in some really unusually high ratios. I took the liberty of taking out six

data points because they appeared unusually lop-sided. Three of these points are from the English Civil War and were way out of line with everything else. These were the three Scottish battles where you had a small group of mostly sword-armed troops defeating a “modem” army. Also, Walcourt (1689), Front Royal (1862), and Calbritto (1943) were removed. L also have included the same chart, except by century (Figure 9).
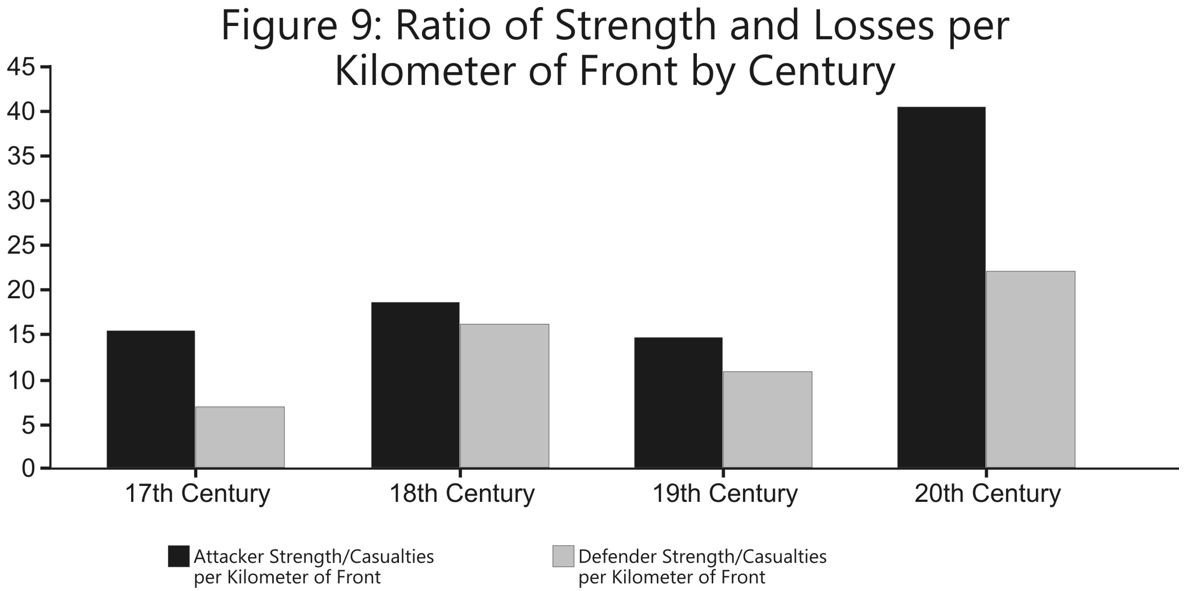
Again, one sees a consistency in results in over 300+ years of war, in this case going all the way through WWI, then sees an entirely different pattern with WWII and the Arab-Israeli Wars

A very tentative set of conclusions from all this is:

  1. Dispersion has been relatively constant and driven by factors other than firepower from 1600-1815.
  2. Since the Napoleonic Wars, units have increasingly dispersed (found ways to reduce their chance to be hit) in response to increased lethality of weapons.
  3. As a result of this increased dispersion, casualties in a given space have declined.
  4. The ratio of this decline in casualties over area have been roughly proportional to the strength over an area from 1600 through WWI. Starting with WWII, it appears that people have dispersed faster than weapons lethality, and this trend has continued.
  5. In effect, people dispersed in direct relation to increased firepower from 1815 through 1920, and then after that time dispersed faster than the increase in lethality.
  6. It appears that since WWII, people have gone back to dispersing (reducing their chance to be hit) at the same rate that firepower is increasing.
  7. Effectively, there are four patterns of casualties in modem war:

Period 1 (1600 – 1815): Period of Stability

  • Short battles
  • Short frontages
  • High attrition per day
  • Constant dispersion
  • Dispersion decreasing slightly after late 1700s
  • Attrition decreasing slightly after mid-1700s.

Period 2 (1816 – 1905): Period of Adjustment

  • Longer battles
  • Longer frontages
  • Lower attrition per day
  • Increasing dispersion
  • Dispersion increasing slightly faster than lethality

Period 3 (1912 – 1920): Period of Transition

  • Long Battles
  • Continuous Frontages
  • Lower attrition per day
  • Increasing dispersion
  • Relative lethality per kilometer similar to past, but lower
  • Dispersion increasing slightly faster than lethality

Period 4 (1937 – present): Modern Warfare

  • Long Battles
  • Continuous Frontages
  • Low Attrition per day
  • High dispersion (perhaps constant?)
  • Relatively lethality per kilometer much lower than the past
  • Dispersion increased much faster than lethality going into the period.
  • Dispersion increased at the same rate as lethality within the period.

So the question is whether warfare of the next 50 years will see a new “period of adjustment,” where the rate of dispersion (and other factors) adjusts in direct proportion to increased lethality, or will there be a significant change in the nature of war?

Note that when l use the word “dispersion” above, l often mean “reduced chance to be hit,” which consists of dispersion, increased engagement ranges, and use of cover & concealment.

One of the reasons l wandered into this subject was to see if the TNDM can be used for predicting combat before WWII. l then spent the next few days attempting to find some correlation between dispersion and casualties. Using the data on historical dispersion provided above, l created a mathematical formulation and tested that against the actual historical data points, and could not get any type of fit.

I then locked at the length of battles over time, at one-day battles, and attempted to find a pattern. I could find none. I also looked at other permutations, but did not keep a record of my attempts. I then looked through the work done by Dean Hartley (Oakridge) with the LWDB and called Paul Davis (RAND) to see if there was anyone who had found any correlation between dispersion and casualties, and they had not noted any.

It became clear to me that if there is any such correlation, it is buried so deep in the data that it cannot be found by any casual search. I suspect that I can find a mathematical correlation between weapon lethality, reduced chance to hit (including dispersion), and casualties. This would require some improvement to the data, some systematic measure of weapons lethality, and some serious regression analysis. I unfortunately cannot pursue this at this time.

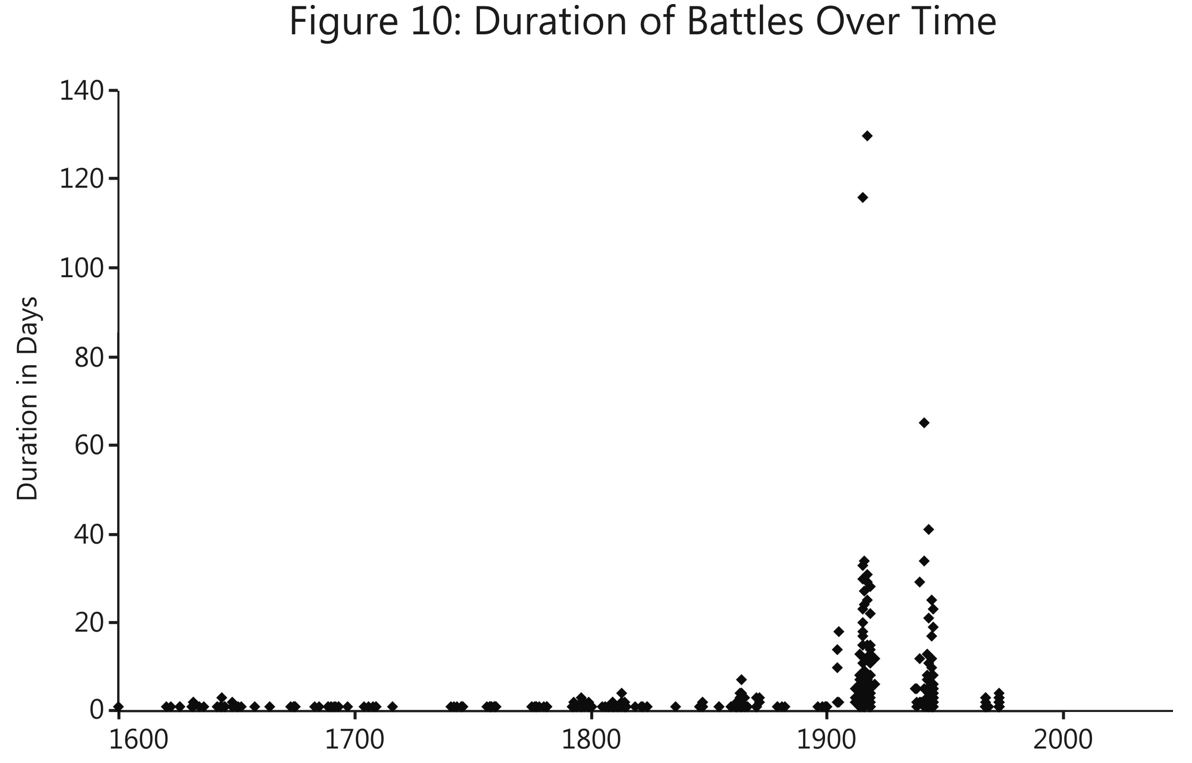
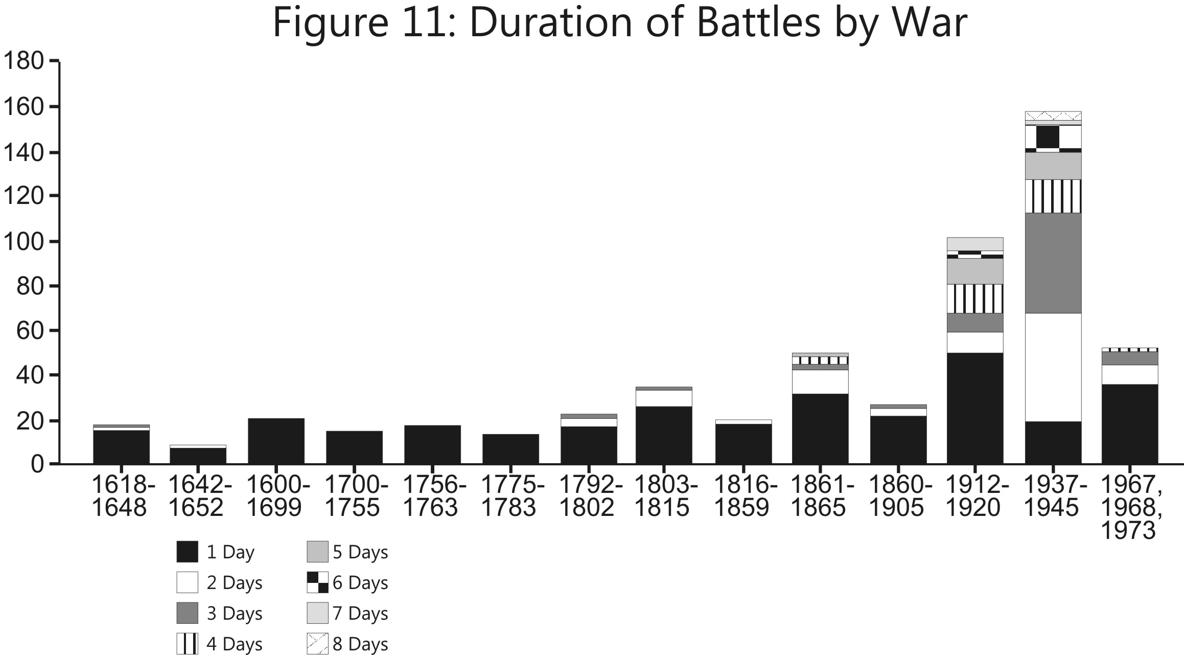
Finally, for reference, l have attached two charts showing the duration of the battles in the LWDB in days (Figure 10, Duration of Battles Over Time and Figure 11, A Count of the Duration of Battles by War).

NOTES

[1] The Tactical Numerical Deterministic Model, a combat model developed by Trevor Dupuy in 1990-1991 as the follow-up to his Quantified Judgement Model. Dr. James G. Taylor and Jose Perez also contributed to the TNDM’s development.

[2] TDI’s Land Warfare Database (LWDB) was a revised version of a database created by the Historical Evaluation Research Organization (HERO) for the then-U.S. Army Concepts and Analysis Agency (now known as the U.S. Army Center for Army Analysis (CAA)) in 1984. Since the original publication of this article, TDI expanded and revised the data into a suite of databases.

[3] This matter is discussed in Christopher A. Lawrence, “The Second Test of the TNDM Battalion-Level Validations: Predicting Casualties,” The International TNDM Newsletter, April 1997, pp. 40-50.

TDI Friday Read: Principles Of War & Verities Of Combat

[izquotes.com]

Trevor Dupuy distilled his research and analysis on combat into a series of verities, or what he believed were empirically-derived principles. He intended for his verities to complement the classic principles of war, a slightly variable list of maxims of unknown derivation and provenance, which describe the essence of warfare largely from the perspective of Western societies. These are summarized below.

What Is The Best List Of The Principles Of War?

The Timeless Verities of Combat

Trevor N. Dupuy’s Combat Attrition Verities

Trevor Dupuy’s Combat Advance Rate Verities

Military History and Validation of Combat Models

Soldiers from Britain’s Royal Artillery train in a “virtual world” during Exercise Steel Sabre, 2015 [Sgt Si Longworth RLC (Phot)/MOD]

Military History and Validation of Combat Models

A Presentation at MORS Mini-Symposium on Validation, 16 Oct 1990

By Trevor N. Dupuy

In the operations research community there is some confusion as to the respective meanings of the words “validation” and “verification.” My definition of validation is as follows:

“To confirm or prove that the output or outputs of a model are consistent with the real-world functioning or operation of the process, procedure, or activity which the model is intended to represent or replicate.”

In this paper the word “validation” with respect to combat models is assumed to mean assurance that a model realistically and reliably represents the real world of combat. Or, in other words, given a set of inputs which reflect the anticipated forces and weapons in a combat encounter between two opponents under a given set of circumstances, the model is validated if we can demonstrate that its outputs are likely to represent what would actually happen in a real-world encounter between these forces under those circumstances

Thus, in this paper, the word “validation” has nothing to do with the correctness of computer code, or the apparent internal consistency or logic of relationships of model components, or with the soundness of the mathematical relationships or algorithms, or with satisfying the military judgment or experience of one individual.

True validation of combat models is not possible without testing them against modern historical combat experience. And so, in my opinion, a model is validated only when it will consistently replicate a number of military history battle outcomes in terms of: (a) Success-failure; (b) Attrition rates; and (c) Advance rates.

“Why,” you may ask, “use imprecise, doubtful, and outdated history to validate a modem, scientific process? Field tests, experiments, and field exercises can provide data that is often instrumented, and certainly more reliable than any historical data.”

I recognize that military history is imprecise; it is only an approximate, often biased and/or distorted, and frequently inconsistent reflection of what actually happened on historical battlefields. Records are contradictory. I also recognize that there is an element of chance or randomness in human combat which can produce different results in otherwise apparently identical circumstances. I further recognize that history is retrospective, telling us only what has happened in the past. It cannot predict, if only because combat in the future will be fought with different weapons and equipment than were used in historical combat.

Despite these undoubted problems, military history provides more, and more accurate information about the real world of combat, and how human beings behave and perform under varying circumstances of combat, than is possible to derive or compile from arty other source. Despite some discrepancies, patterns are unmistakable and consistent. There is always a logical explanation for any individual deviations from the patterns. Historical examples that are inconsistent, or that are counter-intuitive, must be viewed with suspicion as possibly being poor or false history.

Of course absolute prediction of a future event is practically impossible, although not necessarily so theoretically. Any speculations which we make from tests or experiments must have some basis in terms of projections from past experience.

Training or demonstration exercises, proving ground tests, field experiments, all lack the one most pervasive and most important component of combat: Fear in a lethal environment. There is no way in peacetime, or non-battlefield, exercises, test, or experiments to be sure that the results are consistent with what would have been the behavior or performance of individuals or units or formations facing hostile firepower on a real battlefield.

We know from the writings of the ancients (for instance Sun Tze—pronounced Sun Dzuh—and Thucydides) that have survived to this day that human nature has not changed since the dawn of history. The human factor the way in which humans respond to stimuli or circumstances is the most important basis for speculation and prediction. What about the “scientific” approach of those who insist that we cart have no confidence in the accuracy or reliability of historical data, that it is therefore unscientific, and therefore that it should be ignored? These people insist that only “scientific” data should be used in modeling.

In fact, every model is based upon fundamental assumptions that are intuitive and unprovable. The first step in the creation of a model is a step away from scientific reality in seeking a basis for an unreal representation of a real phenomenon. I have shown that the unreality is perpetuated when we use other imitations of reality as the basis for representing reality. History is less than perfect, but to ignore it, and to use only data that is bound to be wrong, assures that we will not be able to represent human behavior in real combat.

At the risk of repetition, and even of protesting too much, let me assure you that I am well aware of the shortcomings of military history:

The record which is available to us, which is history, only approximately reflects what actually happened. It is incomplete. It is often biased, it is often distorted. Even when it is accurate, it may be reflecting chance rather than normal processes. It is neither precise nor consistent. But, it provides more, and more accurate, information on the real world of battle than is available from the most thoroughly documented field exercises, proving ground less, or laboratory or field experiments.

Military history is imperfect. At best it reflects the actions and interactions of unpredictable human beings. We must always realize that a single historical example can be misleading for either of two reasons: (1) The data may be inaccurate, or (2) The data may be accurate, but untypical.

Nevertheless, history is indispensable. I repeat that the most pervasive characteristic of combat is fear in a lethal environment. For all of its imperfections, military history and only military history represents what happens under the environmental condition of fear.

Unfortunately, and somewhat unfairly, the reported findings of S.L.A. Marshall about human behavior in combat, which he reported in Men Against Fire, have been recently discounted by revisionist historians who assert that he never could have physically performed the research on which the book’s findings were supposedly based. This has raised doubts about Marshall’s assertion that 85% of infantry soldiers didn’t fire their weapons in combat in World War ll. That dramatic and surprising assertion was first challenged in a New Zealand study which found, on the basis of painstaking interviews, that most New Zealanders fired their weapons in combat. Thus, either Americans were different from New Zealanders, or Marshall was wrong. And now American historians have demonstrated that Marshall had had neither the time nor the opportunity to conduct his battlefield interviews which he claimed were the basis for his findings.

I knew Marshall, moderately well. I was fully as aware of his weaknesses as of his strengths. He was not a historian. I deplored the imprecision and lack of documentation in Men Against Fire. But the revisionist historians have underestimated the shrewd journalistic assessment capability of “SLAM” Marshall. His observations may not have been scientifically precise, but they were generally sound, and his assessment has been shared by many American infantry officers whose judgements l also respect. As to the New Zealand study, how many people will, after the war, admit that they didn’t fire their weapons?

Perhaps most important, however, in judging the assessments of SLAM Marshall, is a recent study by a highly-respected British operations research analyst, David Rowland. Using impeccable OR methods Rowland has demonstrated that Marshall’s assessment of the inefficient performance, or non-performance, of most soldiers in combat was essentially correct. An unclassified version of Rowland’s study, “Assessments of Combat Degradation,” appeared in the June 1986 issue of the Royal United Services Institution Journal.

Rowland was led to his investigations by the fact that soldier performance in field training exercises, using the British version of MILES technology, was not consistent with historical experience. Even after allowances for degradation from theoretical proving ground capability of weapons, defensive rifle fire almost invariably stopped any attack in these field trials. But history showed that attacks were often in fact, usually successful. He therefore began a study in which he made both imaginative and scientific use of historical data from over 100 small unit battles in the Boer War and the two World Wars. He demonstrated that when troops are under fire in actual combat, there is an additional degradation of performance by a factor ranging between 10 and 7. A degradation virtually of an order of magnitude! And this, mind you, on top of a comparable built-in degradation to allow for the difference between field conditions and proving ground conditions.

Not only does Rowland‘s study corroborate SLAM Marshall’s observations, it showed conclusively that field exercises, training competitions and demonstrations, give results so different from real battlefield performance as to render them useless for validation purposes.

Which brings us back to military history. For all of the imprecision, internal contradictions, and inaccuracies inherent in historical data, at worst the deviations are generally far less than a factor of 2.0. This is at least four times more reliable than field test or exercise results.

I do not believe that history can ever repeat itself. The conditions of an event at one time can never be precisely duplicated later. But, bolstered by the Rowland study, I am confident that history paraphrases itself.

If large bodies of historical data are compiled, the patterns are clear and unmistakable, even if slightly fuzzy around the edges. Behavior in accordance with this pattern is therefore typical. As we have already agreed, sometimes behavior can be different from the pattern, but we know that it is untypical, and we can then seek for the reason, which invariably can be discovered.

This permits what l call an actuarial approach to data analysis. We can never predict precisely what will happen under any circumstances. But the actuarial approach, with ample data, provides confidence that the patterns reveal what is to happen under those circumstances, even if the actual results in individual instances vary to some extent from this “norm” (to use the Soviet military historical expression.).

It is relatively easy to take into account the differences in performance resulting from new weapons and equipment. The characteristics of the historical weapons and the current (or projected) weapons can be readily compared, and adjustments made accordingly in the validation procedure.

In the early 1960s an effort was made at SHAPE Headquarters to test the ATLAS Model against World War II data for the German invasion of Western Europe in May, 1940. The first excursion had the Allies ending up on the Rhine River. This was apparently quite reasonable: the Allies substantially outnumbered the Germans, they had more tanks, and their tanks were better. However, despite these Allied advantages, the actual events in 1940 had not matched what ATLAS was now predicting. So the analysts did a little “fine tuning,” (a splendid term for fudging). Alter the so-called adjustments, they tried again, and ran another excursion. This time the model had the Allies ending up in Berlin. The analysts (may the Lord forgive them!) were quite satisfied with the ability of ATLAS to represent modem combat. (Or at least they said so.) Their official conclusion was that the historical example was worthless, since weapons and equipment had changed so much in the preceding 20 years!

As I demonstrated in my book, Options of Command, the problem was that the model was unable to represent the German strategy, or to reflect the relative combat effectiveness of the opponents. The analysts should have reached a different conclusion. ATLAS had failed validation because a model that cannot with reasonable faithfulness and consistency replicate historical combat experience, certainly will be unable validly to reflect current or future combat.

How then, do we account for what l have said about the fuzziness of patterns, and the fact that individual historical examples may not fit the patterns? I will give you my rules of thumb:

  1. The battle outcome should reflect historical success-failure experience about four times out of five.
  2. For attrition rates, the model average of five historical scenarios should be consistent with the historical average within a factor of about 1.5.
  3. For the advance rates, the model average of five historical scenarios should be consistent with the historical average within a factor of about 1.5.

Just as the heavens are the laboratory of the astronomer, so military history is the laboratory of the soldier and the military operations research analyst. The scientific basis for both astronomy and military science is the recording of the movements and relationships of bodies, and then analysis of those movements. (In the one case the bodies are heavenly, in the other they are very terrestrial.)

I repeat: Military history is the laboratory of the soldier. Failure of the analyst to use this laboratory will doom him to live with the scientific equivalent of Ptolomean astronomy, whereas he could use the evidence available in his laboratory to progress to the military science equivalent of Copernican astronomy.

Human Factors In Warfare: Combat Effectiveness

An Israeli tank unit crosses the Sinai, heading for the Suez Canal, during the 1973 Arab-Israeli War [Israeli Government Press Office/HistoryNet]

It has been noted throughout the history of human conflict that some armies have consistently fought more effectively on the battlefield than others. The armies of Sparta in ancient Greece, for example, have come to epitomize the warrior ideal in Western societies. Rome’s legions have acquired a similar legendary reputation. Within armies too, some units are known to be superior combatants than others. The U.S. 1st Infantry Division, the British Expeditionary Force of 1914, Japan’s Special Naval Landing Forces, the U.S. Marine Corps, the German 7th Panzer Division, and the Soviet Guards divisions are among the many superior fighting forces from history.

Trevor Dupuy found empirical substantiation of this in his analysis of historical combat data. He discovered that in 1943-1944 during World War II, after accounting for environmental and operational factors, the German Army consistently performed more effectively in ground combat than the U.S. and British armies. This advantage—measured in terms of casualty exchanges, terrain held or lost, and mission accomplishment—manifested whether the Germans were attacking or defending, or winning or losing. Dupuy observed that the Germans demonstrated an even more marked effectiveness in battle against the Soviet Army throughout the war.

He found the same disparity in battlefield effectiveness in combat data on the 1967 and 1973 Arab-Israeli wars. The Israeli Army performed uniformly better in ground combat over all of the Arab armies it faced in both conflicts, regardless of posture or outcome.

The clear and consistent patterns in the historical data led Dupuy to conclude that superior combat effectiveness on the battlefield was attributable to moral and behavioral (i.e. human) factors. Those factors he believed were the most important contributors to combat effectiveness were:

  • Leadership
  • Training or Experience
  • Morale, which may or may not include
  • Cohesion

Although the influence of human factors on combat effectiveness was identifiable and measurable in the aggregate, Dupuy was skeptical whether all of the individual moral and behavioral intangibles could be discreetly quantified. He thought this particularly true for a set of factors that also contributed to combat effectiveness, but were a blend of human and operational factors. These include:

  • Logistical effectiveness
  • Time and Space
  • Momentum
  • Technical Command, Control, Communications
  • Intelligence
  • Initiative
  • Chance

Dupuy grouped all of these intangibles together into a composite factor he designated as relative combat effectiveness value, or CEV. The CEV, along with environmental and operational factors (Vf), comprise the Circumstantial Variables of Combat, which when multiplied by force strength (S), determines the combat power (P) of a military force in Dupuy’s formulation.

P = S x Vf x CEV

Dupuy did not believe that CEVs were static values. As with human behavior, they vary somewhat from engagement to engagement. He did think that human factors were the most substantial of the combat variables. Therefore any model or theory of combat that failed to account for them would invariably be inaccurate.

NOTES

This post is drawn from Trevor N. Dupuy, Numbers, Predictions and War: Using History to Evaluate Combat Factors and Predict the Outcome of Battles (Indianapolis; New York: The Bobbs-Merrill Co., 1979), Chapters 5, 7 and 9; Trevor N. Dupuy, Understanding War: History and Theory of Combat (New York: Paragon House, 1987), Chapters 8 and 10; and Trevor N. Dupuy, “The Fundamental Information Base for Modeling Human Behavior in Combat, ” presented at the Military Operations Research Society (MORS) Mini-Symposium, “Human Behavior and Performance as Essential Ingredients in Realistic Modeling of Combat – MORIMOC II,” 22-24 February 1989, Center for Naval Analyses, Alexandria, Virginia.

Human Factors In Warfare: Interaction Of Variable Factors

The Second Battle of Ypres, 22 April to 25 May 1915 by Richard Jack [Canadian War Museum]

Trevor Dupuy thought that it was possible to identify and quantify the effects of some individual moral and behavioral (i.e. human) factors on combat. He also believed that many of these factors interacted with each other and with environmental and operational (i.e. physical) variables in combat as well, although parsing and quantifying these effects was a good deal more difficult. Among the combat phenomena he considered to be the result of interaction with human factors were:

Dupuy was critical of combat models and simulations that failed to address these relationships. The prevailing approach to the design of combat modeling used by the U.S. Department of Defense is known as the aggregated, hierarchical, or “bottom-up” construct. Bottom-up models generally use the Lanchester equations, or some variation on them, to calculate combat outcomes between individual soldiers, tanks, airplanes, and ships. These results are then used as inputs for models representing warfare at the brigade/division level, the outputs of which are then fed into theater-level simulations. Many in the American military operations research community believe bottom-up models to be the most realistic method of modeling combat.

Dupuy criticized this approach for many reasons (including the inability of the Lanchester equations to accurately replicate real-world combat outcomes), but mainly because it failed to represent human factors and their interactions with other combat variables.

It is almost undeniable that there must be some interaction among and within the effects of physical as well as behavioral variable factors. I know of no way of measuring this. One thing that is reasonably certain is that the use of the bottom-up approach to model design and development cannot capture such interactions. (Most models in use today are bottom-up models, built up from one-on-one weapons interactions to many-on-many.) Presumably these interactions are captured in a top-down model derived from historical experience, of which there is at least one in existence [by which, Dupuy meant his own].

Dupuy was convinced that any model of combat that failed to incorporate human factors would invariably be inaccurate, which put him at odds with much of the American operations research community.

War does not consist merely of a number of duels. Duels, in fact, are only a very small—though integral—part of combat. Combat is a complex process involving interaction over time of many men and numerous weapons combined in a great number of different, and differently organized, units. This process cannot be understood completely by considering the theoretical interactions of individual men and weapons. Complete understanding requires knowing how to structure such interactions and fit them together. Learning how to structure these interactions must be based on scientific analysis of real combat data.[1]

While this unresolved debate went dormant some time ago, bottom-up models became the simulations of choice in Defense Department campaign planning and analysis. It should be noted, however, that the Defense Department disbanded its campaign-level modeling capabilities in 2011 because the use of the simulations in strategic analysis was criticized as “slow, manpower-intensive, opaque, difficult to explain because of its dependence on complex models, inflexible, and weak in dealing with uncertainty.”

NOTES

[1] Trevor N. Dupuy, Understanding War: History and Theory of Combat (New York: Paragon House, 1987), p. 195.

Human Factors In Warfare: Diminishing Returns In Combat

[Jan Spousta; Wikimedia Commons]

One of the basic problems facing military commanders at all levels is deciding how to allocate available forces to accomplish desired objectives. A guiding concept in this sort of decision-making is economy of force, one of the fundamental and enduring principles of war. As defined in the 1954 edition of U.S. Army Field Manual FM 100-5, Field Service Regulations, Operations (which Trevor Dupuy believed contained the best listing of the principles):

Economy of Force

Minimum essential means must be employed at points other than that of decision. To devote means to unnecessary secondary efforts or to employ excessive means on required secondary efforts is to violate the principle of both mass and the objective. Limited attacks, the defensive, deception, or even retrograde action are used in noncritical areas to achieve mass in the critical area.

How do leaders determine the appropriate means for accomplishing a particular mission? The risk of failing to assign too few forces to a critical task is self-evident, but is it possible to allocate too many? Determining the appropriate means in battle has historically involved subjective calculations by commanders and their staff advisors of the relative combat power of friendly and enemy forces. Most often, it entails a rudimentary numerical comparison of numbers of troops and weapons and estimates of the influence of environmental and operational factors. An exemplar of this is the so-called “3-1 rule,” which holds that an attacking force must achieve a three to one superiority in order to defeat a defending force.

Through detailed analysis of combat data from World War II and the 1967 and 1973 Arab-Israeli wars, Dupuy determined that combat appears subject to a law of diminishing returns and that it is indeed possible to over-allocate forces to a mission.[1] By comparing the theoretical outcomes of combat engagements with the actual results, Dupuy discovered that a force with a combat power advantage greater than double that of its adversary seldom achieved proportionally better results than a 2-1 advantage. A combat power superiority of 3 or 4 to 1 rarely yielded additional benefit when measured in terms of casualty rates, ground gained or lost, and mission accomplishment.

Dupuy also found that attackers sometimes gained marginal benefits from combat power advantages greater than 2-1, though less proportionally and economically than the numbers of forces would suggest. Defenders, however, received no benefit at all from a combat power advantage beyond 2-1.

Two human factors contributed to this apparent force limitation, Dupuy believed, Clausewitzian friction and breakpoints. As described in a previous post, friction accumulates on the battlefield through the innumerable human interactions between soldiers, degrading combat performance. This phenomenon increases as the number of soldiers increases.

A breakpoint represents a change of combat posture by a unit on the battlefield, for example, from attack to defense, or from defense to withdrawal. A voluntary breakpoint occurs due to mission accomplishment or a commander’s order. An involuntary breakpoint happens when a unit spontaneously ceases an attack, withdraws without orders, or breaks and routs. Involuntary breakpoints occur for a variety of reasons (though contrary to popular wisdom, seldom due to casualties). Soldiers are not automatons and will rarely fight to the death.

As Dupuy summarized,

It is obvious that the law of diminishing returns applies to combat. The old military adage that the greater the superiority the better, is not necessarily true. In the interests of economy of force, it appears to be unnecessary, and not really cost-effective, to build up a combat power superiority greater than two-to-one. (Note that this is not the same as a numerical superiority of two-to-one.)[2] Of course, to take advantage of this phenomenon, it is essential that a commander be satisfied that he has a reliable basis for calculating relative combat power. This requires an ability to understand and use “combat multipliers” with greater precision than permitted by U.S. Army doctrine today.[3] [Emphasis added.]

NOTES

[1] This section is drawn from Trevor N. Dupuy, Understanding War: History and Theory of Combat (New York: Paragon House, 1987), Chapter 11.

[2] This relates to Dupuy’s foundational conception of combat power, which is clearly defined and explained in Understanding War, Chapter 8.

[3] Dupuy, Understanding War, p. 139.

Combat Readiness And The U.S. Army’s “Identity Crisis”

Servicemen of the U.S. Army’s 173rd Airborne Brigade Combat Team (standing) train Ukrainian National Guard members during a joint military exercise called “Fearless Guardian 2015,” at the International Peacekeeping and Security Center near the western village of Starychy, Ukraine, on May 7, 2015. [Newsweek]

Last week, Wesley Morgan reported in POLITICO about an internal readiness study recently conducted by the U.S. Army 173rd Airborne Infantry Brigade Combat Team. As U.S. European Command’s only airborne unit, the 173rd Airborne Brigade has been participating in exercises in the Baltic States and the Ukraine since 2014 to demonstrate the North Atlantic Treaty Organization’s (NATO) resolve to counter potential Russian aggression in Eastern Europe.

The experience the brigade gained working with Baltic and particularly Ukrainian military units that had engaged with Russian and Russian-backed Ukrainian Separatist forces has been sobering. Colonel Gregory Anderson, the 173rd Airborne Brigade commander, commissioned the study as a result. “The lessons we learned from our Ukrainian partners were substantial. It was a real eye-opener on the absolute need to look at ourselves critically,” he told POLITICO.

The study candidly assessed that the 173rd Airborne Brigade currently lacked “essential capabilities needed to accomplish its mission effectively and with decisive speed” against near-peer adversaries or sophisticated non-state actors. Among the capability gaps the study cited were

  • The lack of air defense and electronic warfare units and over-reliance on satellite communications and Global Positioning Systems (GPS) navigation systems;
  • simple countermeasures such as camouflage nets to hide vehicles from enemy helicopters or drones are “hard-to-find luxuries for tactical units”;
  • the urgent need to replace up-armored Humvees with the forthcoming Ground Mobility Vehicle, a much lighter-weight, more mobile truck; and
  • the likewise urgent need to field the projected Mobile Protected Firepower armored vehicle companies the U.S. Army is planning to add to each infantry brigade combat team.

The report also stressed the vulnerability of the brigade to demonstrated Russian electronic warfare capabilities, which would likely deprive it of GPS navigation and targeting and satellite communications in combat. While the brigade has been purchasing electronic warfare gear of its own from over-the-counter suppliers, it would need additional specialized personnel to use the equipment.

As analyst Adrian Bonenberger commented, “The report is framed as being about the 173rd, but it’s really about more than the 173rd. It’s about what the Army needs to do… If Russia uses electronic warfare to jam the brigade’s artillery, and its anti-tank weapons can’t penetrate any of the Russian armor, and they’re able to confuse and disrupt and quickly overwhelm those paratroopers, we could be in for a long war.”

While the report is a wake-up call with regard to the combat readiness in the short-term, it also pointedly demonstrates the complexity of the strategic “identity crisis” that faces the U.S. Army in general. Many of the 173rd Airborne Brigade’s current challenges can be traced directly to the previous decade and a half of deployments conducting wide area security missions during counterinsurgency operations in Iraq and Afghanistan. The brigade’s perceived shortcomings for combined arms maneuver missions are either logical adaptations to the demands of counterinsurgency warfare or capabilities that atrophied through disuse.

The Army’s specific lack of readiness to wage combined arms maneuver warfare against potential peer or near-peer opponents in Europe can be remedied given time and resourcing in the short-term. This will not solve the long-term strategic conundrum the Army faces in needing to be prepared to fight conventional and irregular conflicts at the same time, however. Unless the U.S. is willing to 1) increase defense spending to balance force structure to the demands of foreign and military policy objectives, or 2) realign foreign and military policy goals with the available force structure, it will have to resort to patching up short-term readiness issues as best as possible and continue to muddle through. Given the current state of U.S. domestic politics, muddling through will likely be the default option unless or until the consequences of doing so force a change.

Human Factors In Warfare: Friction

The Prussian military philosopher Carl von Clausewitz identified the concept of friction in warfare in his book On War, published in 1832.

Everything in war is very simple, but the simplest thing is difficult. The difficulties accumulate and end by producing a kind of friction that is inconceivable unless one has experienced war… Countless minor incidents—the kind you can never really foresee—combine to lower the general level of performance, so that one always falls far short of the intended goal… Friction is the only concept that more or less corresponds to the factors that distinguish real war from war on paper… None of [the military machine’s] components is of one piece: each part is composed of individuals, every one of whom retains his potential of friction [and] the least important of whom may chance to delay things or somehow make them go wrong…

[Carl von Clausewitz, On War, Edited and translated by Michael Howard and Peter Paret (Princeton, NJ: Princeton University Press, 1984). Book One, Chapter 7, 119-120.]

While recognizing this hugely significant intangible element, Clausewitz also asserted that “[F]riction…brings about effects that cannot be measured, just they are largely due to chance.” Nevertheless, the clearly self-evident nature of friction in warfare subsequently led to the assimilation of the concept into the thinking of most military theorists and practitioners.

Flash forward 140 years or so. While listening to a lecture on combat simulation, Trevor Dupuy had a flash of insight that led him to conclude that it was indeed possible to measure the effects of friction.[1] Based on his work with historical combat data, Dupuy knew that smaller-sized combat forces suffer higher casualty rates than do larger-sized forces. As the diagram at the top demonstrates, this is partly explained by the fact that small units have a much higher proportion of their front line troops exposed to hostile fire than large units.

However, this relationship can account for only a fraction of friction’s total effect. The average exposure of a company of 200 soldiers is about seven times greater than an army group of 100,000. Yet, casualty rates for a company in intensive combat can be up to 70 times greater than that of an army group. This discrepancy clearly shows the influence of another factor at work.

Dupuy hypothesized that this reflected the apparent influence of the relationship between dispersion, deployment, and friction on combat. As friction in combat accumulates through the aggregation of soldiers into larger-sized units, its effects degrade the lethal effects of weapons from their theoretical maximum. Dupuy calculated that friction affects a force of 100,000 ten times more than it does a unit of 200. Being an ambient, human factor on the battlefield, higher quality forces do a better job of managing friction’s effects than do lower quality ones.

After looking at World War II combat casualty data to calculate the effect of friction on combat, Dupuy looked at casualty rates from earlier eras and found a steady correlation, which he believed further validated his hypothesis.

Despite the consistent fit of the data, Dupuy felt that his work was only the beginning of a proper investigation into the phenomenon.

During the periods of actual combat, the lower the level, the closer the loss rates will approach the theoretical lethalities of the weapons in the hands of the opposing combatants. But there will never be a very close relationship of such rates with the theoretical lethalities. War does not consist merely of a number of duels. Duels, in fact, are only a very small—though integral—part of combat. Combat is a complex process involving interaction over time of many men and numerous weapons combined in a great number of different, and differently organized, units. This process cannot be understood completely by considering the theoretical interactions of individual men and weapons. Complete understanding requires knowing how to structure such interactions and fit them together. Learning how to structure these interactions must be based on scientific analysis of real combat data.

NOTES

[1] This post is based on Trevor N. Dupuy, Understanding War: History and Theory of Combat (New York: Paragon House, 1987), Chapter 14.

War By Numbers Published

Christopher A. Lawrence, War by Numbers Understanding Conventional Combat (Lincoln, NE: Potomac Books, 2017) 390 pages, $39.95

War by Numbers assesses the nature of conventional warfare through the analysis of historical combat. Christopher A. Lawrence (President and Executive Director of The Dupuy Institute) establishes what we know about conventional combat and why we know it. By demonstrating the impact a variety of factors have on combat he moves such analysis beyond the work of Carl von Clausewitz and into modern data and interpretation.

Using vast data sets, Lawrence examines force ratios, the human factor in case studies from World War II and beyond, the combat value of superior situational awareness, and the effects of dispersion, among other elements. Lawrence challenges existing interpretations of conventional warfare and shows how such combat should be conducted in the future, simultaneously broadening our understanding of what it means to fight wars by the numbers.

The book is available in paperback directly from Potomac Books and in paperback and Kindle from Amazon.

Human Factors In Warfare: Fatigue

Tom Lea, “The 2,000 Yard Stare” 1944 [Oil on canvas, 36 x 28 Life Collection of Art WWII, U.S. Army Center of Military History, Fort Belvoir, Virginia]

That idea that fatigue is a human factor in combat seems relatively uncontroversial. Military history is replete with examples of how the limits of human physical and mental endurance have affected the character of fighting and the outcome of battles. Perhaps the most salient aspect of military training is preparing soldiers to deal with the rigors of warfare.

Trevor Dupuy was aware that fatigue has a degrading effect on the effectiveness of troops in combat, but he never was able to study the topic specifically himself. He was aware of other examinations of historical experience that were relevant to the issue.

The effectiveness of a military force declines steadily every day that it is engaged in sustained combat. This is an indication that fear has a physical effect on human beings equitable with severe exertion. S.L.A. Marshall documented this extremely well in a report that he wrote a few years before he died. I shall shortly have more to say about S.L.A. Marshall…

An approximate value for the daily effect of fatigue upon the effectiveness of weapons employment emerged from a HERO study several years ago. There is no question that fatigue has a comparable degrading effect upon the ability of a force to advance. I know of no research to ascertain that effect. Until such research is performed, I have arbitrarily assumed that the degrading effect of fatigue upon advance rates is the same as its degrading effect upon weapons effectiveness. To those who might be shocked at such an assumption, my response is: We know there is an effect; it is better to use a crude approximation of that effect than to ignore it…

During World War II when Colonel S.L.A. Marshall was the Chief Historian of the US European Theater of Operations, he undertook a number of interviews of units just after they had been in combat. After the war, in his book Men Against Fire, Marshall asserted that his interviews revealed that only 15% of US infantry soldiers fired their small arms weapons in combat. This revelation created something of a sensation at the time.

It has since been demonstrated that Marshall did not really have solid, scientific data for his assertion. But those who criticize Marshall for unscholarly, unscientific work should realize that in private life he was an exceptionally good newspaper reporter. His conclusions, based upon his observations, may have been largely intuitive, but I am convinced that they were generally, if not specifically, sound…

One of the few examples of the use of military history in the West in recent years was an important study done at the British Defence Operational Analysis Establishment (DOAE) by David Rowland. An unclassified condensation of that study was published in the June 1986 issue of the Journal of the Royal United Services Institution (RUSI). The article, “Assessments of Combat Degradation,” demonstrates conclusively that, in historical combat, small arms weapons have had only one-seventh to one-tenth of their theoretical effectiveness. Rowland does not attempt to say why this is so, but it is interesting that his value of one-seventh is very close to the S. L. A. Marshall 15% figure. Both values translate into casualty effects very similar to those that have emerged from my own research.

The intent of this post is not to rehash the debate on Marshall. As Dupuy noted above, even if Marshall’s conclusions were not based on empirical evidence, his observations on combat were nevertheless on to something important. (Details on the Marshall debate can be easily found with a Google search. A brief discussion took place on the old TDI Forum in 2007.)

David Rowland also presented a paper on the same topic Dupuy referenced above at the Military Operations Research Society (MORS) MORIMOC II conference in 1989, “Assessment of Combat Performance With Small Arms” He later published a book detailing his research on the subject in 2006, The Stress of Battle: Quantifying Human Performance in Combat, which is very much worth tracking down and reading.

Dupuy provided a basic version of his theoretical combat exhaustion methodology on pages 223-224 in Numbers, Predictions and War: Using History to Evaluate Combat Factors and Predict the Outcome of Battles (Indianapolis; New York: The Bobbs-Merrill Co., 1979).

Rules For Exhaustion Rates, 20th Century*

  1. The exhaustion factor (ex) of a fresh unit is 1.0; this is the maximum ex value.
  2. At the conclusion of an engagement, a new ex factor will be calculated for each side.
  3. A unit in normal offensive or defensive combat has its ex factor reduced by .05 for each consecutive day of combat; the ex factor cannot be less than 0.5.
  4. An attacking unit opposed by delaying tactics has its ex factor reduced by 0.05 per day.
  5. A defending unit in delay posture neither loses nor gains in its ex factor.
  6. A withdrawing unit, not seriously engaged, has its ex factor augmented at the rate of 0.05 per day.
  7. An advancing unit in pursuit, and not seriously delayed, neither loses nor gains in its ex factor.
  8. For a unit in reserve, or in non-active posture, an exhaustion factor of less than 1.0 is augmented at the rate of .1 per day.
  9. When a unit in combat, or recently in combat, is reinforced by a unit at least half of its size (in numbers of men), it adopts the ex factor of the reinforcing unit or—if the ex factor of the reinforcing unit is the same or lower than that of the reinforced—both adopt an ex factor 0.1 higher than that of the reinforced unit at the time of reinforcement, save that an ex factor cannot be greater than 1.0.
  10. When a unit in combat, or recently in combat, is reinforced by a unit less than half its size, but not less than one quarter its size, augmentations or modifications of ex factors will be 0.5 times those provided for in paragraph 9, above. When the reinforcing unit is less than one-quarter the size of the reinforced unit, but not less than one-tenth its size, augmentations or modifications of ex factors will be 0.25 times those provided for in paragraph 9, above.

* Approximate reflection of preliminary QJM assessment of effects of casualty and fatigue, WWII engagements. These rates are for division or smaller size; for corps and larger units exhaustion rates are calculated for component divisions and smaller separate units.

EXAMPLES OF APPLICATION

  1. A division in continuous offensive combat for five days stays in the line in inactive posture for two days, then resumes the offensive:
    1. Combat exhaustion effect: 1 – (5 x .05) = 0.75;
    2. Recuperation effect: 75 + (2 x .l) = 0.95.
  2. A division in defensive posture for fifteen days is ordered to undertake a counterattack:
    1. Combat exhaustion effect: 1 – (15 x .05) =0.25; this is below the minimum ex factor, which therefore applies: 0.5;
    2. Recuperation effect: None; ex factor is 0.5.
  3. A division in offensive posture for three days is reinforced by two fresh brigades:
    1. Combat exhaustion effect: 1 – (3 x .05) = 0.85;
    2. Reinforcement effect: Augmentation from 0.85 to 1.0.
  4. A division in offensive posture for three days is reinforced by one fresh brigade:
    1. Combat exhaustion effect: 1 – (3 x .05) = 0.85;
    2. Reinforcement effect: 0.5 x augmentation from 0.85 to 1 = 0.93.