 Over at his Best Defense blog, Tom Ricks recently posed an interesting question: Is rate of fire no longer a key metric in assessing military effectiveness?
Rate of fire doesn’t seem to be important in today’s militaries. I mean, everyone can go “full auto.” Rather, the problem seems to me firing too much and running out of ammunition.
I wonder if this affects how contemporary military historians look at the tactical level of war. Throughout most of history, the problem, it seems to me, was how many rocks, spears, arrows or bullets you could get off. Hence the importance of drill, which was designed to increase the volume of infantry fire (and to reduce people walking off the battlefield when they moved back to reload).
There are several ways to address this question from a historical perspective, but one place to start is to look at how rate of fire relates historically to combat.
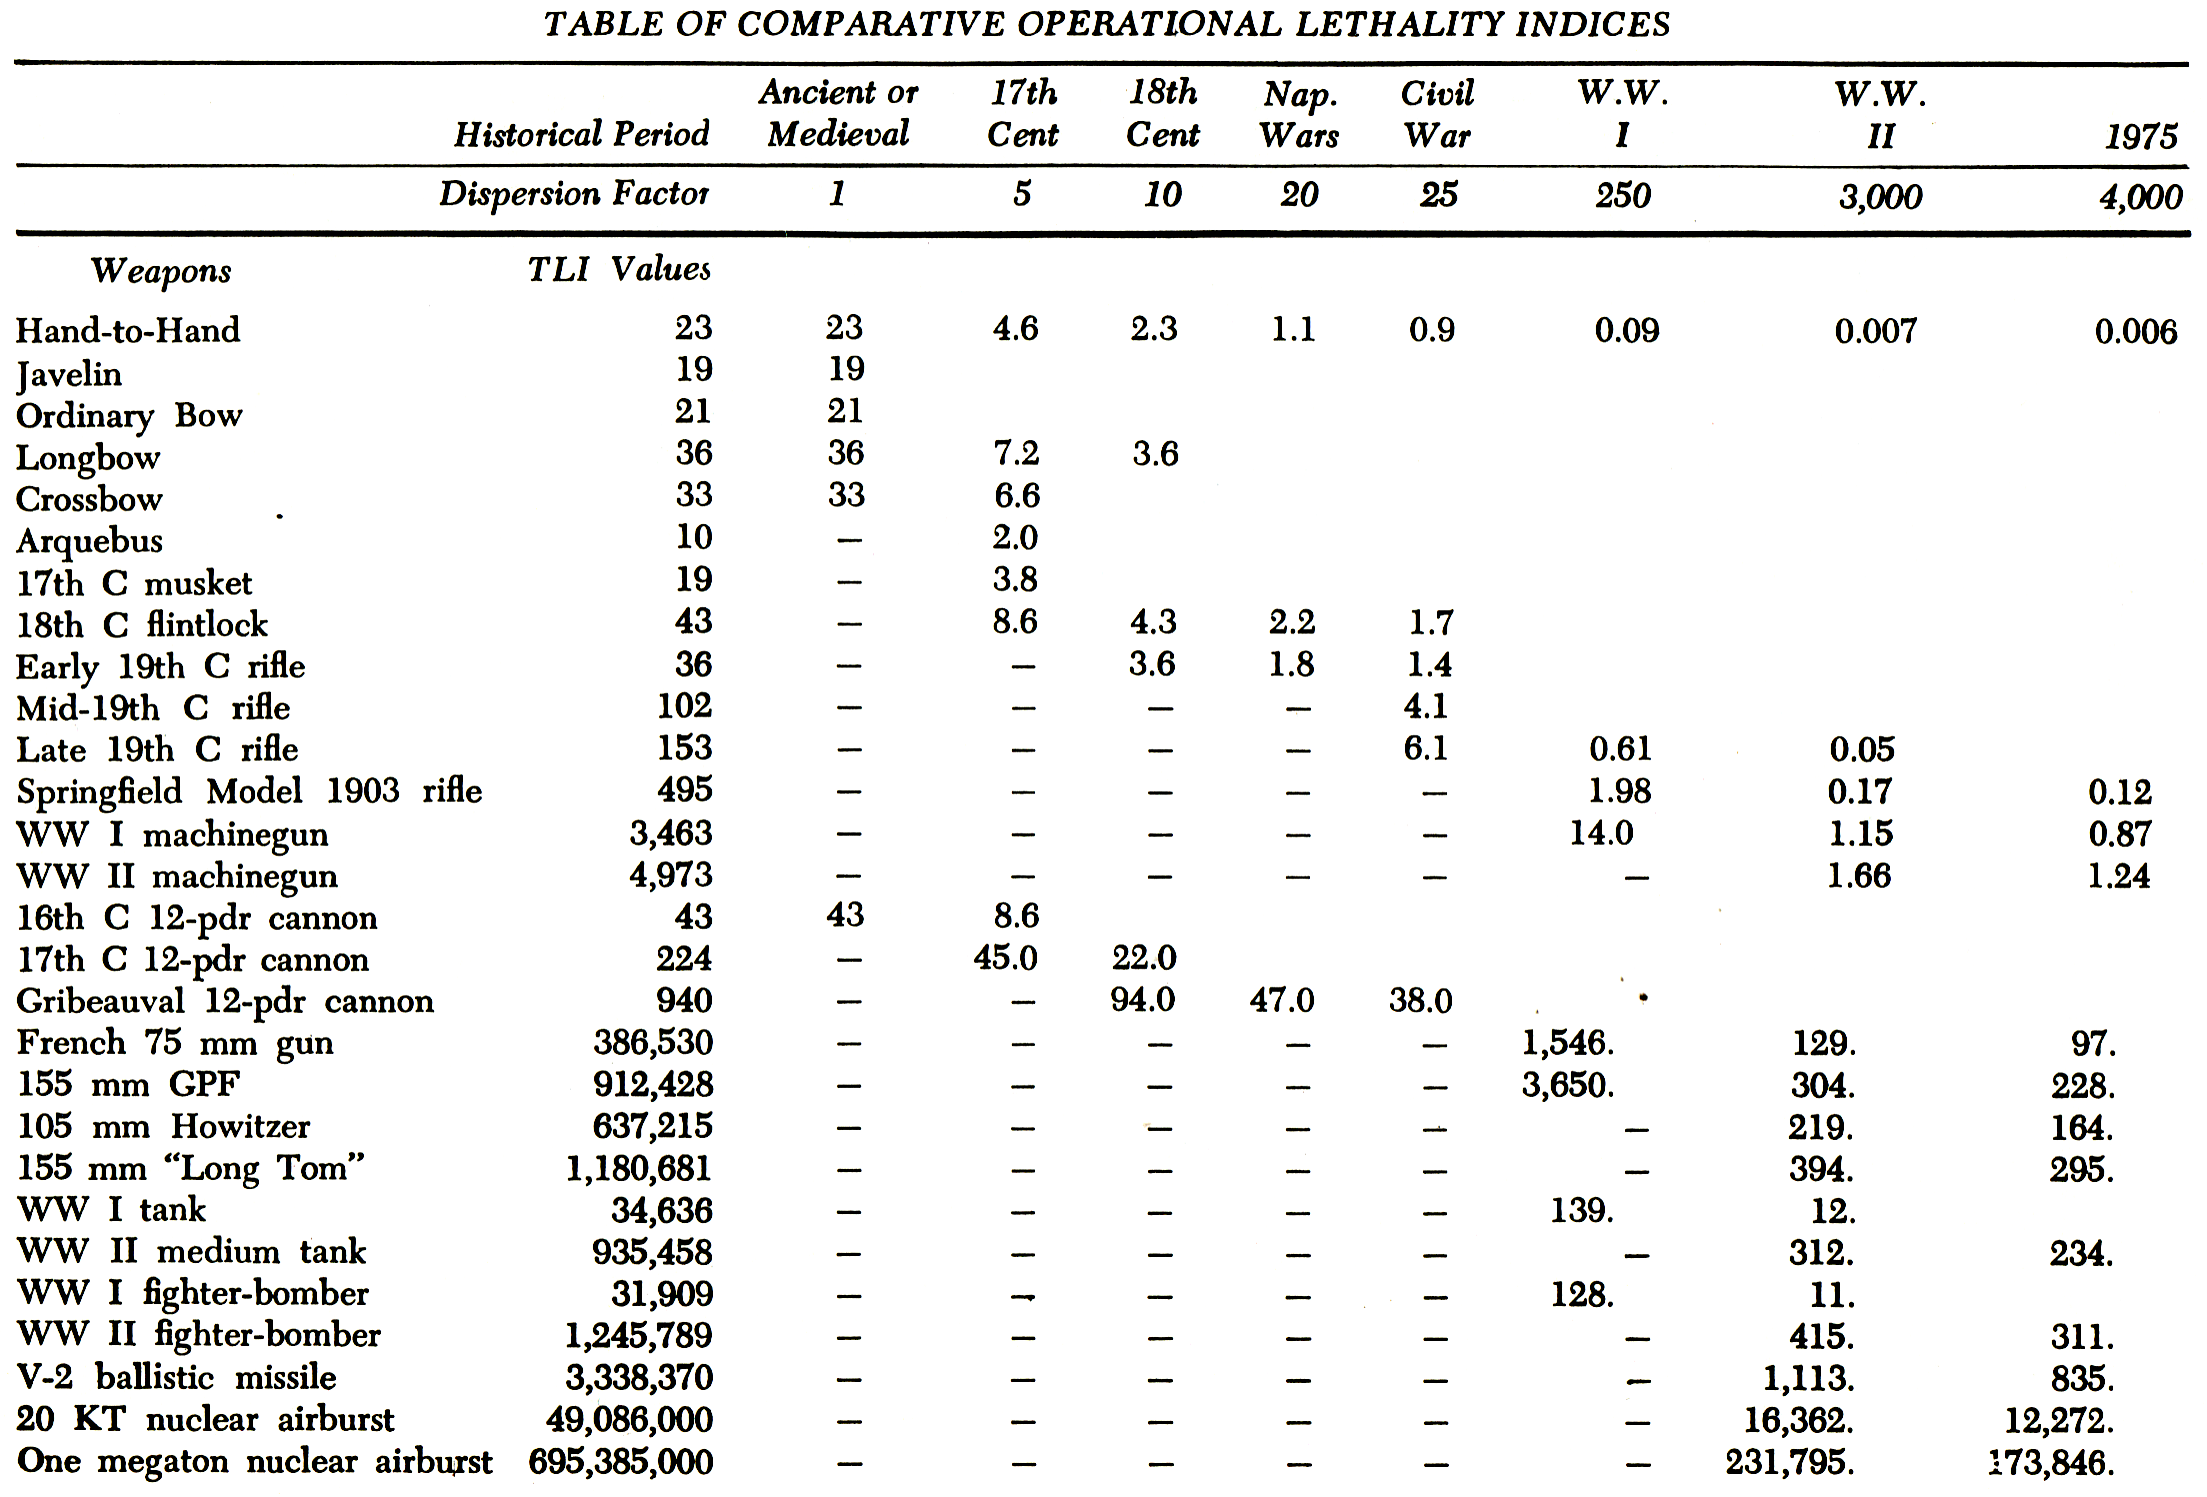
Rate of fire is one of several measures of a weapon’s ability to inflict damage, i.e. its lethality. In the early 1960s, Trevor Dupuy and his associates at the Historical Evaluation Research Organization (HERO) assessed whether historical trends in increasing weapon lethality were changing the nature of combat. To measure this, they developed a methodology for scoring the inherent lethality of a given weapon, the Theoretical Lethality Index (TLI). TLI is the product of five factors:
- rate of fire
- targets per strike
- range factor
- accuracy
- reliability
In the TLI methodology, rate of fire is defined as the number of effective strikes a weapon can deliver under ideal conditions in increments of one hour, and assumes no logistical limitation.
As measured by TLI, increased rates of fire do indeed increase weapon lethality. The TLI of an early 20th century semi-automatic rifle is nearly five times higher than a mid-19th century muzzle-loaded rifle due to its higher rate of fire. Despite having lower accuracy and reliability, a World War II-era machine gun has 10 times the TLI of a semi-automatic rifle due to its rate of fire. The rate of fire of small arms has not increased since the early-to-mid 20th century, and the assault rifle, adopted by modern armies following World War II, remains that standard infantry weapon in the early 21st century.
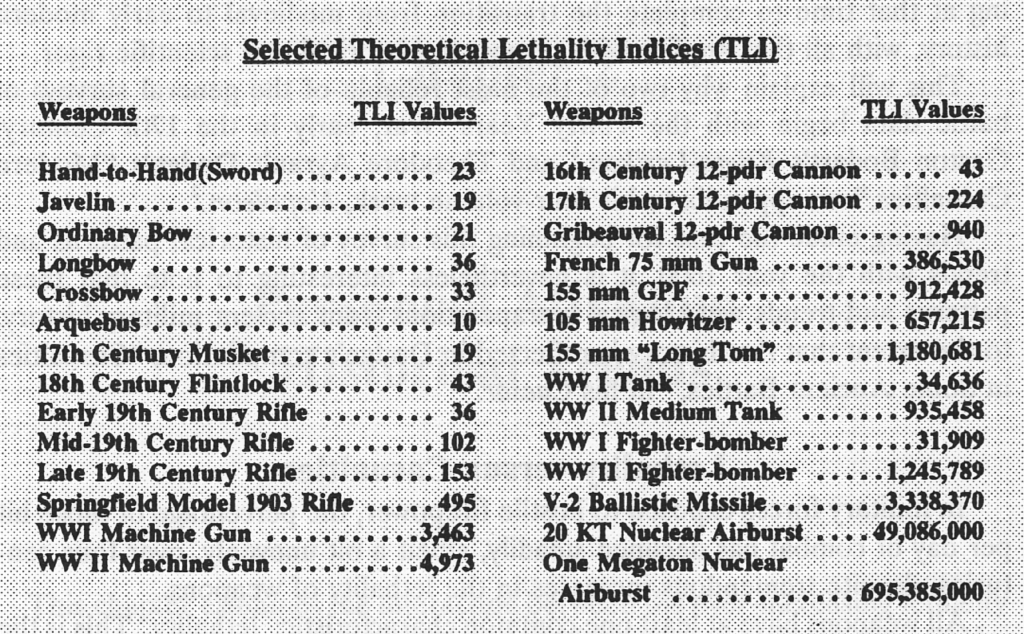
Rate of fire is just but one of many factors that can influence a weapon’s lethality, however. Artillery has much higher TLI values than small arms despite lower rates of fire. This is for the obvious reasons that artillery has far greater range than small arms and because each round of ammunition can hit multiple targets per strike.
There are other methods for scoring weapon lethality but the TLI provides a logical and consistent methodology for comparing weapons to each other. Through the TLI, Dupuy substantiated the observation that indeed, weapons have become more lethal over time, particularly in the last century.
 But if weapons have become more lethal, has combat become bloodier? No. Dupuy and his colleagues also discovered that, counterintuitively, the average casualty rates in land combat have been declining since the 17th century. Combat casualty rates did climb in the early and mid-19th century, but fell again precipitously from the later 19th century through the end of the 20th.
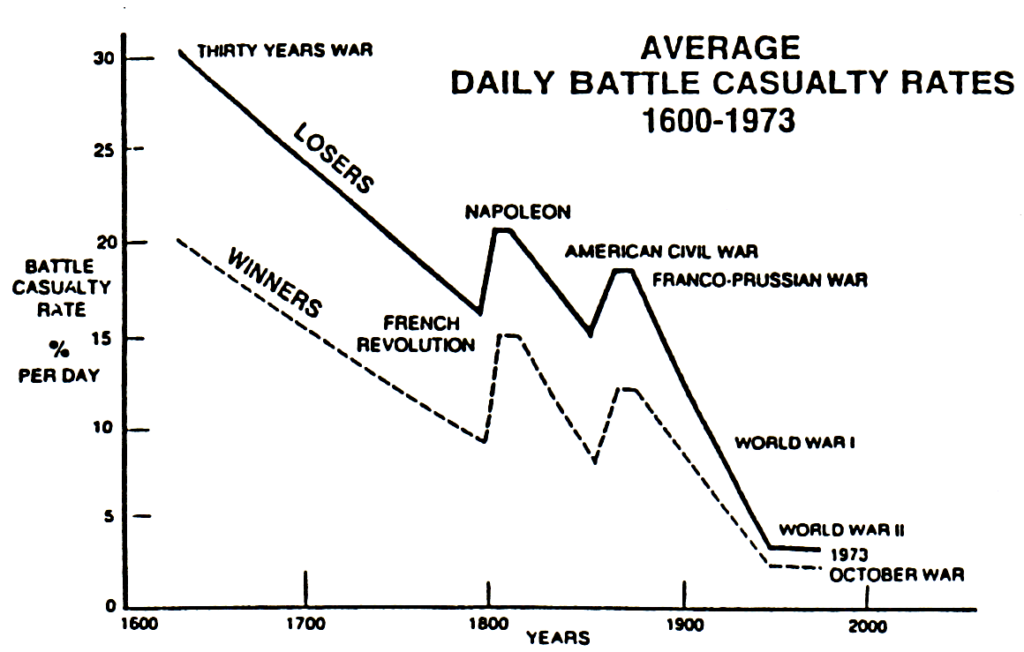
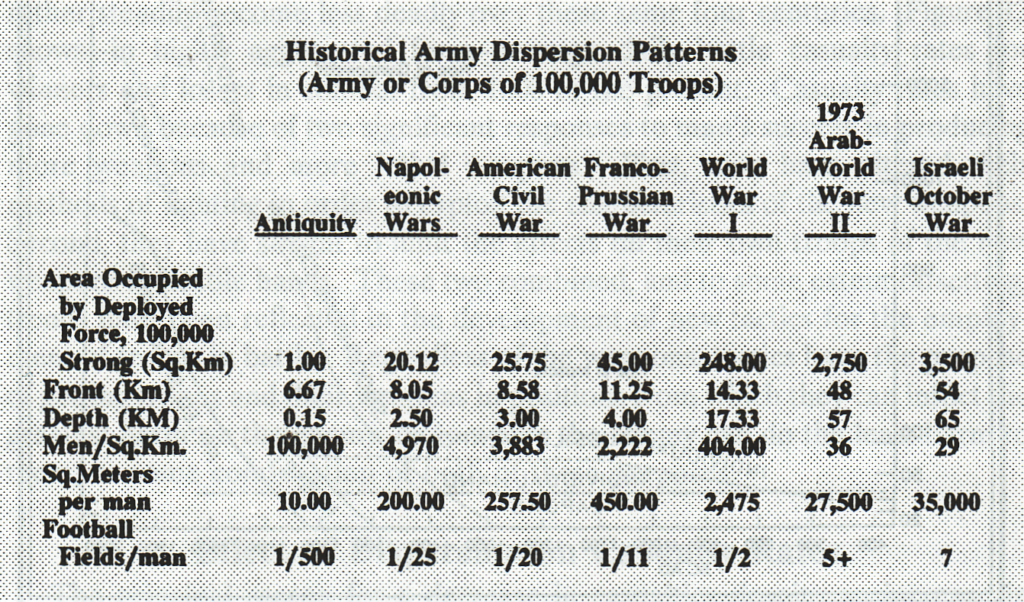
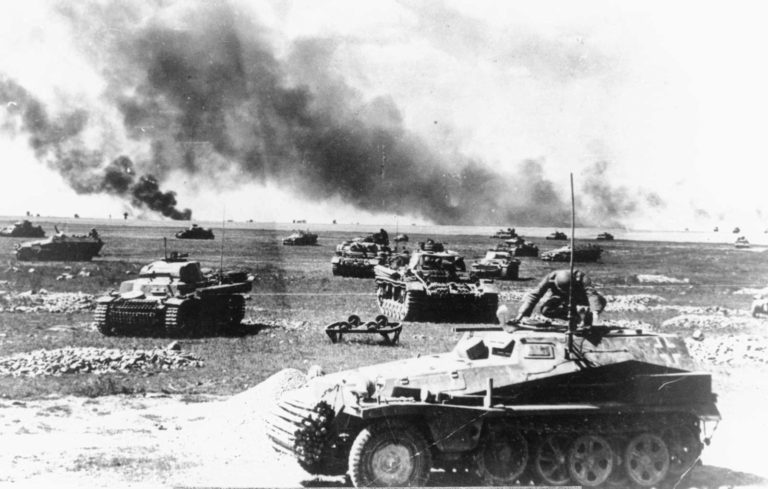
The reason, Dupuy determined, was because armies have historically adapted to increases in weapon lethality by dispersing in greater depth on the battlefield, decentralizing tactical decision-making and enhancing mobility, and placing a greater emphasis on combined arms tactics. The area occupied by 100,000 soldiers increased 4,000 times between antiquity and the late 20th century. Average ground force dispersion increased by a third between World War II and the 1973 Yom Kippur War, and he estimated it had increased by another quarter by 1990.
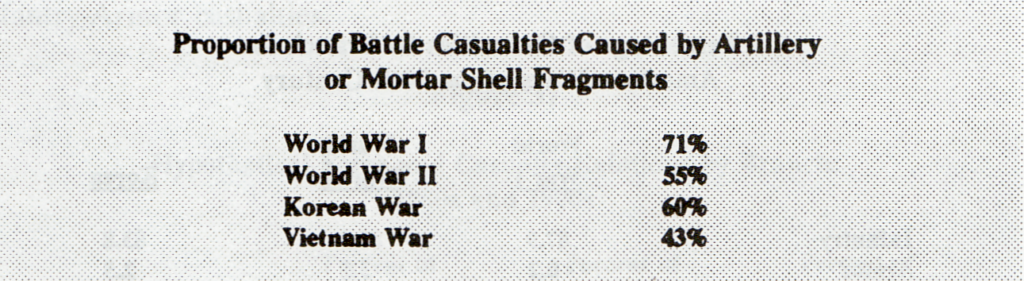
Simply put, even as weapons become more deadly, there are fewer targets on the battlefield for them to hit. Through the mid-19th century, the combination of low rates of fire and relatively shorter range required the massing of infantry fires in order to achieve lethal effect. Before 1850, artillery caused more battlefield casualties than infantry small arms. This ratio changed due to the increased rates of fire and range of rifled and breach loading weapons introduced in the 1850s and 1860s. The majority of combat casualties in conflicts of the mid-to-late 19th century were inflicted by infantry small arms.
 The lethality of modern small arms combined with machine guns led to further dispersion and the decentralization of tactical decision-making in early 20th century warfare. The increased destructiveness of artillery, due to improved range and more powerful ammunition, coupled with the invention of the field telephone and indirect fire techniques during World War I, restored the long arm to its role as king of the battlefield.
Dupuy represented this historical relationship between lethality and dispersion on the battlefield by applying a dispersion factor to TLI values to obtain what he termed the Operational Lethality Index (OLI). By accounting for these effects, OLI values are a good theoretical approximation of relative weapon effectiveness.
 Although little empirical research has been done on this question, it seems logical that the trend toward greater use of precision-guided weapons is at least a partial response to the so-called “empty battlefield.” The developers of the Third Offset Strategy postulated that the emphasis on developing precision weaponry by the U.S. in the 1970s was a calculated response to offset the Soviet emphasis on mass firepower (i.e. the “second offset”). The goal of modern precision weapons is “one shot, one kill,” where a reduced rate of fire is compensated for by greater range and accuracy. Such weapons have become sufficiently lethal that the best way to survive on a modern battlefield is to not be seen.
At least, that was the conventional wisdom until recently. The U.S. Army in particular is watching how the Ukrainian separatist forces and their Russian enablers are making use of new artillery weapons, drone and information technology, and tactics to engage targets with mass fires. Some critics have alleged that the U.S. artillery arm has atrophied during the Global War on Terror and may no longer be capable of overmatching potential adversaries. It is not yet clear whether there will be a real competition between mass and precision fires on the battlefields of the near future, but it is possible that it signals yet another shift in the historical relationship between lethality, mobility, and dispersion in combat.
SOURCES
Trevor N. Dupuy, Attrition: Forecasting Battle Casualties and Equipment Losses in Modern War (Falls Church, VA: NOVA Publications, 1995)
_____., Understanding War: History and Theory of Combat (New York: Paragon House, 1987)
_____. The Evolution of Weapons and Warfare (Indianapolis, IN: The Bobbs-Merrill Company, Inc., 1980)
_____. Numbers, Predictions and War: Using History to Evaluate Combat Factors and Predict the Outcome of Battles (Indianapolis; New York: The Bobbs-Merrill Co., 1979)
 As the U.S. Army and the national security community seek a sense of