Although possessing an enormous manpower advantage over the Daesh defenders, ISF had managed to secure only one-quarter of the city in two months of combat. This is likely due to the fact that the only ISF elements that have demonstrated any offensive combat effectiveness have been the CTS and the Popular Mobilization Forces (PMF, or Hash’d al Shaabi) Iraqi Shi’a militia mobilized by Grand Ayatollah Ali Sistani in 2014. PMF brigades hold the western outskirts of the city, but thus far have been restrained from entering it for fear of provoking sectarian violence with the mostly Sunni residents.
Daesh defenders, believed to number only from 3,000-5,000 at the outset of the battle, have had the luxury of fighting against only one axis of advance and within urban terrain filled with trapped civilians, which they have used as human shields. They mounted a particularly effective counterattack against the CTS using vehicle-borne improvised explosive devices (VBIEDs), which halted the initial offensive in mid-December. ISF casualties appear to be concentrated in the elite 1st Special Operations Brigade (the so-called “Golden Division”) of the CTS. An unnamed Pentagon source was quoted as stating that the Golden Division’s maneuver battalions had incurred “upwards of 50 percent casualties,” which, if sustained, would have rendered it combative ineffective in less than a month.
The Iraqi government has come to rely on the Golden Division to generate reliable offensive combat power. It spearheaded the attacks that recovered Tikrit, Ramadi, and Fallujah earlier in the year. Originally formed in 2004 as the non-sectarian Iraqi Special Operations Forces brigade, the Golden Division was amalgamated into the CTS in 2007 along with specialized counterterrorism and national police elements. Although intended for irregular warfare, the CTS appears to be the only Iraqi military force capable of effective conventional offensive combat operations, likely due to higher level of combat effectiveness relative to the rest of the ISF, as well as its interoperability with U.S. and Coalition supporting forces.
The relative success of the CTS can be seen as either indicative of the general failure of the decade-long U.S. effort to rebuild an effective Iraqi military establishment, or as an exemplary success of the U.S. Special Operations Forces model for training and operating with indigenous military forces. Or both.
Rate of fire doesn’t seem to be important in today’s militaries. I mean, everyone can go “full auto.” Rather, the problem seems to me firing too much and running out of ammunition.
I wonder if this affects how contemporary military historians look at the tactical level of war. Throughout most of history, the problem, it seems to me, was how many rocks, spears, arrows or bullets you could get off. Hence the importance of drill, which was designed to increase the volume of infantry fire (and to reduce people walking off the battlefield when they moved back to reload).
There are several ways to address this question from a historical perspective, but one place to start is to look at how rate of fire relates historically to combat.
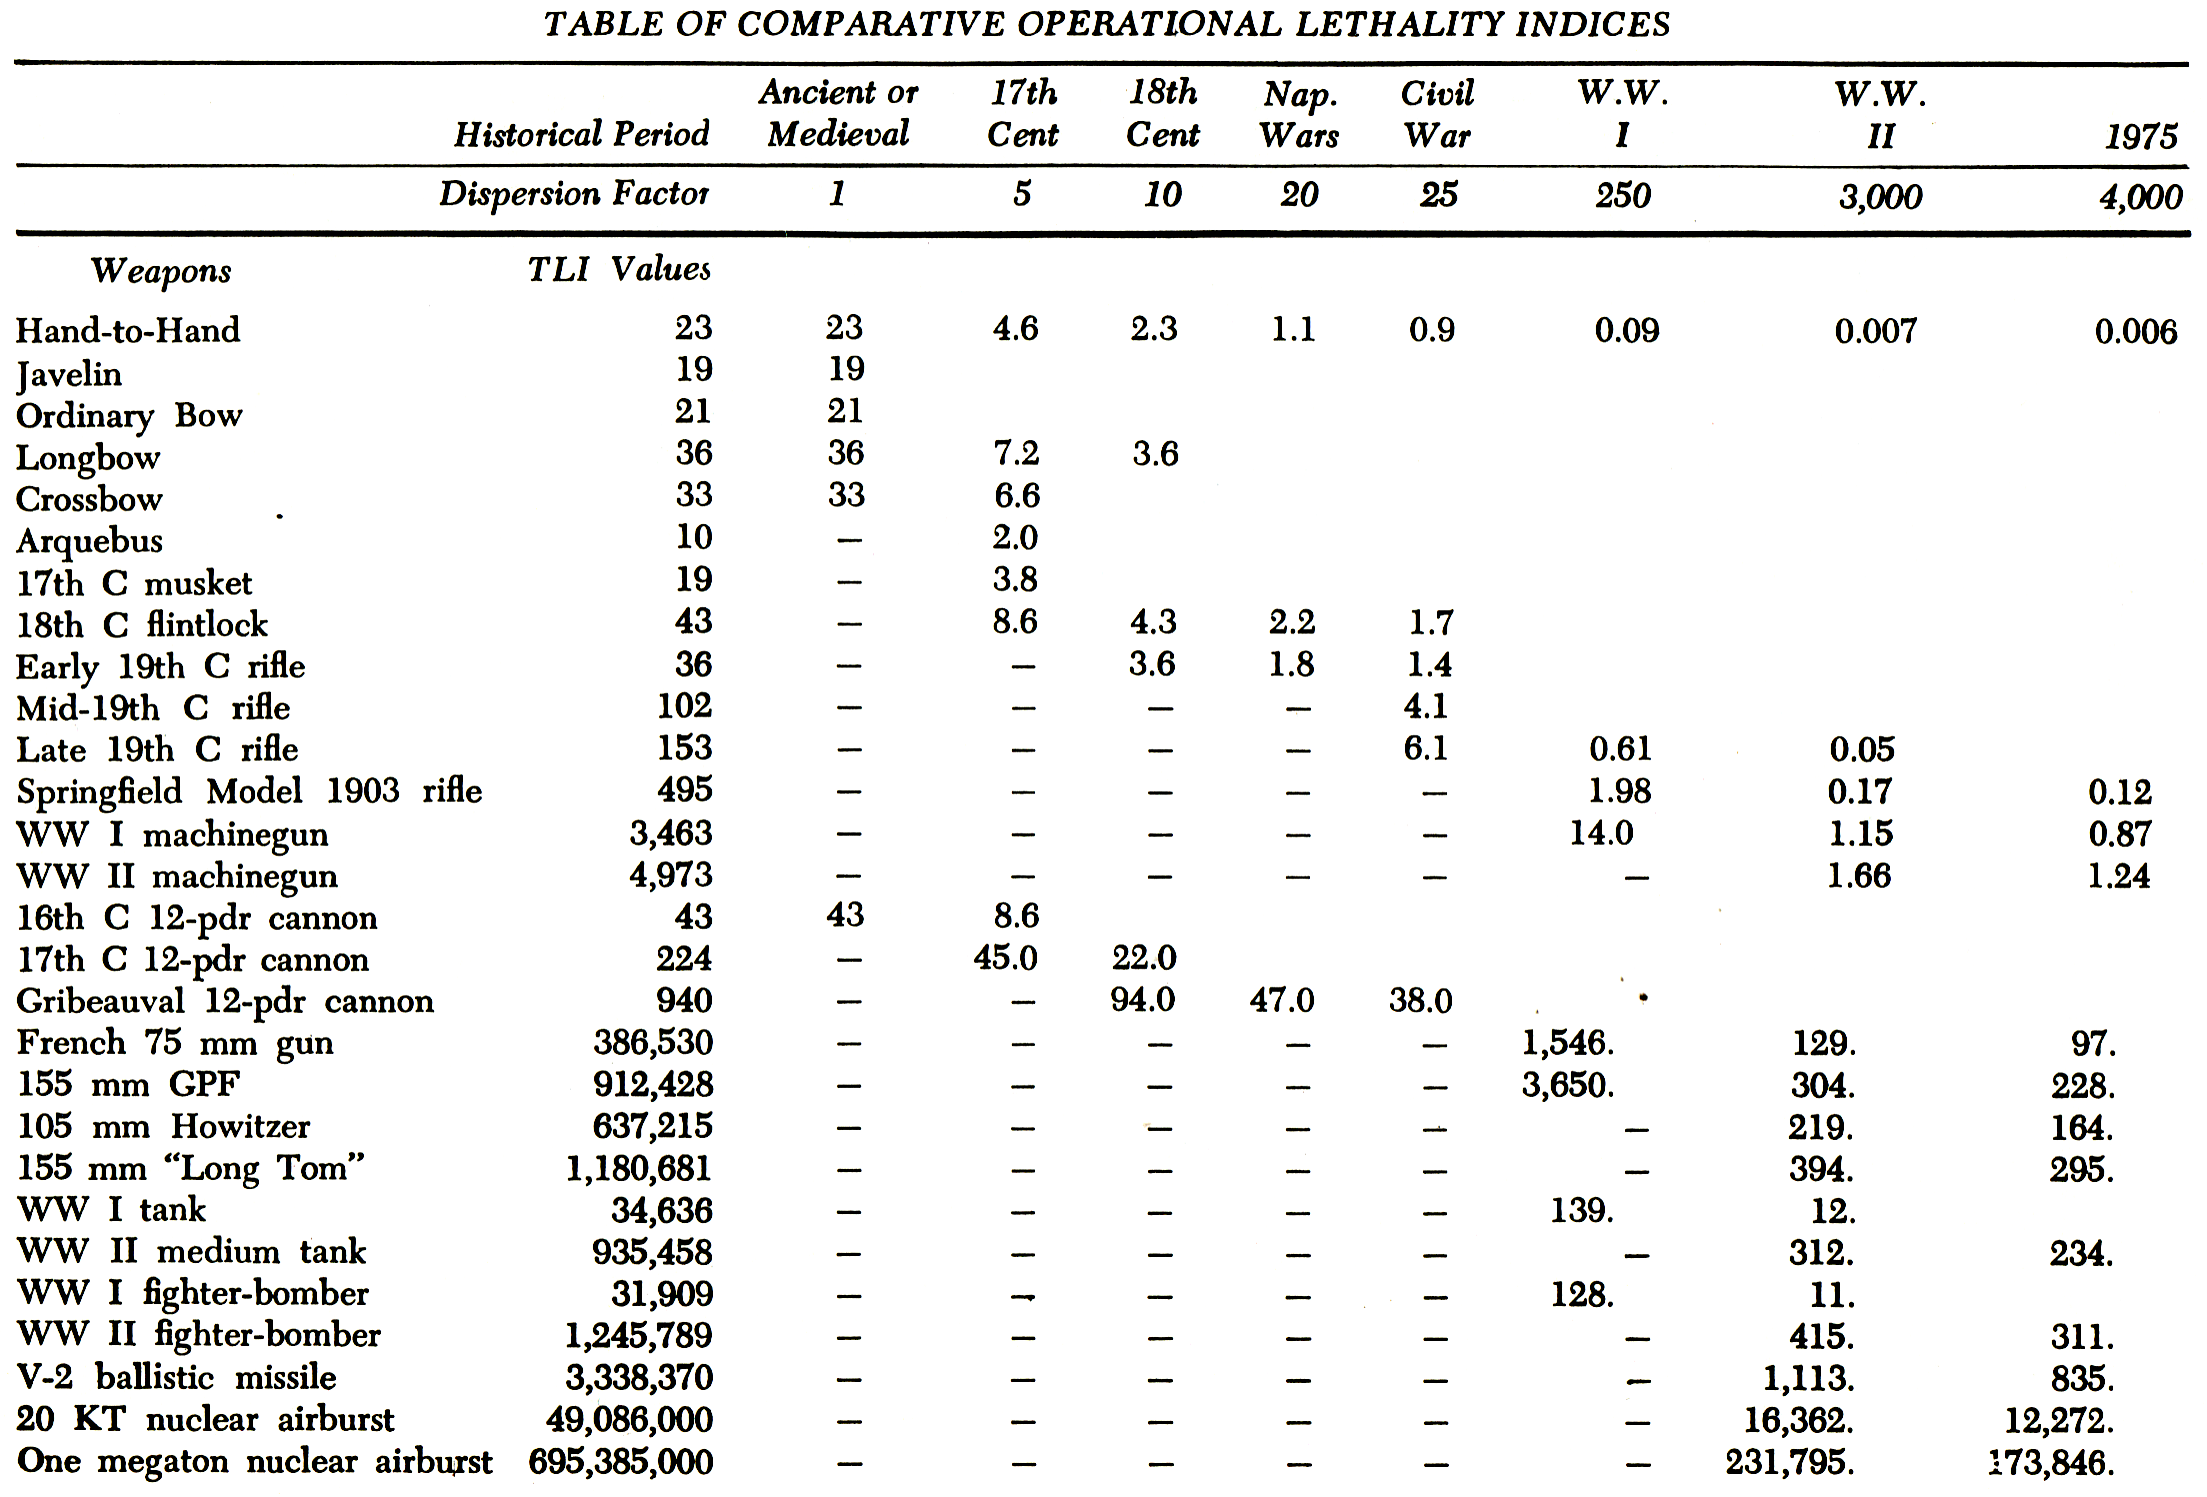
Rate of fire is one of several measures of a weapon’s ability to inflict damage, i.e. its lethality. In the early 1960s, Trevor Dupuy and his associates at the Historical Evaluation Research Organization (HERO) assessed whether historical trends in increasing weapon lethality were changing the nature of combat. To measure this, they developed a methodology for scoring the inherent lethality of a given weapon, the Theoretical Lethality Index (TLI). TLI is the product of five factors:
rate of fire
targets per strike
range factor
accuracy
reliability
In the TLI methodology, rate of fire is defined as the number of effective strikes a weapon can deliver under ideal conditions in increments of one hour, and assumes no logistical limitation.
As measured by TLI, increased rates of fire do indeed increase weapon lethality. The TLI of an early 20th century semi-automatic rifle is nearly five times higher than a mid-19th century muzzle-loaded rifle due to its higher rate of fire. Despite having lower accuracy and reliability, a World War II-era machine gun has 10 times the TLI of a semi-automatic rifle due to its rate of fire. The rate of fire of small arms has not increased since the early-to-mid 20th century, and the assault rifle, adopted by modern armies following World War II, remains that standard infantry weapon in the early 21st century.
Rate of fire is just but one of many factors that can influence a weapon’s lethality, however. Artillery has much higher TLI values than small arms despite lower rates of fire. This is for the obvious reasons that artillery has far greater range than small arms and because each round of ammunition can hit multiple targets per strike.
There are other methods for scoring weapon lethality but the TLI provides a logical and consistent methodology for comparing weapons to each other. Through the TLI, Dupuy substantiated the observation that indeed, weapons have become more lethal over time, particularly in the last century.
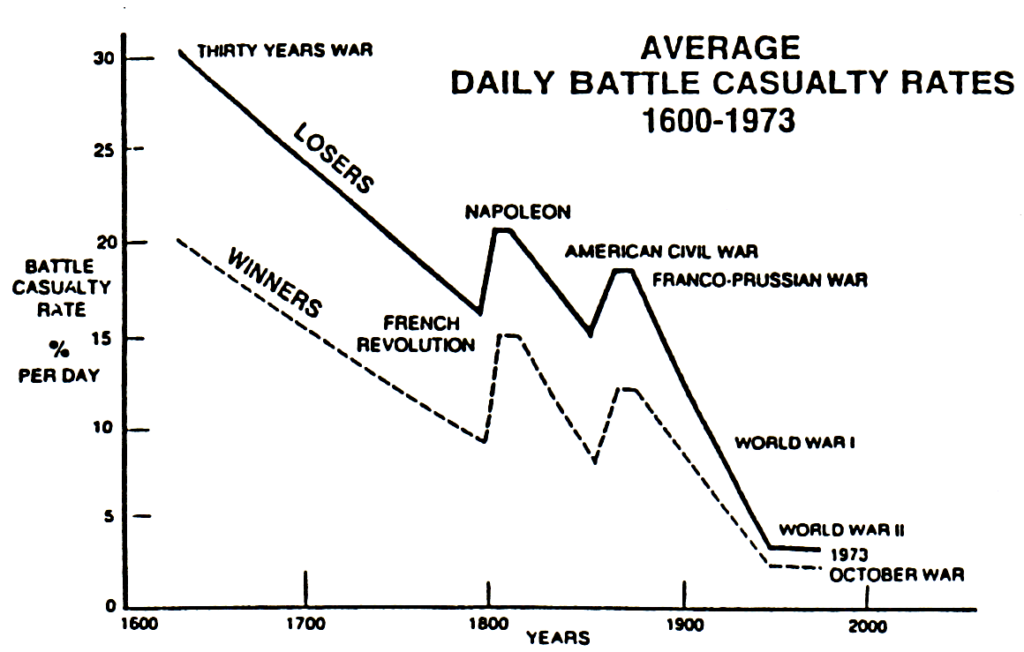
But if weapons have become more lethal, has combat become bloodier? No. Dupuy and his colleagues also discovered that, counterintuitively, the average casualty rates in land combat have been declining since the 17th century. Combat casualty rates did climb in the early and mid-19th century, but fell again precipitously from the later 19th century through the end of the 20th.
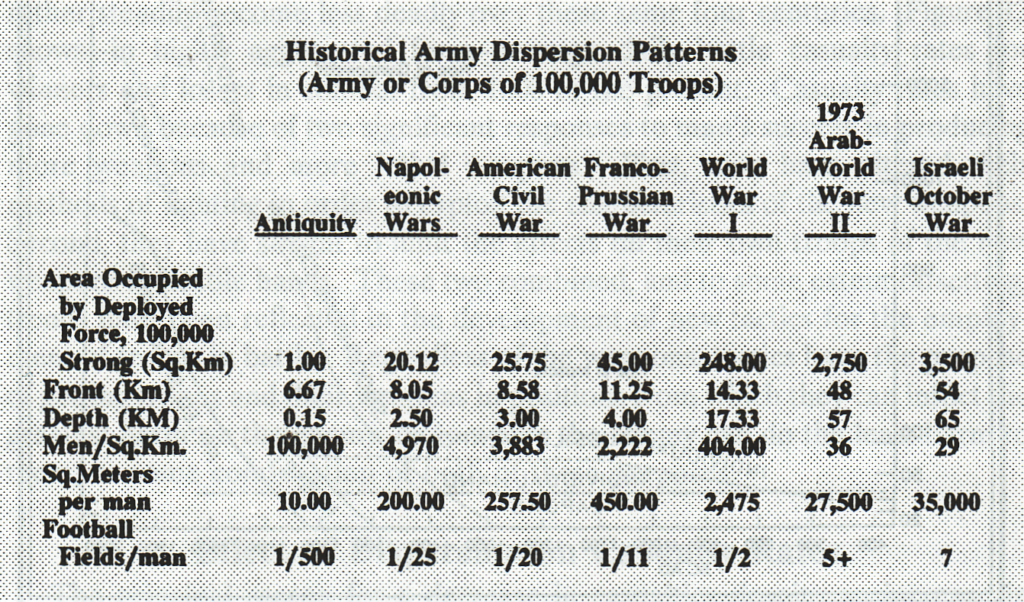
The reason, Dupuy determined, was because armies have historically adapted to increases in weapon lethality by dispersing in greater depth on the battlefield, decentralizing tactical decision-making and enhancing mobility, and placing a greater emphasis on combined arms tactics. The area occupied by 100,000 soldiers increased 4,000 times between antiquity and the late 20th century. Average ground force dispersion increased by a third between World War II and the 1973 Yom Kippur War, and he estimated it had increased by another quarter by 1990.
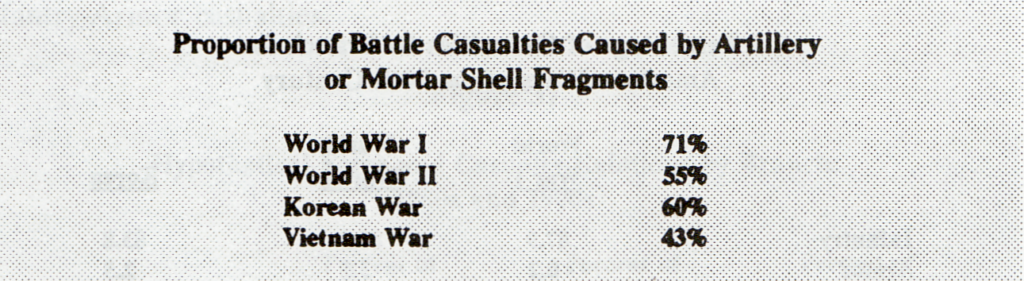
Simply put, even as weapons become more deadly, there are fewer targets on the battlefield for them to hit. Through the mid-19th century, the combination of low rates of fire and relatively shorter range required the massing of infantry fires in order to achieve lethal effect. Before 1850, artillery caused more battlefield casualties than infantry small arms. This ratio changed due to the increased rates of fire and range of rifled and breach loading weapons introduced in the 1850s and 1860s. The majority of combat casualties in conflicts of the mid-to-late 19th century were inflicted by infantry small arms.
The lethality of modern small arms combined with machine guns led to further dispersion and the decentralization of tactical decision-making in early 20th century warfare. The increased destructiveness of artillery, due to improved range and more powerful ammunition, coupled with the invention of the field telephone and indirect fire techniques during World War I, restored the long arm to its role as king of the battlefield.
Dupuy represented this historical relationship between lethality and dispersion on the battlefield by applying a dispersion factor to TLI values to obtain what he termed the Operational Lethality Index (OLI). By accounting for these effects, OLI values are a good theoretical approximation of relative weapon effectiveness.
Although little empirical research has been done on this question, it seems logical that the trend toward greater use of precision-guided weapons is at least a partial response to the so-called “empty battlefield.” The developers of the Third Offset Strategy postulated that the emphasis on developing precision weaponry by the U.S. in the 1970s was a calculated response to offset the Soviet emphasis on mass firepower (i.e. the “second offset”). The goal of modern precision weapons is “one shot, one kill,” where a reduced rate of fire is compensated for by greater range and accuracy. Such weapons have become sufficiently lethal that the best way to survive on a modern battlefield is to not be seen.
At least, that was the conventional wisdom until recently. The U.S. Army in particular is watching how the Ukrainian separatist forces and their Russian enablers are making use of new artillery weapons, drone and information technology, and tactics to engage targets with mass fires. Some critics have alleged that the U.S. artillery arm has atrophied during the Global War on Terror and may no longer be capable of overmatching potential adversaries. It is not yet clear whether there will be a real competition between mass and precision fires on the battlefields of the near future, but it is possible that it signals yet another shift in the historical relationship between lethality, mobility, and dispersion in combat.
One aspect of future battle of great interest to military planners is probably going to tank loss rates in combat. In a previous post, I looked at the analysis done by Trevor Dupuy on the relationship between tank and personnel losses in the U.S. experience during World War II. Today, I will take a look at his analysis of historical tank loss rates.
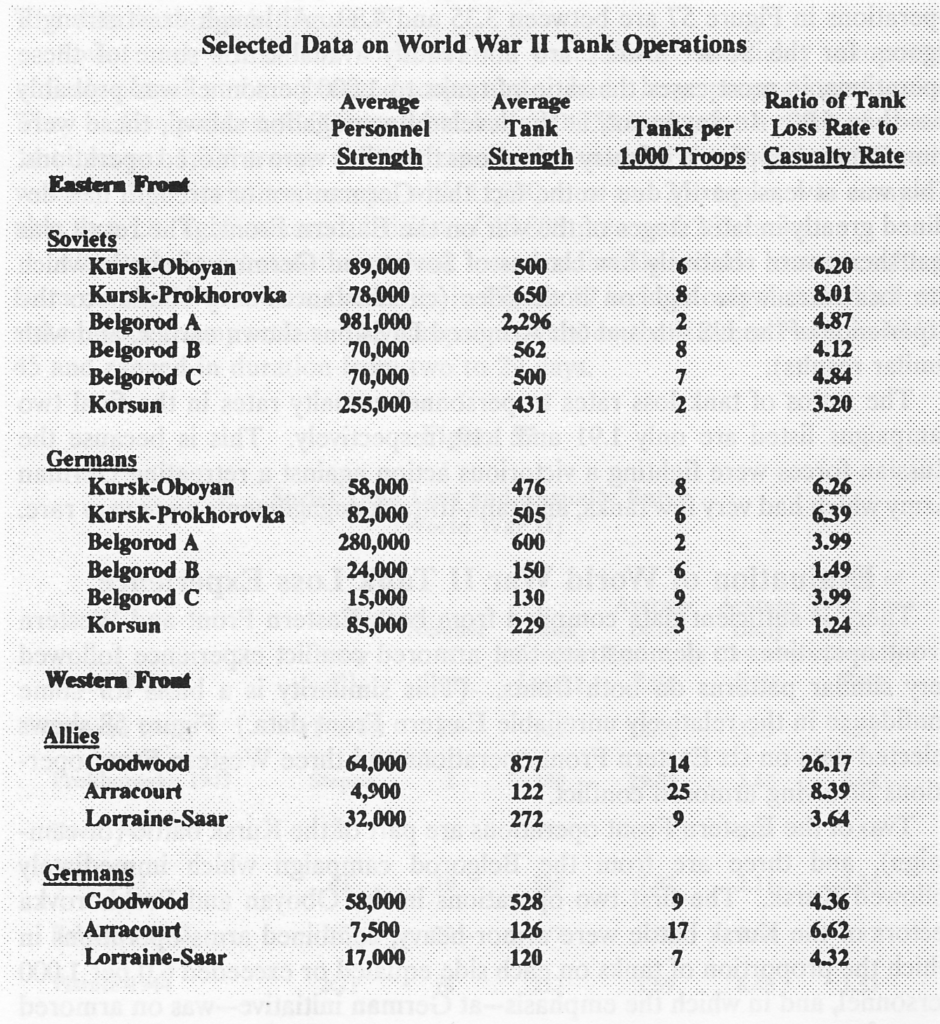
In general, Dupuy identified that a proportional relationship exists between personnel casualty rates in combat and losses in tanks, guns, trucks, and other equipment. (His combat attrition verities are discussed here.) Looking at World War II division and corps-level combat engagement data in 1943-1944 between U.S., British and German forces in the west, and German and Soviet forces in the east, Dupuy found similar patterns in tank loss rates.
In combat between two division/corps-sized, armor-heavy forces, Dupuy found that the tank loss rates were likely to be between five to seven times the personnel casualty rate for the winning side, and seven to 10 for the losing side. Additionally, defending units suffered lower loss rates than attackers; if an attacking force suffered a tank losses seven times the personnel rate, the defending forces tank losses would be around five times.
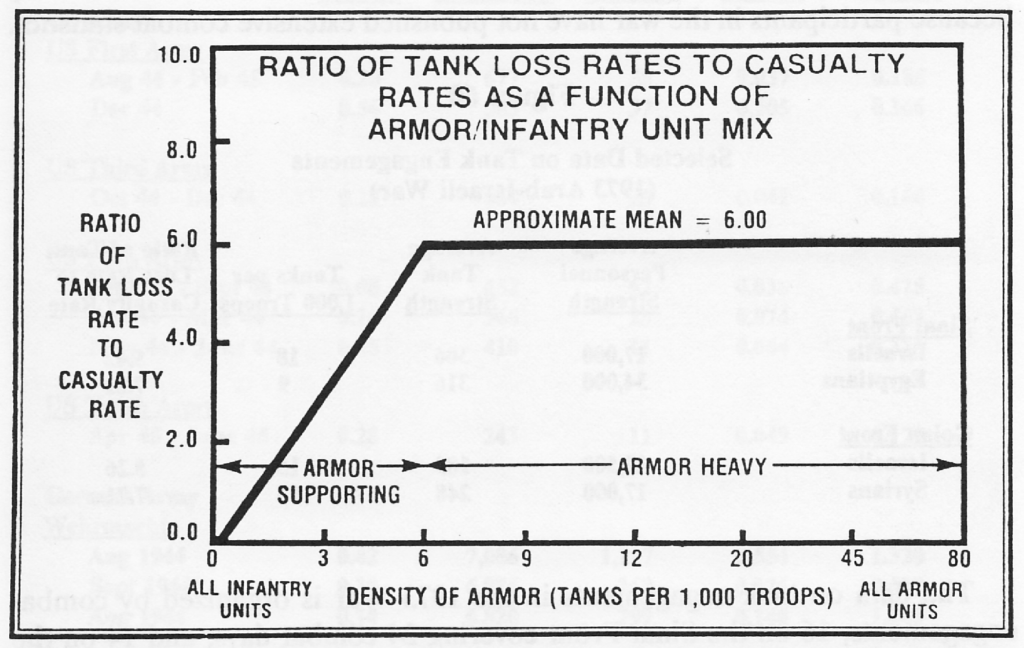
Dupuy also discovered the ratio of tank to personnel losses appeared to be a function of the proportion of tanks to infantry in a combat force. Units with fewer than six tanks per 1,000 troops could be considered armor supporting, while those with a density of more than six tanks per 1,000 troops were armor-heavy. Armor supporting units suffered lower tank casualty rates than armor heavy units.
Dupuy looked at tank loss rates in the 1973 Arab-Israeli War and found that they were consistent with World War II experience.
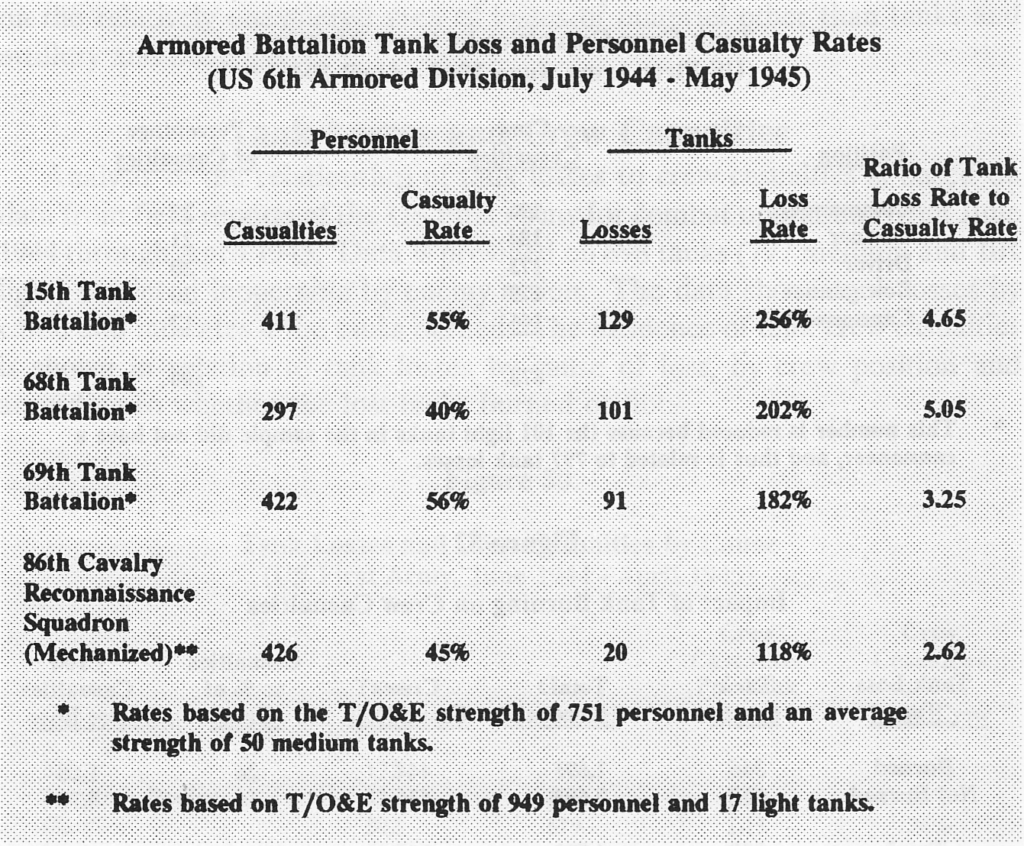
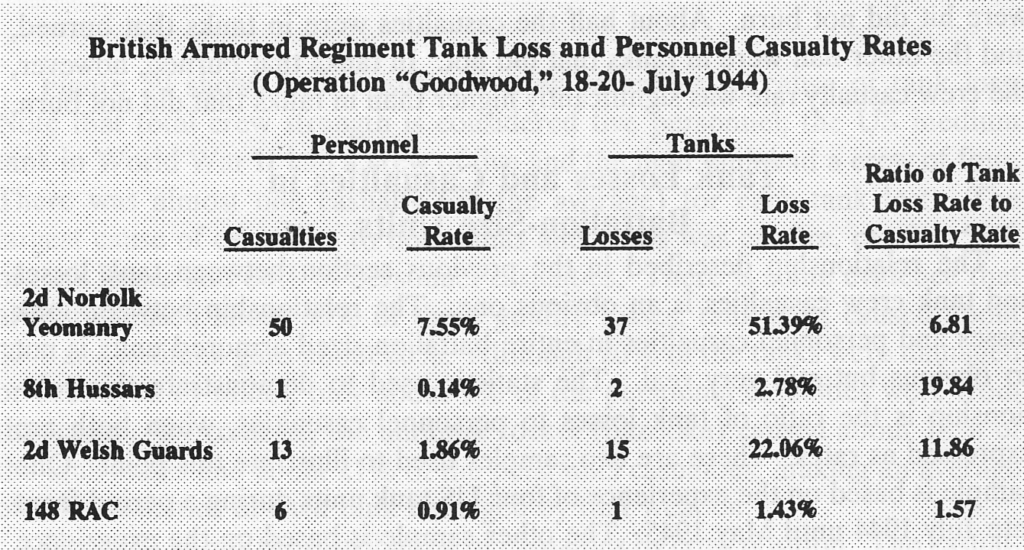
What does this tell us about possible tank losses in future combat? That is a very good question. One guess that is reasonably certain is that future tank battles will probably not involve forces of World War II division or corps size. The opposing forces will be brigade combat teams, or more likely, battalion-sized elements.
Dupuy did not have as much data on tank combat at this level, and what he did have indicated a great deal more variability in loss rates. Examples of this can be found in the tables below.
These data points showed some consistency, with a mean of 6.96 and a standard deviation of 6.10, which is comparable to that for division/corps loss rates. Personnel casualty rates are higher and much more variable than those at the division level, however. Dupuy stated that more research was necessary to establish a higher degree of confidence and relevance of the apparent battalion tank loss ratio. So one potentially fruitful area of research with regard to near future combat could very well be a renewed focus on historical experience.
In his 1990 book Attrition: Forecasting Battle Casualties and Equipment Losses in Modern War, Trevor Dupuy took a look at the relationship between tank losses and crew casualties in the U.S. 1st Army between June 1944 and May 1945 (pp. 80-81). The data sampled included 797 medium (averaging 5 crewmen) and 101 light (averaging 4 crewmen) tanks. For each tank loss, an average of one crewman was killed or wounded. Interestingly, although gunfire accounted for the most tank and crew casualties, infantry anti-tank rockets (such as the Panzerfaust) inflicted 13% of the tank losses, but caused 21% of the crew losses.
Casualties were evenly distributed among the crew positions.
Whether or not a destroyed tank caught fire made a big difference for the crew. Only 40% of the tanks in the sample burned, but casualties were distributed evenly between the tanks that burned and those that did not. This was due to the higher casualty rate in the tanks that caught fire (1.28 crew casualties per tank) and those that did not (0.78 casualties per tank).
Dupuy found the relationship between tank losses and casualties to be straightforward and obvious. This relationship would not be so simple when viewed at the battalion level. More on that in a future post [Tank Loss Rates in Combat: Then and Now].
Keying off Shawn’s previous post…if the DOD figures are accurate this means:
In about two years, we have killed 45,000 insurgents from a force of around 25,000.
This is around 100% losses a year
This means the insurgents had to completely recruit an entire new force every year for the last two years
Or maybe we just shot everyone twice.
It is clear the claimed kills are way too high, or the claimed strength is too low, or a little bit of both
We are getting three kills per sortie.
Now, I have not done an analysis of kills per sorties in other insurgencies (and this would be useful to do), but I am pretty certain that this is unusually high.
We are killing almost a 1,000 insurgents (not in uniform) for every civilian we are killing.
Even if I use the Airwars figure of 1,568 civilians killed, this is 29 insurgents for every civilian killed.
Again, I have not an analysis of insurgents killed per civilian killed in air operations (and this would be useful to do), but these rates seem unusually low.
It appears that there are some bad estimates being made here. Nothing wrong with doing an estimate, but something is very wrong if you are doing estimates that are significantly off. Some of these appear to be off.
This is, of course, a problem we encountered with Iraq and Afghanistan and is discussed to some extent in my book America’s Modern Wars. It was also a problem with the Soviet Army in World War II, and is something I discuss in some depth in my Kursk book.
It would be useful to develop a set of benchmarks from past wars looking at insurgents killed per sorties, insurgents killed per civilian killed in air operations (an other types of operations), insurgents killed compared to force strength, and so forth.
I find the conclusion toward the end the article interesting:
“My analysis found that on the largest scale – casualty rates from battles grouped by underlying geology – all of these limestone-related factors appear to balance. That is, it didn’t really matter if a soldier was attacking across limestone, igneous and sedimentary rock, or terrain underlain by sand and clay, the casualty rates were consistently between 12 and 15 percent.”
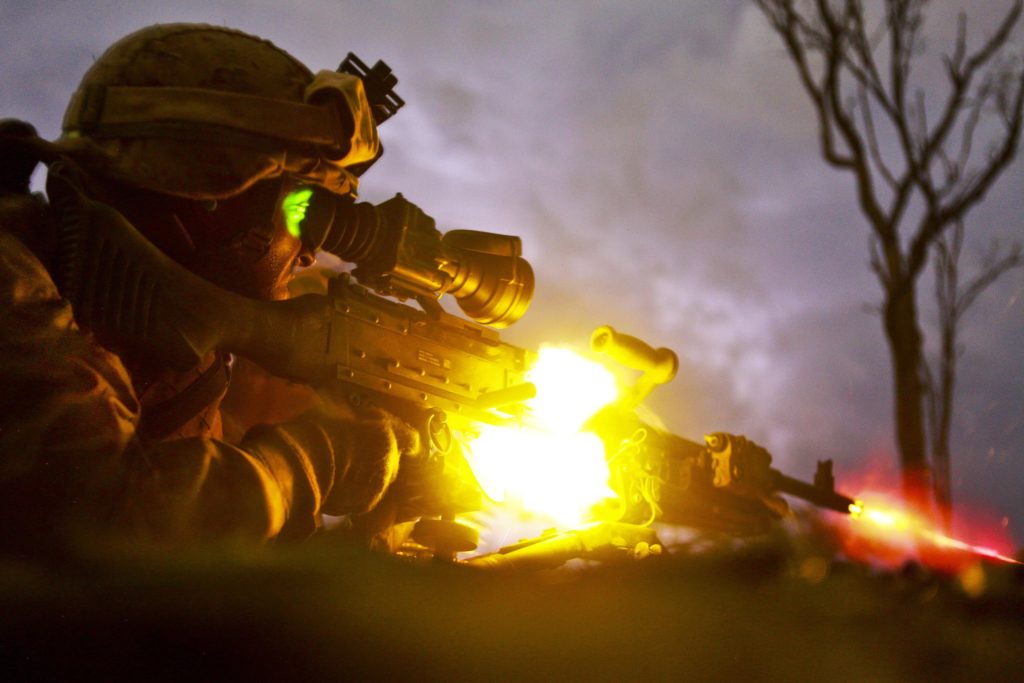
Photo by Ssgt. Lisa Zunzanyika-Carpenter 1st Combat Camera Charleston AFB SC
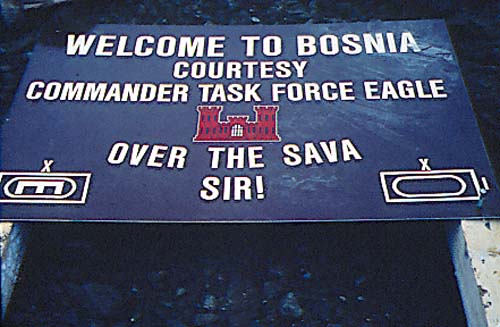
In previous posts, I highlighted a call for more prediction and accountability in the field of security studies, and detailed Trevor N. Dupuy’s forecasts for the 1990-1991 Gulf War. Today, I will look at The Dupuy Institute’s 1995 estimate of potential casualties in Operation JOINT ENDEAVOR, the U.S. contribution to the North Atlantic Treaty Organization (NATO) peacekeeping effort in Bosnia and Herzegovina.
On 1 November 1995, the leaders of the Serbia, Croatia, and Bosnia, rump states left from the breakup of Yugoslavia, along with representatives from the United States, European Union, and Russia, convened in Dayton, Ohio to negotiate an end to a three-year civil war. The conference resulted from Operation DELIBERATE FORCE, a 21-day air campaign conducted by NATO in August and September against Bosnian Serb forces in Bosnia.
A key component of the negotiation involved deployment of a NATO-led Implementation Force (IFOR) to replace United Nations troops charged with keeping the peace between the warring factions. U.S. European Command (USEUCOM) and NATO had been evaluating potential military involvement in the former Yugoslavia since 1992, and U.S. Army planners started operational planning for a ground mission in Bosnia in August 1995. The Joint Chiefs of Staff alerted USEUCOM for a possible deployment to Bosnia on 2 November.[1]
Up to that point, U.S. President Bill Clinton had been reluctant to commit U.S. ground forces to the conflict and had not yet agreed to do so as part of the Dayton negotiations. As part of the planning process, Joint Staff planners contacted the Deputy Undersecretary of the Army for Operations Research for assistance in developing an estimate of potential U.S. casualties in a peacekeeping operation. The planners were told that no methodology existed for forecasting losses in such non-combat contingency operations.[2]
On the same day the Dayton negotiation began, the Joint Chiefs contracted The Dupuy Institute to use its historical expertise on combat casualties to produce an estimate within three weeks for likely losses in a commitment of 20,000 U.S. troops to a 12-month peacekeeping mission in Bosnia. Under the overall direction of Nicholas Krawciw (Major General, USA, ret.), then President of The Dupuy Institute, a two-track analytical effort began.
One line of effort analyzed the different phases of the mission and compiled list of potential lethal threats for each, including non-hostile accidents. Losses were forecasted using The Dupuy Institute’s combat model, the Tactical Numerical Deterministic Model (TNDM), and estimates of lethality and frequency for specific events. This analysis yielded a probabilistic range for possible casualties.
The second line of inquiry looked at data on 144 historical cases of counterinsurgency and peacekeeping operations compiled for a 1985 study by The Dupuy Institute’s predecessor, the Historical Evaluation and Research Organization (HERO), and other sources. Analysis of 90 of these cases, including all 38 United Nations peacekeeping operation to that date, yielded sufficient data to establish baseline estimates for casualties related to force size and duration.
Coincidentally and fortuitously, both lines of effort produced estimates that overlapped, reinforcing confidence in their validity. The Dupuy Institute delivered its forecast to the Joint Chiefs of Staff within two weeks. It estimated possible U.S. casualties for two scenarios, one a minimal deployment intended to limit risk, and the other for an extended year-long mission.
For the first scenario, The Dupuy Institute estimated 11 to 29 likely U.S. fatalities with a pessimistic potential for 17 to 42 fatalities. There was also the real possibility for a high-casualty event, such as a transport plane crash. For the 12-month deployment, The Dupuy Institute forecasted a 50% chance that U.S. killed from all causes would be below 17 (12 combat deaths and 5 non-combat fatalities) and a 90% chance that total U.S. fatalities would be below 25.
Chairman of the Joint Chiefs of Staff General John Shalikashvili carried The Dupuy Institute’s casualty estimate with him during the meeting in which President Clinton decided to commit U.S. forces to the peacekeeping mission. The participants at Dayton reached agreement on 17 November and an accord was signed on 14 December. Operation JOINT ENDEAVOR began on 2 December with 20,000 U.S. and 60,000 NATO troops moving into Bosnia to keep the peace. NATO’s commitment in Bosnia lasted until 2004 when European Union forces assumed responsibility for the mission.
There were six U.S. casualties from all causes and no combat deaths during JOINT ENDEAVOR.
Map of ground operations of Operation Desert Storm starting invasion February 24-28th 1991. Shows allied and Iraqi forces. Special arrows indicate the American 101st Airborne division moved by air and where the French 6st light division and American 3rd Armored Cavalry Regiment provided security. Image created by Jeff Dahl and reposted under the terms of the GNU Free Documentation License, Version 1.2.
[NOTE: This post has been edited to more accurately characterize Trevor Dupuy’s public comments on TNDA’s estimates.]
Operation DESERT STORM began on 17 January 1991 with an extended aerial campaign that lasted 38 days. Ground combat operations were initiated on 24 February and concluded after four days and four hours, with U.S. and Coalition forces having routed the Iraqi Army in Kuwait and in position to annihilate surviving elements rapidly retreating northward. According to official accounting, U.S. forces suffered 148 killed in action and 467 wounded in action, for a total of 614 combat casualties. An additional 235 were killed in non-hostile circumstances.[1]
In retrospect, TNDA’s casualty forecasts turned out to be high, with the actual number of casualties falling below the lowest +/- 50% range of estimates. Forecasts, of course, are sensitive to the initial assumptions they are based upon. In public comments made after the air campaign had started but before the ground phase began, Trevor Dupuy forthrightly stated that TNDA’s estimates were likely to be too high.[2]
In a post-mortem on the forecast in March 1991, Dupuy identified three factors which TNDA’s estimates miscalculated:
an underestimation of the effects of the air campaign on Iraqi ground forces;
the apparent surprise of Iraqi forces; and
an underestimation of the combat effectiveness superiority of U.S. and Coalition forces.[3]
There were also factors that influenced the outcome that TNDA could not have known beforehand. Its estimates were based on an Iraqi Army force of 480,000, a figure derived from open source reports available at the time. However, the U.S. Air Force’s 1993 Gulf War Air Power Survey, using intelligence collected from U.S. government sources, calculated that there were only 336,000 Iraqi Army troops in and near Kuwait in January 1991 (out of a nominal 540,000) due to unit undermanning and troops on leave. The extended air campaign led a further 25-30% to desert and inflicted about 10% casualties, leaving only 200,000-220,000 depleted and demoralized Iraqi troops to face the U.S. and Coalition ground offensive.[4].
TNDA also underestimated the number of U.S. and Coalition ground troops, crediting them with a total of 435,000, when the actual number was approximately 540,000.[5] Instead of the Iraqi Army slightly outnumbering its opponents in Kuwait as TNDA approximated (480,000 to 435,000), U.S. and Coalition forces probably possessed a manpower advantage approaching 2 to 1 or more at the outset of the ground campaign.
There were some aspects of TNDA’s estimate that were remarkably accurate. Although no one foresaw the 38-day air campaign or the four-day ground battle, TNDA did come quite close to anticipating the overall duration of 42 days.
DESERT STORM as planned and executed also bore a striking resemblance to TNDA’s recommended course of action. The opening air campaign, followed by the “left hook” into the western desert by armored and airmobile forces, coupled with holding attacks and penetration of the Iraqi lines on the Kuwaiti-Saudi border were much like a combination of TNDA’s “Colorado Springs,” “Leavenworth,” and “Siege” scenarios. The only substantive difference was the absence of border raids and the use of U.S. airborne/airmobile forces to extend the depth of the “left hook” rather than seal off Kuwait from Iraq. The extended air campaign served much the same intent as TNDA’s “Siege” concept. TNDA even anticipated the potential benefit of the unprecedented effectiveness of the DESERT STORM aerial attack.
How effective “Colorado Springs” will be in damaging and destroying the military effectiveness of the Iraqi ground forces is debatable….On the other hand, the circumstances of this operation are different from past efforts of air forces to “go it alone.” The terrain and vegetation (or lack thereof) favor air attacks to an exceptional degree. And the air forces will be operating with weapons of hitherto unsuspected accuracy and effectiveness against fortified targets. Given these new circumstances, and considering recent historical examples in the 1967 and 1973 Arab-Israeli Wars, the possibility that airpower alone can cause such devastation, destruction, and demoralization as to destroy totally the effectiveness of the Iraqi ground forces cannot be ignored. [6]
In actuality, the U.S. Central Command air planners specifically targeted Saddam’s government in the belief that air power alone might force regime change, which would lead the Iraqi Army to withdraw from Kuwait. Another objective of the air campaign was to reduce the effectiveness of the Iraqi Army by 50% before initiating the ground offensive.[7]
Dupuy and his TNDA colleagues did anticipate that a combination of extended siege-like assault on Iraqi forces in Kuwait could enable the execution of a quick ground attack coup de grace with minimized losses.
The potential of success for such an operation, in the wake of both air and ground efforts made to reduce the Iraqi capacity for offensive along the lines of either Operation “Leavenworth’…or the more elaborate and somewhat riskier “RazzleDazzle”…would produce significant results within a short time. In such a case, losses for these follow-on ground operations would almost certainly be lower than if they had been launched shortly after the war began.[8]
Unfortunately, TNDA did not hazard a casualty estimate for a potential “Colorado Springs/ Siege/Leavenworth/RazzleDazzle” combination scenario, a forecast for which might very well have come closer to the actual outcome.
[3] Trevor N. Dupuy, “Report on Pre-War Forecasting For Information and Comment: Accuracy of Pre-Kuwait War Forecasts by T.N. Dupuy and HERO-TNDA,” 18 March, 1991. This was published in the April 1991 edition of the online wargaming “fanzine” Simulations Online. The post-mortem also included a revised TNDM casualty calculation for U.S. forces in the ground war phase, using the revised assumptions, of 70 killed and 417 wounded, for a total of 496 casualties. The details used in this revised calculation were not provided in the post-mortem report, so its veracity cannot be currently assessed.
[4] Thomas A. Keaney and Eliot A. Cohen, Gulf War Airpower Survey Summary Report (Washington, D.C.: U.S. Department of the Air Force, 1993), pp. 7, 9-10, 107
[6] Trevor N. Dupuy, Curt Johnson, David L. Bongard, Arnold C. Dupuy, How To Defeat Saddam Hussein: Scenarios and Strategies for the Gulf War (New York: Warner Books, 1991), p. 58
Well, looks like President Obama is giving out casualty estimates for a potential intervention.
That used to be our job.
His estimate was for “sending significant ground forces back to the Middle East”
The results were:
1. “…could conceivably result in the deaths of 100 American soldiers every month.”
2. “…could take up to $10 billion a month…”
3. “….and leave as many as 500 troops wounded every month in addition to those killed…”
“Mr. Obama explained that his refusal to redeploy large numbers of troops to the region was rooted in the grim assumption that the casualties and costs would rival the worst of the Iraq war. “
Clearly this was a worst case situation based upon some study or analysis done. Do not know who did the study and I not think the study is in the public domain.
This is clearly just applying the Iraq War model to the current situation. In the case of Iraq, we had over 100,000 troops deployed and were directly and often by ourselves engaged with a major insurgency. This was generating 100 deaths on some months. This is 1200 a year. We lost people at that rate for four years in Iraq (2004 = 849, 2005 = 846, 2006 – 823, 2007 – 904).
On the other hand, it appear that most people talking intervention in Syria and Iraq appear to be discussing training missions with some ground support. I do not think anyone is seriously talking about putting a 100,000 troops back in. I think most people are talking about 10,000 to 20,000 troops primarily as trainers for the Syrian insurgents, the Kurds and the Iraq government. This is in effect what we currently have in Afghanistan. Our post surge losses there are more like 100 a year (2013 = 127, 2014 = 55, 2015 = 16).
Needless to say, loss rates are tied to the force size. A force fully engaged of 20,000 is not going to suffer the same number of losses as a force fully engaged of 100,000. And, we are looking at missions that are primarily training and support, which should suffer losses less than forces that are fully engaged.
Of course, The Dupuy Institute did a casualty estimate for a peacekeeping force of 20,000 for Bosnia, and we have done a casualty estimate for major counterinsurgency force of 100,000+ for Iraq. An estimate for a training and support mission of 20,000 people would be much lower than our estimate for Iraq.

 Over at his
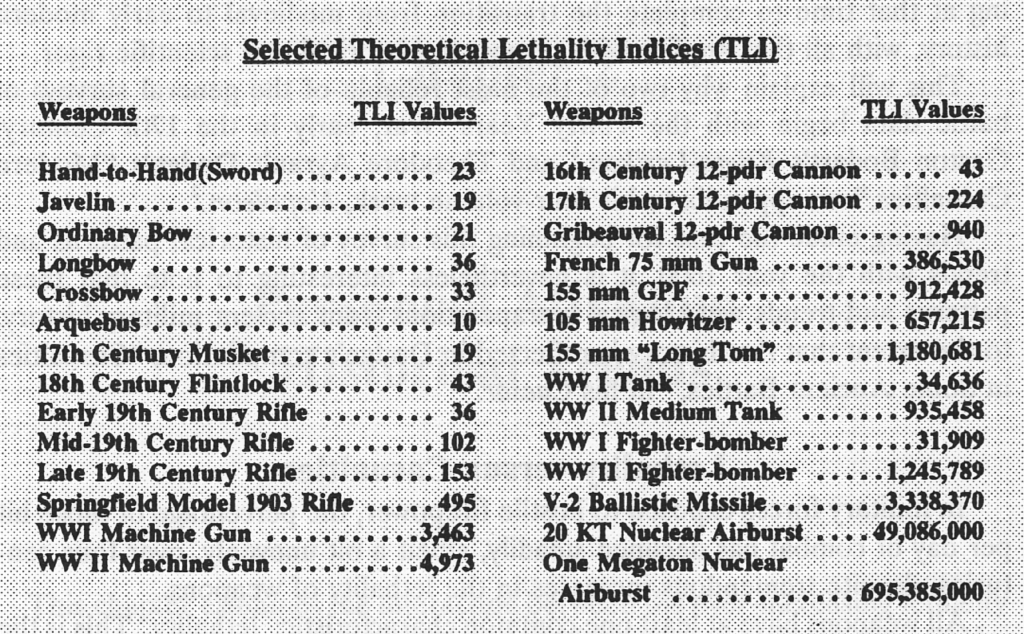


 As the U.S. Army and the national security community seek a sense of