[This post is based on “Iranian Casualties in the Iran-Iraq War: A Reappraisal,” by H. W. Beuttel, originally published in the December 1997 edition of the International TNDM Newsletter.]
By January 1982 Iran held some 28,423 Iraqi PoWs to Iraq’s 5,285 Iranian captives.[29] In early 1984 Iran held 50,000 Iraqis to Iraq’s 7,300 Iranian PoWs.[30] In August 1986 Iran claimed to hold some 52,000 Iraqi PoWs.[31] Just before the cease-fire in 1988 the International Commission of the Red Cross (ICRC) estimated 49,285 Iraqi PoWs in fifteen Iranian camps and 12,747 Iranians in ten Iraqi camps.[32]
On 9 August 1988 the ICRC count was 50,182 Iraqi PoWs held in Iran to 13,526 Iranians in Iraqi captivity.[33] Iran had at least 8,500 captured in the final Iraqi offensives oi July 1988 and another 700 on 23 August 1988 immediately after the cease-fire went into effect.[34] PoW release had begun long before the war ended. In August 1986 Iran had released 200 Iraqi PoWs and had unilaterally released some 620-650 previously.[35] By 18 October 1988 Iran and Iraq had agreed to begin PoW exchanges. Beginning 30 October 1988 each side exchanged 25 PoWs. Eight of the 25 Iranians were civilian internees captured early in the war.[36]
On 10 November Iran and Iraq agreed again to the exchange of 1,118 Iraqi and 411 Iranian PoWs who were badly wounded or ill.[37] However, after 156 Iraqis and only 57 Iranians had been released the exchange broke down by 27 November over 63 Iraqis who refused repatriation.[38] In January 1989 Iran released 131 sick and wounded Iraqis and Iraq reciprocated by releasing 124 Iranians.[39] In February Iran offered to release another 260 ill Iraqi PoWs. One hundred fifty-eight were released, but 27 refused to return.[40] In March 1989 the more or less official count of PoWs was 50,000 Iraqi to 18,902 Iranians.[41] Iran, on 10 April, released 70 disabled and sick Iraqi PoWs and on 23 May a further 49 plus 15 other PoWs of varied nationalities who fought for Iraq.[42] No further activity occurred until December when Iran proposed more sick and disabled PoWs be exchanged and suggested that a substantial number of Egyptian nationals were among the PoWs it held.[43] Eventually on 14 March 1990 Iran released twenty Egyptians captured fighting for Iraq.[44]
Post-Desert Storm PoW Exchanges
It was not until after Iraq’s invasion of Kuwait that the PoW issue came alive again. On 15 August 1990 Saddam Hussein offered to release all Iranian PoWs. He further allowed 17,000 Iranian nationals in Kuwait to return home. By 23 August PoW exchanges were running at 6,000 a day and some 21,000 Iraqi and Iranian PoWs had been repatriated.[45] By 4 September 23,798 Iranian and 24,250 Iraqis had been released.[46] On 16 November the two countries agreed to another exchange of 100 PoWs a day and a group of200 Iraqis was released on 4 December, another group of 200 on 10 December 1990.[47] There is no record of Iranian PoW releases by Iraq in this time period. However, a total of 39,043 Iranian PoWs were eventually released.[48]
On 1 June 1991 Iran claimed Iraq was still holding at least 5,000 Iranian PoWs, an assertion Iraq denied. When Iran repeated the claim in October, Iraq admitted it had 400 who refused repatriation.[49] During the 1991-92 time frame another 64 Iranian soldiers became PoWs during fighting with the NLA [National Liberation Army of Iran] and Kurdish groups supported by Iraq.[50]
Then in early 1991 some 5,000 Iraqi soldiers crossed into Iran to evade coalition forces in the Desert Storm War. Beginning in November 1992 Iran released 400, followed by releases of 1,000 (April 1993), 400 (May 1993), 450 (June 1993) and 459 (July 1993). Eventually 4,115 were released in fourteen intervals with the last known release bringing the total to 4,574.[51] At the same time Iran released 100 Iraqi PoWs from the War of Sacred Defense in May 1993.[52]
At that time the ICRC claimed to have had overseen the repatriation of over 80,000 PoWs held by both Iran and Iraq.[53] This figure is not borne out by the published numbers. At this time the maximum number of Iranian and Iraqi PoWs released from both the Iran-Iraq and Desert Storm wars stood at about 92,267, a discrepancy of 12,000. Some of the 17,000 repatriated civilian internees of the Iraqi invasion of Kuwait may have been counted. The ICRC still had some 19,000 Iraqis and 4,000 Iranians on its books as active PoWs.[54]
By July 1992 the only exchanges were those of 101 MIA bodies.[55] In December 1993 Iran complained Iraq was still holding 8,000 Iranian PoWs. The proof was that 26 Iranian civilian internees from the war had escaped and made it back to Iran that same month.[56]
In January 1994 Iran conceded that many of the personnel it listed as PoWs may have been KIA/MIA.[57] Then in July 1994 Iran accused Iraq of holding 16,000 Iranian PoWs.[58] According to the Red Cross Iran continued to hold as many as 19,000 Iraqi PoWs as of 1994.[59] In 1994 the ICRC calculated 4,168 confirmed Iranian PoWs still in Iraq and some 475 other unaccounted for Iranian PoWs.[60]
In August 1995 the Iraqis complained Iran still held 7,000 of their PoWs.[61] That same month Iran released 100 PoWs. The ICRC claimed at that time it had overseen the repatriation of 82,000 of 100,000 known PoWs of the war.[62] MIA exchanges continued with Iraq returning 144 dead and Iran 200 in June 1996.[63] Since then Iran released 150 of Iraqi PoWs as late as 28 October and 724 on 27 December 1996 making a total of 974 that year.[64] Iraq insisted there were still 20,000 Iraqis captive in Iran.[65]
“Not even a single Iranian PoW has been released by the Iraqi regime in the past five years.”
In January 1997 the two nations exchanged 60 Iranian and 70 Iraqi MIA remains, but Iraq again insisted Iran held 17,000 of its PoWs.[66] In August 1997 Saddam Hussein claimed Iran still held 20,000 (1997 ICRC figures about 13,000) Iraqi PoWs. He also claimed that all 39,000 Iranian PoWs held by Iraq had been freed except for a pilot downed during the early part of the war who was still being held as proof Iran started the whole thing.[67] The Iranians countered that 5,000 Iraqi PoWs had requested and been granted asylum in Iran which more or less agrees with 1994 ICRC figures for total remaining Iraqi PoWs (19,000-5,000 = 14,000).[68] In September 1997 47 more Iraqi PoWs were released.[69] In total Iran has released some 48,650 Iraqi PoWs.[70] In November 1997 Iran approved release of another 500 Iraqi PoWs.[71]
Speaking in September 1997 Brigadier General Abdullah Najafi, chairman of the Iranian PoW commission, stated that “not even a single Iranian PoW has been released by the Iraqi regime in the past five years.”[72] This suggests that some may have been released as late as 1992, but this author can find no record of this. The cold fact remains that since 1990 (or 1992 at the latest), no known living Iranian PoW has been recovered. 27,000 remains of MIAs have with another 39,000 estimated. A chronology of this confusing and somewhat contradictory chain of events is given below.
This author’s figures (admittedly incomplete) indicate the release of 92,267 PoWs (plus 547 more Iraqis as of November 1997) by both sides resulting from the Iran-Iraq and Desert Storm conflicts. If ICRC figures for “PoWs” (which seems to include PoWs and CIs from both conflicts) are correct 18,000 are still unreleased. Their own figures list 13,000 Iraqis and 5,000 Iranians still unreleased which makes up the difference.
Mr Beuttel, a former U.S. Army intelligence officer, was employed as a military analyst by Boeing Research & Development at the time of original publication. The views and opinions expressed in this article do not necessarily reflect those of The Boeing Company.
NOTES
[29] Edgar O’Ballance, The Gulf War, London: Brassey’s, 1988, p. 104,
[42] “Persian Gulf War Aftermath,” FYEO, NO. 211, 17 April 1989, p. 211-3; “Persian Gulf War, FYEO, NO. 214, 29 May 1989, p. 214-5; “Persian Gulf War Aftermath,” FYEO, NO. 215, 12 June 1989, p. 215-9.
[43] “Persian Gulf“, FYEO, NO. 229, 25 December 1989, p. 229-4. The reports indicated 13,000-20,000 Egyptians held, but this figure seems incredible.
[44] “Persian Gulf,” FYEO, N0. 236, 2 April 1990, p. 236-4,
[45] “Persian Gulf Crisis,” FYEO, No. 246, 20 August 1990, p. 246-3; “Persian Gulf Crisis,” FYEO, N0. 247, 3 September 1990, p. 247-1.
[46] “Persian Gulf Crisis,” FYEO, No. 248, 17 September 1990, p. 248-1.
[47] “Persian Gulf Crisis,” FYEO, No. 253, 26 November 1990, p. 253-2; “Persian Gulf Crisis,” FYEO, N0. 254, 10 December 1990, p. 254-1, 254-2; “Persian Gulf Crisis,” FYEO, No. 255, 24 December 1990, p. 255-1.
[48] “Iran Calls on Iraq to Release Prisoners of War,” Iran News, 18 August 1997.
[49] “War in the Gulf: Chronology of Events,” FYEO, No, 267, 10 June 1991, p. 267-2; “War in the Gulf: Chronology of Events,” FYEO, No. 277, 28 October 1991, p. 277-4.
[50] “Iran and Iraq,” International Commission of the Red Cross (ICRC) Annual Report 1996, 1 June 1997.
[51] “1,000 Iraqi Military Men to Return to Iraq,” 1, 17 February 1993; “Iran Releases More Iraqi PoWs,” IRNA, 22 April 1993; “Iran Frees Another Group of Iraqi Army Personnel,” IRNA, 19 May 1993; “450 Iraqi Military Men to Return Home Tomorrow,” IRNA, 22 June 1993; “Iran to Set Free 459 Iraqis Tomorrow,” IRNA, 13 July 1993.
[52] “Iran to Release More Iraqi PoWs,” IRNA, 26 May 1993.
[53] “Iran-Iraq Conflict: Repatriation Process May Resume,” ICRC Press Release, 96/40, 28 December 1996,
[54] “Aftermath of the Iran/Iraq War,” ICRCAnnual Report 1994, 30 May 1995
[55] “Gulf War Aftermath: Chronology of Events,” FYEO, No. 297, 3 August 1992, p. 297-3.
[56] “Persian Gulf,” FYEO, No, 333, 20 December 1993, p. 333-3: “Persian Gulf,” FYEO, No. 324, 10 January 1994, p. 324-3.
[57] “Persian Gulf,” FYEO, No. 335, 24 January 1994, p. 335-3.
[58] “Persian Gulf,” FYEO, No. 348, 25 July 1994, p. 348-21
[59] “Aftermath of the Iran/Iraq War,” ICRCAnnual Report 1994, 30 May 1995
[60] “Aftermath of the Iran/Iraq War,” ICRCAnnual Report 1994, 30 May 1995
[61] “Persian Gulf,” FYEO, No. 376, 21 August 1995, p. 376-41
[62] “Iran: 100 Iraqi Prisoners of War Set Free,” ICRC News 34, 23 August 1995.
[63] “Persian Gulf,” FYEO, No. 399, 8 July 1996, p. 399-4.
[64] “Iran Releases 150 Iraqi PoWs,” Compass Middle East News Wire, 28 October 1996; “General Najafi: Iran Continues to Release Remaining PoWs,” Tehran Times, 13 March 1997; “724 Iraqi Prisoners of War Freed Unilaterally,” Iran Review, No 2 (January 1997).
[65] “Persian Gulf,” FYEO, No. 412, 6 January 1997, p. 412-4.
[66] “Persian Gulf,” FYEO, No. 413, 20 January 1997, p. 413-3.
[67] “Iraq – Saddam Hits at Iran Over Jets, PoWs,” USNI Daily Defense News Capsules, 8 August 1997.
[68] “Issue of Iranian PoWs Should Be Publicized More,” IRNA, 18 August 1997.
[69] “Iran Releases More Iraqi PoWs Unilaterally,” IRNA, 25 September 1997.
[70] “Iran Calls on Iraq to Release Prisoners of War,” Iran News, 18 August 1997.
[71] “Iran to Unilaterally Release 500 Iraqi PoWs,” IRNA, 26 November 1997; “Leader Approves Release of Iraqi PoWs,” IRNA, 26 November 1997.
[72] “Iran Releases More Iraqi PoWs Unilaterally,” IRNA, 25 September 1997.
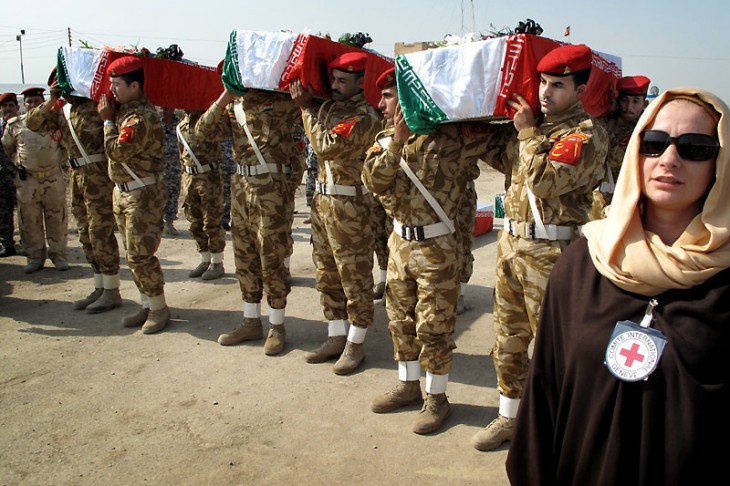
Shalmjah border, February 2010. An operation to repatriate the mortal remains of Iranian soldiers killed during the Iran-Iraq War is carried out under the aegis of the ICRC. [CC BY-NC-ND / ICRC / M. Greub]
[This post is based on “Iranian Casualties in the Iran-Iraq War: A Reappraisal,” by H. W. Beuttel, originally published in the December 1997 edition of the International TNDM Newsletter.]
By 1995 Iran had conducted seventeen dedicated MIA [missing in action] retrieval operations from wartime battlefields. Approximately 80% of the MIAs are believed to lie in Iraqi territory. In that year Iran proposed a joint Iranian-Iraqi accord to retrieve the missing of both sides.[18] Brigadier General Mir Feisel Baqerzadeh and IRGC Brigadier General Behahim Safaie head the Special Commission for MIA Retrieval. Iran claimed to have recovered or settled some 21,000 cases by early 1995. In that time 2,505 MIAs had been retrieved by joint search operations in Iraq and another 12,638 in Iranian territory, the latter representing 85% of those estimated missing in Iranian held ground. Back calculating these figures indicates total Iranian missing was now regarded as 72,753, up 20% from the original figure of 60,711. By October 1996 the count was 24,000 retrieved.[19] By June of 1997 the number of MIA cases resolved had risen to 33,000 including 6,000 death certificates issued at family request for individuals of whom no trace had ever been found.[20] As of September 1997 the total number of MIA bodies recovered stood at over 37,000 according to Brigadier General Baqerzadeh.[21] “Martyr” (i.e. killed in action) status entitles the family to a $24,000 lump sum death benefit as well as a $280 monthly pension with provision for $56 a month for each dependent child from the Foundation for the Martyrs,[22]
The rate of actual forensic identification of the remains is unknown. One source mentions a positive identification of some 900. The standard practice seems to be determination of the operation in which they were martyred and the provincial origins of units in that engagement. Wartime operations which have yielded large numbers of MIA remains are Beit al-Moqqadas-4, Kheiber, Karbala-4, Karbala-5, Karbala-6, Karbala-8, Karbala-10, Ramazan, Badr, Kheiber, Muslim Ibn-e Aqil, Wal Fajir Preliminary Operation, Wal Fajir-1, Wal Fajir-2, Wal Fajir-6, Wal Fajir-8, Fath-5, and the Iraqi attacks on Majnoon and Shalamech, The retrieval operations are often dangerous and occur in former minefields. As of 1995 eleven IRGC personnel had been killed and fourteen seriously wounded in MIA retrieval operations. Individual military units often recover their own MIAs. In a speech at Gurgan, Ali Mirtaheri, head of the committee in charge of search teams for MIAs of the 27th Huzrat-e Rasul Pasdaran Infantry Division, stated in November 1997 that divisional teams had recovered 1,610 MIA bodies. Forty-two team members from the division have been killed and another eighty maimed in the operations (probably from leftover mines).[23]
Due to the number of cases and the vigorous retrieval operations MIA funerals tend to be mass affairs. Burials in Tehran alone tell the story. In October 1993 208 were buried in Tehran and 360 in other locations. In October 1994 1,000 martyrs were buried in Tehran; in April 1995 another 600 of 3,000 just recovered MIAs and the following month 405 more in Mashad; in October 1995 600 were interred; 750 in October 1996; 1,000 more in January 1997; in July 1997 another 2,000 including 400 from Tehran Province were interred nationwide; in September 1997 200 of 1,233 interred nationwide, including 47 in Qazvin, 34 in Khuzistan, 5 in Shustar and 5 in Sistan-Baluchistan. Of these only 118 were unknowns.[24] Unrecovered Iranian MIAs are carried as active soldiers on their unit personnel rolls with their current status listed simply as “still at the front.” Iran has also recovered Iraqi MIAs, returning up to 400 bodies at a time in a mutual exchange program usually accomplished at the Khosrawi border station in Kermanshah Province.[25] A total of 31,000 Iraqi bodies have been so returned compared to 2,500 Iranian dead returned by Iraq as of January 1997.[26] In January 1997, in conjunction with the Iraqi return of the remains of sixty Iranian MIAs of the Wal Fajir Preliminary Operation, Brigadier General Mir Feisel Baqerzadeh stated that Iran was willing to assume all search responsibilities and associated costs for both Iraqi and Iranian MIAs on Iraqi territory should Iraq not wish to continue recovery operations.[27] In May 1997 Brigadier General Mohammed Balar, spokesman for the Commission for Iranian PoWs, called on international organizations to pressure Iraq to clarify the status of 20,000 Iranian MIAs.[28]
Mr Beuttel, a former U.S. Army intelligence officer, was employed as a military analyst by Boeing Research & Development at the time of original publication. The views and opinions expressed in this article do not necessarily reflect those of The Boeing Company.
NOTES
[18] “Iran Proposes Joint Committee to Decide Fate of PoWs,” Islamic Republic News Agency (IRNA), 18 October 1993.
[19] “The Remains of 750 Iranian Soldiers…” Al Akhbar Muslim World News, 15 October 1996.
[20] “Remains of Twenty Martyrs of Imposed War Handed Over to Iran,” IRNA, 1 June 1997.
[21] “Funeral Service to be Held Nationwide for 1,233 War Martyrs,” IRNA, 1 October 1997.
[23] “37,000 Bodies of Martyrs Discovered in Seven Years,” IRNA, 10 November 1997.
[24] “Funeral Procession War Martyrs,” IRNA, 7 July 1997; “The Remains of 750 Iranian Soldiers…”, Al Akhbar Muslim World News, 15 October 1996; “Funeral Service to be Held Nationwide for 1,233 War Martyrs,” IRNA, 1 October 1997; “Funeral Service for War Martyrs,” Iran Daily, 7 October 1997.
[25] “3,000 Bodies of Martyrs Found on Former Iran-Iraq Battlefields,” IRNA, 15 February 1995; “Funeral Service Held for 405 Martyrs in Mashad,” IRNA, 6 March 1995; “Cases of Over 21,000 MIA’s Settled So Far, IRNA, 19 February 1995; “568 More Bodies of Iran’s MIAs Uncovered,” IRNA, 17 October 1993; “Paper on PoW Issues,” IRNA, 31 May 1993; “IRGC Official: Investigations Continue to Find Our Martyrs’ Bodies,” IRNA, 20 February 1995; “Bodies of 65 Martyrs of Iraq-Imposed War Delivered to Iran,” IRNA, 13 August 1993; “Leader Attends Funeral for 600 Martys,” Iran News, 28 October 1995; “Leader Attends Funeral Service for 1,000 Martyrs,” Iran News, 20 October 1997; “War: MIAs Search Operation for MIAs Extended Another Year,” IRNA, 23 October 1995.
[26] “Funeral Ceremony for 1,000 Soldiers Killed in War Against Iraq,” Iran Weekly Press Digest, 21-31 January 1997.
[27] “Bodies of Sixty Martyrs Handed Over to Iran,” IRNA, 7 January 1997.
[28] “Iran Calls in International Clout to Find 20,000 PoWs,” Iran News, 20 May 1997.
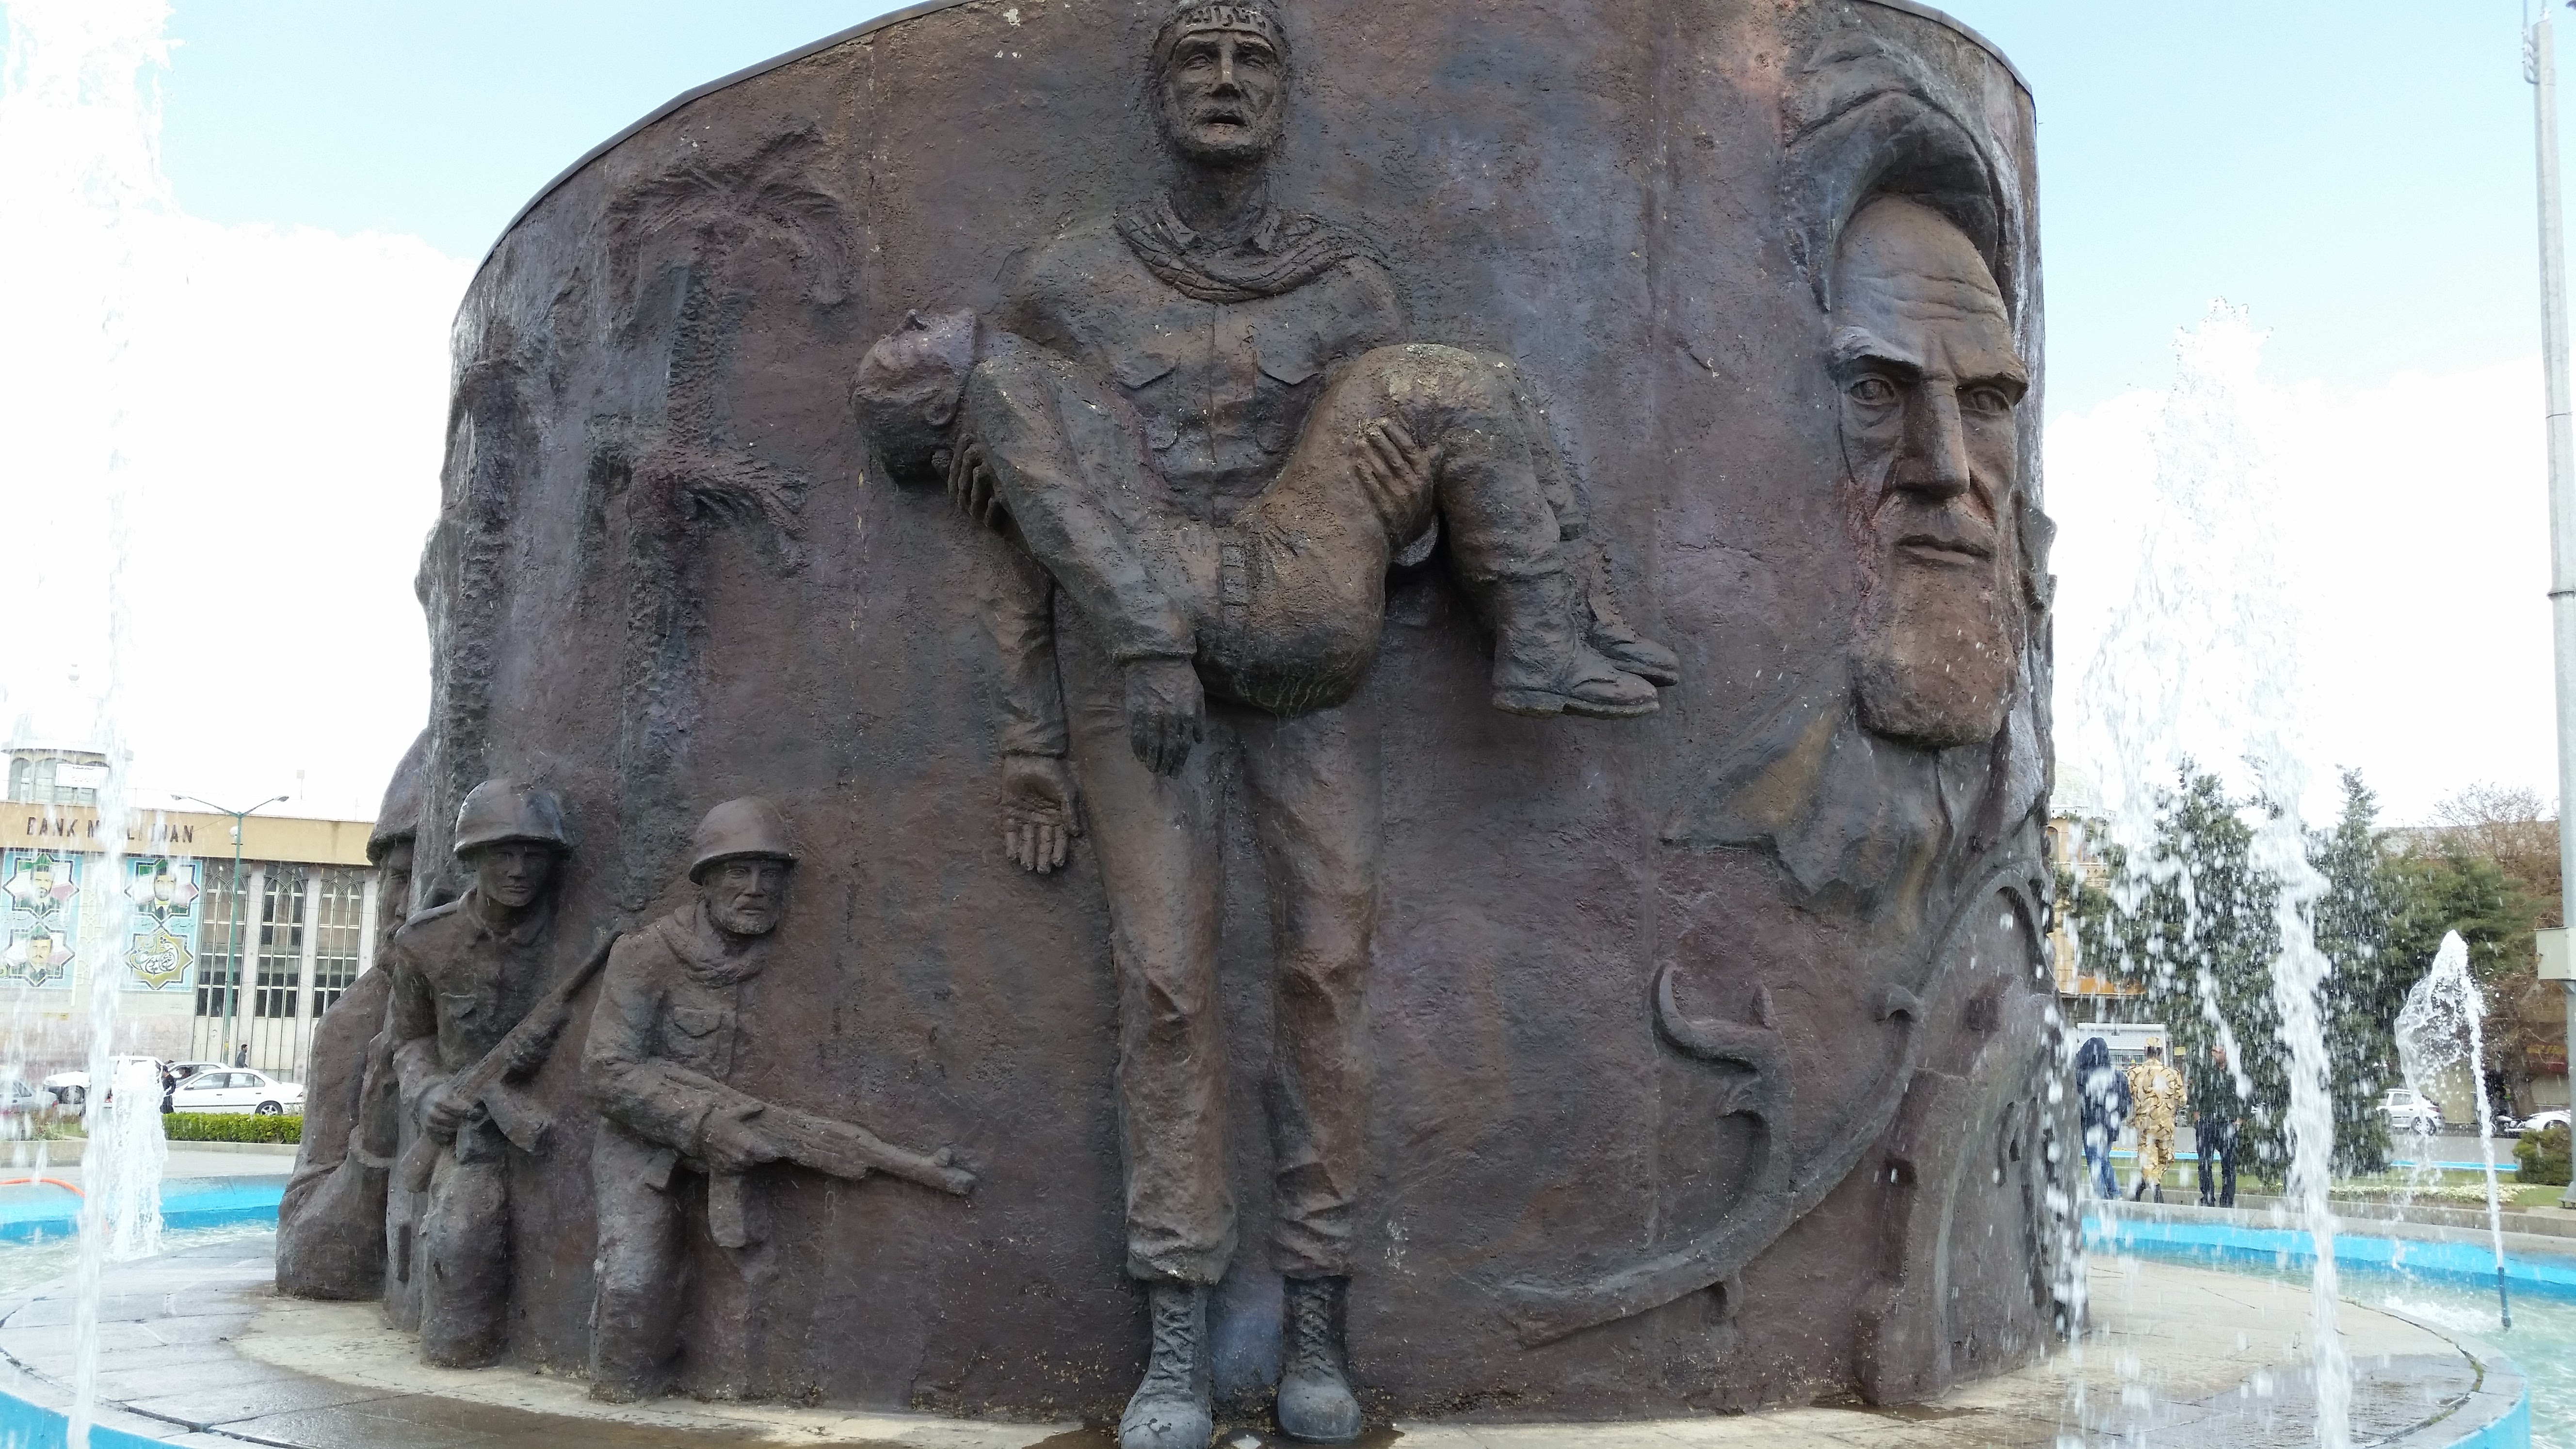
The Martyrs Memorial to the Iran-Iraq War (1980-1988) in Imam Khomeini Square, Hamadan, Iran. [KiwiOutThere]
[This post is based on “Iranian Casualties in the Iran-Iraq War: A Reappraisal,” by H. W. Beuttel, originally published in the December 1997 edition of the International TNDM Newsletter.]
The Iran-Iraq War was the longest sustained conventional war of the 20th Century. Lasting from 22 September 1980 to 20 August 1988, the seven years, ten months, and twenty-nine days of this conflict are some of the least understood in modem military history. The War of Sacred Defense to the Iranians and War of Second Qadissiya to Iraqis is the true “forgotten war” of our times. Seemingly never ending combat on a scale not witnessed since World War I and World War II was the norm. Casualties were popularly held to be enormous and, coupled with the lack of battlefield resolution year after year, led to frequent comparisons with the Western Front of World War I. Despite the fact that Iran had been the victim of naked Iraqi aggression, it was the Iraqis who were viewed as the “good guys” and actively supported by most nations in the world as well as the world press.
Studying the Iran-Iraq War is beset with difficulties. Much of the reporting done on the war was conducted in a slipshod manner. Both Iraq and Iran tended to exaggerate each other’s losses. As oftentimes Iraqi claims were the only source, accounts of Iranian losses became exaggerated. The data is highly fragmentary, often contradictory, usually vague in particulars, and often suspect as a whole. It defies complete reconciliation or adjudication in a quantitative sense as will be evident below.
There are few stand-alone good sources for the Iran-Iraq War in English. One of the first, and best, is Edgar O’Ballance, The Gulf War (1988). O’Ballance was a dedicated and knowledgeable military reporter who had covered many conflicts throughout the world. Unfortunately his book ends with the Karbala-9 offensive of April 1987. Another good reference is Dilip Hiro, The Longest War: The Iran-Iraq Military Conflict (1990). Hiro too is a careful journalist who specializes in South Asian affairs. Finally, there is Anthony Cordesman and Abraham Wagner, The Lessons of Modern War Volume III: The Iran-Iraq War (1990). This is the most comprehensive treatment of the conflict from a military standpoint and tends to be the “standard” reference. Finally there are Iranian sources, most notably articles appearing since the war in the Tehran Times, Iran News, the Islamic Republic News Agency (IRNA) and others.
This paper will approach the subject of losses in the conflict from the Iranian perspective. This is for two reasons. First, too often during the war Iraqi claims and figures were uncritically accepted out of prejudice against Iran. Secondly, since the War the Iranians have been more forthcoming about details of the conflict and though not providing direct figures, have released related quantified data that allows us to extrapolate better estimates. The first installment of this paper examines the evidence for total Iranian war casualties being far lower than popularly believed. It will also analyze this data to establish overall killed-to-wounded ratios, MIA and PoW issues, and the effectiveness of chemical warfare in the conflict. Later installments will analyze selected Iranian operations during the war to establish data such as average loss rate per day, mean length of engagements, advance rates, dispersion factors, casualty thresholds affecting breakpoint and other issues.
Casualties as Reported and Estimated
Too often incorrect formulae were applied to calculate casualties or the killed-to-wounded ratio. The standard belief was that Iran suffered two wounded for every killed—a ratio not seen since the ancient world. Colonel Trevor N. Dupuy established that the average distribution of killed-to-wounded in 20th Century warfare is on the order of 1:4 and in fact this relationship may be as old as the year 1700.[1] In Operation Peace for Galilee of 1982 the Israeli ratio of killed-to-wounded was on the order of 1:6.5 while the Syrian was 1:3.56.[2] At the same time in the Falklands, U.K. casualty ratio was 1:3. For Argentine ground forces it was 1:4.85.[3] Also it was assumed that Iran must have suffered 3-4 times the casualties of Iraqi forces in many given engagements on the basis of no good evidence this author can find.
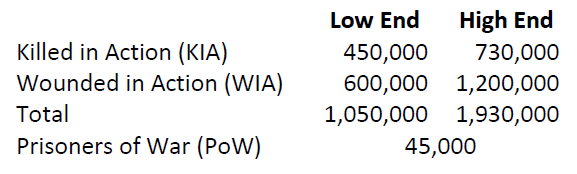
Typical Western estimates of Iranian losses in the war are given below.[4]
The lowest estimate of Iranian KIA was from the Pentagon which estimated the killed (military and civilian) at 262,000.[5]
At the end of 1980 the Iraqis claimed 4,500 Iranian KIA and 11,500 WIA.[6] Iraqi claims as of 22 September 1981 were 41,779 Iranian KIA[7] By the end of August 1981 other estimates placed it as 14,000-18,000 KIA and some 26,000-30,000 WIA.[8] Alternate estimates placed this at 14,000 KIA and 28,000 WIA,[9] Still others claimed 38,000 KIA.[10] During the first half of 1982 estimate was 90,000 Iranians killed.[11] Iran’s casualties in its 1984 offensives resulted in 30,000-50,000 more KIA.[12] In mid-1984 Iran’s KIA were 180,000-500,000 and WIA 500,000-825,000.[13] By 23 March 1985, Iranian KIA may have been 650,000 with 490,000 “seriously” wounded.[14] In September 1986 the count of Iranian dead was 240,000.[15] By April 1987 Iran had 600,000-700,000 KIA and twice that number wounded.[16] Iraq claimed 800,000 total Iranian KIA at the time of the cease-fire.[17] Figure 1 graphically depicts this reporting.
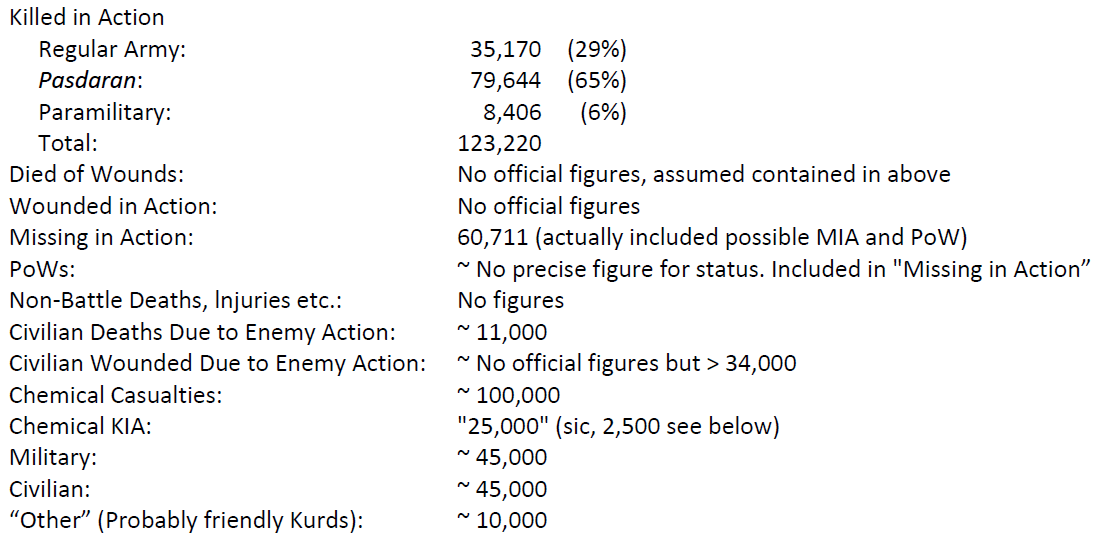
Official Iranian statistics released on 19 September 1988 immediately after the cease fire listed the following casualty figures:
Mr Beuttel, a former U.S. Army intelligence officer, was employed as a military analyst by Boeing Research & Development at the time of original publication. The views and opinions expressed in this article do not necessarily reflect those of The Boeing Company.
[3] Martin Middlebrook, Task Force: The Falklands War, 1982, Revised Edition; London: Penguin Books, 1987, pp. 382-385; Martin Middlebrook, The Fight for the Malvinas, London: Penguin Books, 1990, pp. 283-284. The low British ratio in the Falklands is a result of many ground forces being killed in mass while still aboard the Sir Galahad. This deflates the ratio vis a vis that actually experienced in ground combat. The shipborne dead should more properly be considered naval casualties.
UNDISCLOSED LOCATION, SYRIA (May 15, 2017)— U.S. Marines fortify a machine gun pit around their M777-A2 Howitzer in Syria, May 15, 2017. The unit has been conducting 24-hour all-weather fire support for Coalition’s local partners, the Syrian Democratic Forces, as part of Combined Joint Task Force-Operation Inherent Resolve. CJTF-OIR is the global coalition to defeat ISIS in Iraq and Syria. (U.S. Marine Corps photo by Sgt. Matthew Callahan)
Last week, the New York Timespublished an article by Thomas Gibbons-Neff that provided a detailed account of the fighting between U.S-advised Kurdish and Syrian militia forces and Russian mercenaries and Syrian and Arab fighters near the city of Deir Ezzor in eastern Syria on 7 February 2018. Gibbons-Neff stated the account was based on newly obtained documents and interviews with U.S. military personnel.
While Gibbons-Neff’s reporting fills in some details about the action, it differs in some respects to previous reporting, particularly a detailed account by Christoph Reuter, based on interviews from participants and witnesses in Syria, published previously in Spiegel Online.
According to Gibbons-Neff, the U.S. observed a buildup of combat forces supporting the regime of Syrian President Bashar al Assad in Deir Ezzor, south of the Euphrates River, which separated them from U.S.-backed Kurdish and Free Syrian militia forces and U.S. Special Operations Forces (SOF) and U.S. Marine Corps elements providing advice and assistance north of the river.
The pro-regime forces included “some Syrian government soldiers and militias, but American military and intelligence officials have said a majority were private Russian paramilitary mercenaries — and most likely a part of the Wagner Group, a company often used by the Kremlin to carry out objectives that officials do not want to be connected to the Russian government.”
After obtaining assurances from the Russian military chain-of-command in Syria that the forces were not theirs, Secretary of Defense James Mattis ordered “for the force, then, to be annihilated.”
Gibbons-Neff’s account focuses on the fighting that took place on the night of 7-8 February in the vicinity of a U.S. combat outpost located near a Conoco gas plant north of the Euphrates. While the article mentions the presence of allied Kurdish and Syrian militia fighters, it implies that the target of the pro-regime force was the U.S. outpost. It does not specify exactly where the pro-regime forces concentrated or the direction they advanced.
This is in contrast to Reuter’s Spiegel Online account, which reported a more complex operation. This included an initial probe across a bridge northwest of the Conoco plant on the morning of 7 February by pro-regime forces that included no Russians, which was repelled by warning shots from American forces.
After dark that evening, this pro-regime force attempted to cross the Euphrates again across a bridge to the southeast of the Conoco plant at the same time another pro-regime force advanced along the north bank of the Euphrates toward the U.S./Kurdish/Syrian forces from the town of Tabiya, southeast of the Conoco plant. According to Reuter, U.S. forces engaged both of these pro-regime advances north of the Euphrates.
While the Spiegel Online article advanced the claim that Russian mercenary forces were not leading the pro-regime attacks and that the casualties they suffered were due to U.S. collateral fire, Gibbons-Neff’s account makes the case that the Russians comprised at least a substantial part of at least one of the forces advancing on the U.S./Kurdish/Syrian bases and encampments in Deir Ezzor.
Based on documents it obtained, the Times asserts that 200-300 “pro-regime” personnel were killed out of an overall force of 500. Gibbons-Neff did not attempt to parse out the Russian share of these, but did mention that accounts in Russian media have risen from four dead as initially reported, to later claims of “perhaps dozens” of killed and wounded. U.S. government sources continue to assert that most of the casualties were Russian.
It is this figure of 200-300 killed that I have both found problematic in the past. A total of 200-300 killed and wounded overall seems far more likely, with approximately 100 dead and 100-200 wounded out of the much larger overall force of Russian mercenaries, Syrian government troops, and tribal militia fighters involved in the fighting.
Motivation for the Operation Remains Unclear
While the details of the engagement remain ambiguous, the identity of those responsible for directing the attacks and the motivations for doing so are hazy as well. In late February, CNN and the Washington Post reported that U.S. intelligence had detected communications between Yevgeny Prigozhin—a Russian businessman with reported ties to President Vladimir Putin, the Ministry of Defense, and Russian mercenaries—and Russian and Syrian officials in the weeks leading up to the attack. One such intercept alleges that Prigozhin informed a Syrian official in January that he had secured permission from an unidentified Russian minister to move forward with a “fast and strong” initiative in Syria in early February.
If the Deir Ezzor operation was indeed a clandestine operation sanctioned by the Russian government, the motivation remains mysterious. Gibbons-Neff’s account implies that the operation was a direct assault on a U.S. military position by a heavily-armed and equipped combat force, an action that all involved surely understood beforehand would provoke a U.S. military reaction. Even if the attack was instead aimed at taking the Conoco gas plant or forcing the Kurdish and Free Syrian forces out of Deir Ezzor, the attackers surely must have known the presence of U.S. military forces would elicit the same response.
Rueter’s account of a more complex operations suggests that the attack was a probe to test the U.S. response to armed action aimed at the U.S.’s Kurdish and Free Syrian proxy forces. If so, it was done very clumsily. The build-up of pro-regime forces telegraphed the effort in advance and the force itself seems to have been tailored for combat rather than reconnaissance. The fact that the U.S. government inquired with the Russian military leadership in Syria in advance about the provenance of the force build-up should have been a warning that any attempt at surprise had been compromised.
Whether the operation was simply intended to obtain a tactical advantage or to probe the resolution of U.S. involvement in Syria, the outcome bears all the hallmarks of a major miscalculation. Russian “hybrid warfare” tactics sustained a decisive reverse, while the effectiveness of U.S. military capabilities received a decided boost. Russian and U.S. forces and their proxies continue to spar using information operations, particularly electronic warfare, but they have not directly engaged each other since. The impact of this may be short-lived however, depending on whether or not U.S. President Donald J. Trump carries through with his intention announced in early April to withdraw U.S. forces from eastern Syria.
Response to Niklas Zetterling’s Article by Christopher A. Lawrence
Mr. Zetterling is currently a professor at the Swedish War College and previously worked at the Swedish National Defense Research Establishment. As I have been having an ongoing dialogue with Prof. Zetterling on the Battle of Kursk, I have had the opportunity to witness his approach to researching historical data and the depth of research. I would recommend that all of our readers take a look at his recent article in the Journal of Slavic Military Studies entitled “Loss Rates on the Eastern Front during World War II.” Mr. Zetterling does his German research directly from the Captured German Military Records by purchasing the rolls of microfilm from the US National Archives. He is using the same German data sources that we are. Let me attempt to address his comments section by section:
The Database on Italy 1943-44:
Unfortunately, the Italian combat data was one of the early HERO research projects, with the results first published in 1971. I do not know who worked on it nor the specifics of how it was done. There are references to the Captured German Records, but significantly, they only reference division files for these battles. While I have not had the time to review Prof. Zetterling‘s review of the original research. I do know that some of our researchers have complained about parts of the Italian data. From what I’ve seen, it looks like the original HERO researchers didn’t look into the Corps and Army files, and assumed what the attached Corps artillery strengths were. Sloppy research is embarrassing, although it does occur, especially when working under severe financial constraints (for example, our Battalion-level Operations Database). If the research is sloppy or hurried, or done from secondary sources, then hopefully the errors are random, and will effectively counterbalance each other, and not change the results of the analysis. If the errors are all in one direction, then this will produce a biased result.
I have no basis to believe that Prof. Zetterling’s criticism is wrong, and do have many reasons to believe that it is correct. Until l can take the time to go through the Corps and Army files, I intend to operate under the assumption that Prof. Zetterling’s corrections are good. At some point I will need to go back through the Italian Campaign data and correct it and update the Land Warfare Database. I did compare Prof. Zetterling‘s list of battles with what was declared to be the forces involved in the battle (according to the Combat Data Subscription Service) and they show the following attached artillery:
It is clear that the battles were based on the assumption that here was Corps-level German artillery. A strength comparison between the two sides is displayed in the chart on the next page.
The Result Formula:
CEV is calculated from three factors. Therefore a consistent 20% error in casualties will result in something less than a 20% error in CEV. The mission effectiveness factor is indeed very “fuzzy,” and these is simply no systematic method or guidance in its application. Sometimes, it is not based upon the assigned mission of the unit, but its perceived mission based upon the analyst’s interpretation. But, while l have the same problems with the mission accomplishment scores as Mr. Zetterling, I do not have a good replacement. Considering the nature of warfare, I would hate to create CEVs without it. Of course, Trevor Dupuy was experimenting with creating CEVs just from casualty effectiveness, and by averaging his two CEV scores (CEVt and CEVI) he heavily weighted the CEV calculation for the TNDM towards measuring primarily casualty effectiveness (see the article in issue 5 of the Newsletter, “Numerical Adjustment of CEV Results: Averages and Means“). At this point, I would like to produce a new, single formula for CEV to replace the current two and its averaging methodology. I am open to suggestions for this.
Supply Situation:
The different ammunition usage rate of the German and US Armies is one of the reasons why adding a logistics module is high on my list of model corrections. This was discussed in Issue 2 of the Newsletter, “Developing a Logistics Model for the TNDM.” As Mr. Zetterling points out, “It is unlikely that an increase in artillery ammunition expenditure will result in a proportional increase in combat power. Rather it is more likely that there is some kind of diminished return with increased expenditure.” This parallels what l expressed in point 12 of that article: “It is suspected that this increase [in OLIs] will not be linear.”
The CEV does include “logistics.” So in effect, if one had a good logistics module, the difference in logistics would be accounted for, and the Germans (after logistics is taken into account) may indeed have a higher CEV.
General Problems with Non-Divisional Units Tooth-to-Tail Ratio
Point taken. The engagements used to test the TNDM have been gathered over a period of over 25 years, by different researchers and controlled by different management. What is counted when and where does change from one group of engagements to the next. While l do think this has not had a significant result on the model outcomes, it is “sloppy” and needs to be addressed.
The Effects of Defensive Posture
This is a very good point. If the budget was available, my first step in “redesigning” the TNDM would be to try to measure the effects of terrain on combat through the use of a large LWDB-type database and regression analysis. I have always felt that with enough engagements, one could produce reliable values for these figures based upon something other than judgement. Prof. Zetterling’s proposed methodology is also a good approach, easier to do, and more likely to get a conclusive result. I intend to add this to my list of model improvements.
Conclusions
There is one other problem with the Italian data that Prof. Zetterling did not address. This was that the Germans and the Allies had different reporting systems for casualties. Quite simply, the Germans did not report as casualties those people who were lightly wounded and treated and returned to duty from the divisional aid station. The United States and England did. This shows up when one compares the wounded to killed ratios of the various armies, with the Germans usually having in the range of 3 to 4 wounded for every one killed, while the allies tend to have 4 to 5 wounded for every one killed. Basically, when comparing the two reports, the Germans “undercount” their casualties by around 17 to 20%. Therefore, one probably needs to use a multiplier of 20 to 25% to match the two casualty systems. This was not taken into account in any the work HERO did.
Because Trevor Dupuy used three factors for measuring his CEV, this error certainly resulted in a slightly higher CEV for the Germans than should have been the case, but not a 20% increase. As Prof. Zetterling points out, the correction of the count of artillery pieces should result in a higher CEV than Col. Dupuy calculated. Finally, if Col. Dupuy overrated the value of defensive terrain, then this may result in the German CEV being slightly lower.
As you may have noted in my list of improvements (Issue 2, “Planned Improvements to the TNDM”), I did list “revalidating” to the QJM Database. [NOTE: a summary of the QJM/TNDM validation efforts can be found here.] As part of that revalidation process, we would need to review the data used in the validation data base first, account for the casualty differences in the reporting systems, and determine if the model indeed overrates the effect of terrain on defense.
Perhaps one of the most debated results of the TNDM (and its predecessors) is the conclusion that the German ground forces on average enjoyed a measurable qualitative superiority over its US and British opponents. This was largely the result of calculations on situations in Italy in 1943-44, even though further engagements have been added since the results were first presented. The calculated German superiority over the Red Army, despite the much smaller number of engagements, has not aroused as much opposition. Similarly, the calculated Israeli effectiveness superiority over its enemies seems to have surprised few.
However, there are objections to the calculations on the engagements in Italy 1943. These concern primarily the database, but there are also some questions to be raised against the way some of the calculations have been made, which may possibly have consequences for the TNDM.
Here it is suggested that the German CEV [combat effectiveness value] superiority was higher than originally calculated. There are a number of flaws in the original calculations, each of which will be discussed separately below. With the exception of one issue, all of them, if corrected, tend to give a higher German CEV.
The Database on Italy 1943-44
According to the database the German divisions had considerable fire support from GHQ artillery units. This is the only possible conclusion from the fact that several pieces of the types 15cm gun, 17cm gun, 21cm gun, and 15cm and 21cm Nebelwerfer are included in the data for individual engagements. These types of guns were almost exclusively confined to GHQ units. An example from the database are the three engagements Port of Salerno, Amphitheater, and Sele-Calore Corridor. These take place simultaneously (9-11 September 1943) with the German 16th Pz Div on the Axis side in all of them (no other division is included in the battles). Judging from the manpower figures, it seems to have been assumed that the division participated with one quarter of its strength in each of the two former battles and half its strength in the latter. According to the database, the number of guns were:
15cm gun
28
17cm gun
12
21cm gun
12
15cm NbW
27
21cm NbW
21
This would indicate that the 16th Pz Div was supported by the equivalent of more than five non-divisional artillery battalions. For the German army this is a suspiciously high number, usually there were rather something like one GHQ artillery battalion for each division, or even less. Research in the German Military Archives confirmed that the number of GHQ artillery units was far less than indicated in the HERO database. Among the useful documents found were a map showing the dispositions of 10th Army artillery units. This showed clearly that there was only one non-divisional artillery unit south of Rome at the time of the Salerno landings, the III/71 Nebelwerfer Battalion. Also the 557th Artillery Battalion (17cm gun) was present, it was included in the artillery regiment (33rd Artillery Regiment) of 15th Panzergrenadier Division during the second half of 1943. Thus the number of German artillery pieces in these engagements is exaggerated to an extent that cannot be considered insignificant. Since OLI values for artillery usually constitute a significant share of the total OLI of a force in the TNDM, errors in artillery strength cannot be dismissed easily.
While the example above is but one, further archival research has shown that the same kind of error occurs in all the engagements in September and October 1943. It has not been possible to check the engagements later during 1943, but a pattern can be recognized. The ratio between the numbers of various types of GHQ artillery pieces does not change much from battle to battle. It seems that when the database was developed, the researchers worked with the assumption that the German corps and army organizations had organic artillery, and this assumption may have been used as a “rule of thumb.” This is wrong, however; only artillery staffs, command and control units were included in the corps and army organizations, not firing units. Consequently we have a systematic error, which cannot be corrected without changing the contents of the database. It is worth emphasizing that we are discussing an exaggeration of German artillery strength of about 100%, which certainly is significant. Comparing the available archival records with the database also reveals errors in numbers of tanks and antitank guns, but these are much smaller than the errors in artillery strength. Again these errors do always inflate the German strength in those engagements l have been able to check against archival records. These errors tend to inflate German numerical strength, which of course affects CEV calculations. But there are further objections to the CEV calculations.
The Result Formula
The “result formula” weighs together three factors: casualties inflicted, distance advanced, and mission accomplishment. It seems that the first two do not raise many objections, even though the relative weight of them may always be subject to argumentation.
The third factor, mission accomplishment, is more dubious however. At first glance it may seem to be natural to include such a factor. Alter all, a combat unit is supposed to accomplish the missions given to it. However, whether a unit accomplishes its mission or not depends both on its own qualities as well as the realism of the mission assigned. Thus the mission accomplishment factor may reflect the qualities of the combat unit as well as the higher HQs and the general strategic situation. As an example, the Rapido crossing by the U.S. 36th Infantry Division can serve. The division did not accomplish its mission, but whether the mission was realistic, given the circumstances, is dubious. Similarly many German units did probably, in many situations, receive unrealistic missions, particularly during the last two years of the war (when most of the engagements in the database were fought). A more extreme example of situations in which unrealistic missions were given is the battle in Belorussia, June-July 1944, where German units were regularly given impossible missions. Possibly it is a general trend that the side which is fighting at a strategic disadvantage is more prone to give its combat units unrealistic missions.
On the other hand it is quite clear that the mission assigned may well affect both the casualty rates and advance rates. If, for example, the defender has a withdrawal mission, advance may become higher than if the mission was to defend resolutely. This must however not necessarily be handled by including a missions factor in a result formula.
I have made some tentative runs with the TNDM, testing with various CEV values to see which value produced an outcome in terms of casualties and ground gained as near as possible to the historical result. The results of these runs are very preliminary, but the tendency is that higher German CEVs produce more historical outcomes, particularly concerning combat.
Supply Situation
According to scattered information available in published literature, the U.S. artillery fired more shells per day per gun than did German artillery. In Normandy, US 155mm M1 howitzers fired 28.4 rounds per day during July, while August showed slightly lower consumption, 18 rounds per day. For the 105mm M2 howitzer the corresponding figures were 40.8 and 27.4. This can be compared to a German OKH study which, based on the experiences in Russia 1941-43, suggested that consumption of 105mm howitzer ammunition was about 13-22 rounds per gun per day, depending on the strength of the opposition encountered. For the 150mm howitzer the figures were 12-15.
While these figures should not be taken too seriously, as they are not from primary sources and they do also reflect the conditions in different theaters, they do at least indicate that it cannot be taken for granted that ammunition expenditure is proportional to the number of gun barrels. In fact there also exist further indications that Allied ammunition expenditure was greater than the German. Several German reports from Normandy indicate that they were astonished by the Allied ammunition expenditure.
It is unlikely that an increase in artillery ammunition expenditure will result in a proportional increase combat power. Rather it is more likely that there is some kind of diminished return with increased expenditure.
General Problems with Non-Divisional Units
A division usually (but not necessarily) includes various support services, such as maintenance, supply, and medical services. Non-divisional combat units have to a greater extent to rely on corps and army for such support. This makes it complicated to include such units, since when entering, for example, the manpower strength and truck strength in the TNDM, it is difficult to assess their contribution to the overall numbers.
Furthermore, the amount of such forces is not equal on the German and Allied sides. In general the Allied divisional slice was far greater than the German. In Normandy the US forces on 25 July 1944 had 812,000 men on the Continent, while the number of divisions was 18 (including the 5th Armored, which was in the process of landing on the 25th). This gives a divisional slice of 45,000 men. By comparison the German 7th Army mustered 16 divisions and 231,000 men on 1 June 1944, giving a slice of 14,437 men per division. The main explanation for the difference is the non-divisional combat units and the logistical organization to support them. In general, non-divisional combat units are composed of powerful, but supply-consuming, types like armor, artillery, antitank and antiaircraft. Thus their contribution to combat power and strain on the logistical apparatus is considerable. However I do not believe that the supporting units’ manpower and vehicles have been included in TNDM calculations.
There are however further problems with non-divisional units. While the whereabouts of tank and tank destroyer units can usually be established with sufficient certainty, artillery can be much harder to pin down to a specific division engagement. This is of course a greater problem when the geographical extent of a battle is small.
Tooth-to-Tail Ratio
Above was discussed the lack of support units in non-divisional combat units. One effect of this is to create a force with more OLI per man. This is the result of the unit‘s “tail” belonging to some other part of the military organization.
In the TNDM there is a mobility formula, which tends to favor units with many weapons and vehicles compared to the number of men. This became apparent when I was performing a great number of TNDM runs on engagements between Swedish brigades and Soviet regiments. The Soviet regiments usually contained rather few men, but still had many AFVs, artillery tubes, AT weapons, etc. The Mobility Formula in TNDM favors such units. However, I do not think this reflects any phenomenon in the real world. The Soviet penchant for lean combat units, with supply, maintenance, and other services provided by higher echelons, is not a more effective solution in general, but perhaps better suited to the particular constraints they were experiencing when forming units, training men, etc. In effect these services were existing in the Soviet army too, but formally not with the combat units.
This problem is to some extent reminiscent to how density is calculated (a problem discussed by Chris Lawrence in a recent issue of the Newsletter). It is comparatively easy to define the frontal limit of the deployment area of force, and it is relatively easy to define the lateral limits too. It is, however, much more difficult to say where the rear limit of a force is located.
When entering forces in the TNDM a rear limit is, perhaps unintentionally, drawn. But if the combat unit includes support units, the rear limit is pushed farther back compared to a force whose combat units are well separated from support units.
To what extent this affects the CEV calculations is unclear. Using the original database values, the German forces are perhaps given too high combat strength when the great number of GHQ artillery units is included. On the other hand, if the GHQ artillery units are not included, the opposite may be true.
The Effects of Defensive Posture
The posture factors are difficult to analyze, since they alone do not portray the advantages of defensive position. Such effects are also included in terrain factors.
It seems that the numerical values for these factors were assigned on the basis of professional judgement. However, when the QJM was developed, it seems that the developers did not assume the German CEV superiority. Rather, the German CEV superiority seems to have been discovered later. It is possible that the professional judgement was about as wrong on the issue of posture effects as they were on CEV. Since the British and American forces were predominantly on the offensive, while the Germans mainly defended themselves, a German CEV superiority may, at least partly, be hidden in two high effects for defensive posture.
When using corrected input data on the 20 situations in Italy September-October 1943, there is a tendency that the German CEV is higher when they attack. Such a tendency is also discernible in the engagements presented in Hitler’s Last Gamble. Appendix H, even though the number of engagements in the latter case is very small.
As it stands now this is not really more than a hypothesis, since it will take an analysis of a greater number of engagements to confirm it. However, if such an analysis is done, it must be done using several sets of data. German and Allied attacks must be analyzed separately, and preferably the data would be separated further into sets for each relevant terrain type. Since the effects of the defensive posture are intertwined with terrain factors, it is very much possible that the factors may be correct for certain terrain types, while they are wrong for others. It may also be that the factors can be different for various opponents (due to differences in training, doctrine, etc.). It is also possible that the factors are different if the forces are predominantly composed of armor units or mainly of infantry.
One further problem with the effects of defensive position is that it is probably strongly affected by the density of forces. It is likely that the main effect of the density of forces is the inability to use effectively all the forces involved. Thus it may be that this factor will not influence the outcome except when the density is comparatively high. However, what can be regarded as “high” is probably much dependent on terrain, road net quality, and the cross-country mobility of the forces.
Conclusions
While the TNDM has been criticized here, it is also fitting to praise the model. The very fact that it can be criticized in this way is a testimony to its openness. In a sense a model is also a theory, and to use Popperian terminology, the TNDM is also very testable.
It should also be emphasized that the greatest errors are probably those in the database. As previously stated, I can only conclude safely that the data on the engagements in Italy in 1943 are wrong; later engagements have not yet been checked against archival documents. Overall the errors do not represent a dramatic change in the CEV values. Rather, the Germans seem to have (in Italy 1943) a superiority on the order of 1.4-1.5, compared to an original figure of 1.2-1.3.
During September and October 1943, almost all the German divisions in southern Italy were mechanized or parachute divisions. This may have contributed to a higher German CEV. Thus it is not certain that the conclusions arrived at here are valid for German forces in general, even though this factor should not be exaggerated, since many of the German divisions in Italy were either newly raised (e.g., 26th Panzer Division) or rebuilt after the Stalingrad disaster (16th Panzer Division plus 3rd and 29th Panzergrenadier Divisions) or the Tunisian debacle (15th Panzergrenadier Division).
Consistent Scoring of Weapons and Aggregation of Forces: The Cornerstone of Dupuy’s Quantitative Analysis of Historical Land Battles by
James G. Taylor, PhD,
Dept. of Operations Research, Naval Postgraduate School
Introduction
Col. Trevor N. Dupuy was an American original, especially as regards the quantitative study of warfare. As with many prophets, he was not entirely appreciated in his own land, particularly its Military Operations Research (OR) community. However, after becoming rather familiar with the details of his mathematical modeling of ground combat based on historical data, I became aware of the basic scientific soundness of his approach. Unfortunately, his documentation of methodology was not always accepted by others, many of whom appeared to confuse lack of mathematical sophistication in his documentation with lack of scientific validity of his basic methodology.
The purpose of this brief paper is to review the salient points of Dupuy’s methodology from a system’s perspective, i.e., to view his methodology as a system, functioning as an organic whole to capture the essence of past combat experience (with an eye towards extrapolation into the future). The advantage of this perspective is that it immediately leads one to the conclusion that if one wants to use some functional relationship derived from Dupuy’s work, then one should use his methodologies for scoring weapons, aggregating forces, and adjusting for operational circumstances; since this consistency is the only guarantee of being able to reproduce historical results and to project them into the future.
Implications (of this system’s perspective on Dupuy’s work) for current DOD models will be discussed. In particular, the Military OR community has developed quantitative methods for imputing values to weapon systems based on their attrition capability against opposing forces and force interactions.[1] One such approach is the so-called antipotential-potential method[2] used in TACWAR[3] to score weapons. However, one should not expect such scores to provide valid casualty estimates when combined with historically derived functional relationships such as the so-called ATLAS casualty-rate curves[4] used in TACWAR, because a different “yard-stick” (i.e. measuring system for estimating the relative combat potential of opposing forces) was used to develop such a curve.
Overview of Dupuy’s Approach
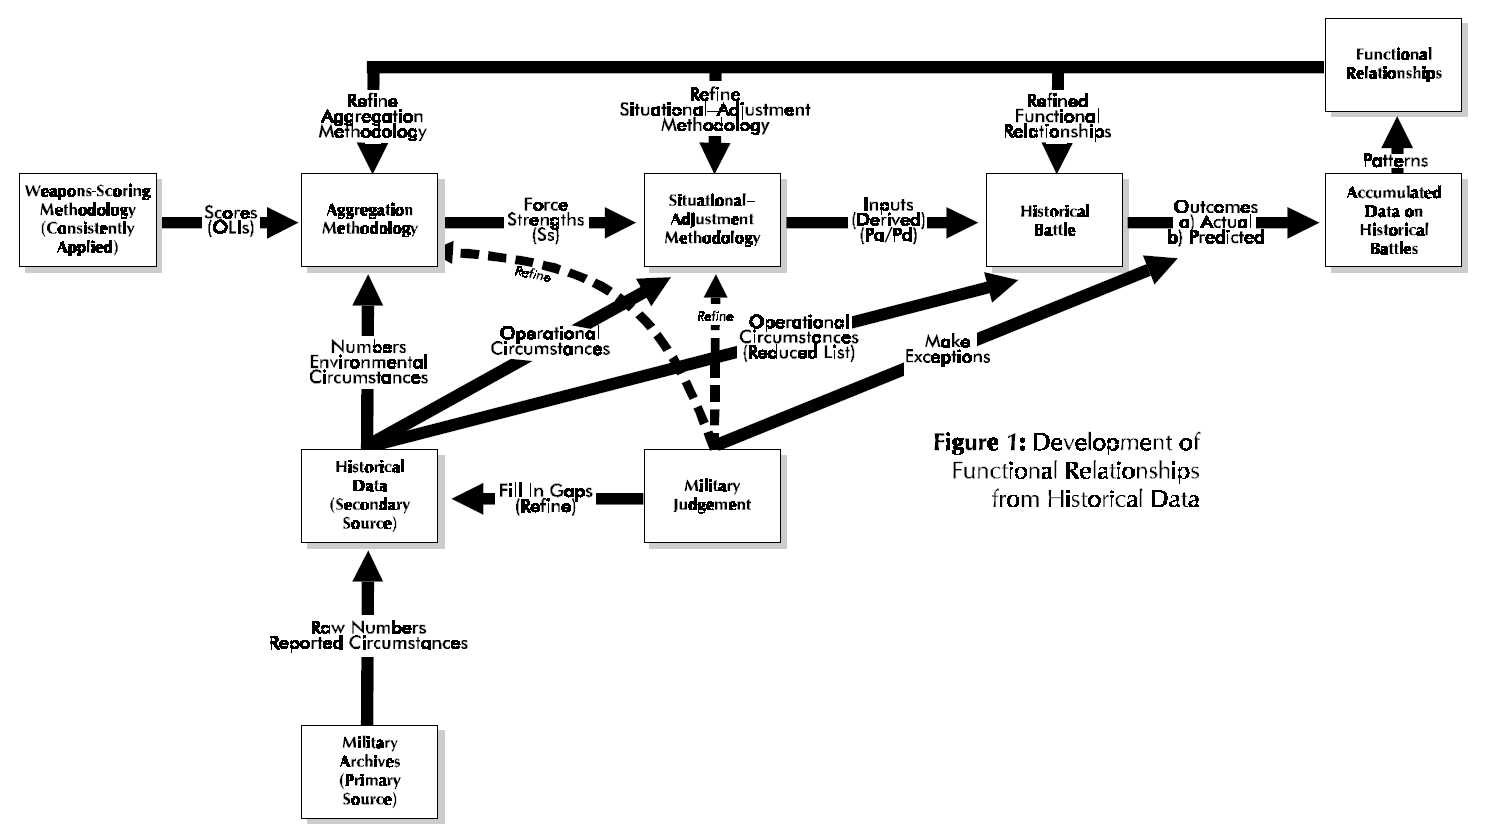
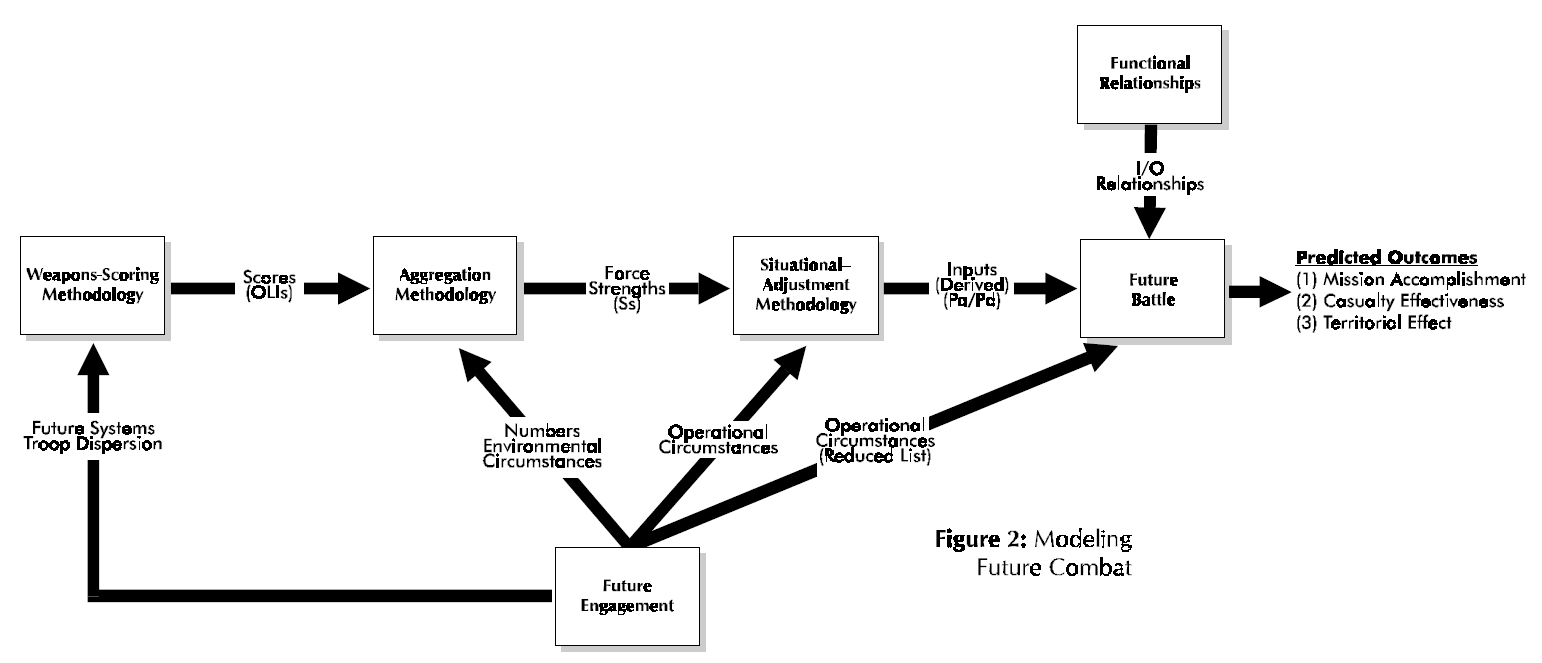
This section briefly outlines the salient features of Dupuy’s approach to the quantitative analysis and modeling of ground combat as embodied in his Tactical Numerical Deterministic Model (TNDM) and its predecessor the Quantified Judgment Model (QJM). The interested reader can find details in Dupuy [1979] (see also Dupuy [1985][5], [1987], [1990]). Here we will view Dupuy’s methodology from a system approach, which seeks to discern its various components and their interactions and to view these components as an organic whole. Essentially Dupuy’s approach involves the development of functional relationships from historical combat data (see Fig. 1) and then using these functional relationships to model future combat (see Fig, 2).
At the heart of Dupuy’s method is the investigation of historical battles and comparing the relationship of inputs (as quantified by relative combat power, denoted as Pa/Pd for that of the attacker relative to that of the defender in Fig. l)(e.g. see Dupuy [1979, pp. 59-64]) to outputs (as quantified by extent of mission accomplishment, casualty effectiveness, and territorial effectiveness; see Fig. 2) (e.g. see Dupuy [1979, pp. 47-50]), The salient point is that within this scheme, the main input[6] (i.e. relative combat power) to a historical battle is a derived quantity. It is computed from formulas that involve three essential aspects: (1) the scoring of weapons (e.g, see Dupuy [1979, Chapter 2 and also Appendix A]), (2) aggregation methodology for a force (e.g. see Dupuy [1979, pp. 43-46 and 202-203]), and (3) situational-adjustment methodology for determining the relative combat power of opposing forces (e.g. see Dupuy [1979, pp. 46-47 and 203-204]). In the force-aggregation step the effects on weapons of Dupuy’s environmental variables and one operational variable (air superiority) are considered[7], while in the situation-adjustment step the effects on forces of his behavioral variables[8] (aggregated into a single factor called the relative combat effectiveness value (CEV)) and also the other operational variables are considered (Dupuy [1987, pp. 86-89])
Figure 1.
Moreover, any functional relationships developed by Dupuy depend (unless shown otherwise) on his computational system for derived quantities, namely OLls, force strengths, and relative combat power. Thus, Dupuy’s results depend in an essential manner on his overall computational system described immediately above. Consequently, any such functional relationship (e.g. casualty-rate curve) directly or indirectly derivative from Dupuy‘s work should still use his computational methodology for determination of independent-variable values.
Fig l also reveals another important aspect of Dupuy’s work, the development of reliable data on historical battles, Military judgment plays an essential role in this development of such historical data for a variety of reasons. Dupuy was essentially the only source of new secondary historical data developed from primary sources (see McQuie [1970] for further details). These primary sources are well known to be both incomplete and inconsistent, so that military judgment must be used to fill in the many gaps and reconcile observed inconsistencies. Moreover, military judgment also generates the working hypotheses for model development (e.g. identification of significant variables).
At the heart of Dupuy’s quantitative investigation of historical battles and subsequent model development is his own weapons-scoring methodology, which slowly evolved out of study efforts by the Historical Evaluation Research Organization (HERO) and its successor organizations (cf. HERO [1967] and compare with Dupuy [1979]). Early HERO [1967, pp. 7-8] work revealed that what one would today call weapons scores developed by other organizations were so poorly documented that HERO had to create its own methodology for developing the relative lethality of weapons, which eventually evolved into Dupuy’s Operational Lethality Indices (OLIs). Dupuy realized that his method was arbitrary (as indeed is its counterpart, called the operational definition, in formal scientific work), but felt that this would be ameliorated if the weapons-scoring methodology be consistently applied to historical battles. Unfortunately, this point is not clearly stated in Dupuy’s formal writings, although it was clearly (and compellingly) made by him in numerous briefings that this author heard over the years.
Figure 2.
In other words, from a system’s perspective, the functional relationships developed by Colonel Dupuy are part of his analysis system that includes this weapons-scoring methodology consistently applied (see Fig. l again). The derived functional relationships do not stand alone (unless further empirical analysis shows them to hold for any weapons-scoring methodology), but function in concert with computational procedures. Another essential part of this system is Dupuy‘s aggregation methodology, which combines numbers, environmental circumstances, and weapons scores to compute the strength (S) of a military force. A key innovation by Colonel Dupuy [1979, pp. 202- 203] was to use a nonlinear (more precisely, a piecewise-linear) model for certain elements of force strength. This innovation precluded the occurrence of military absurdities such as air firepower being fully substitutable for ground firepower, antitank weapons being fully effective when armor targets are lacking, etc‘ The final part of this computational system is Dupuy’s situational-adjustment methodology, which combines the effects of operational circumstances with force strengths to determine relative combat power, e.g. Pa/Pd.
To recapitulate, the determination of an Operational Lethality Index (OLI) for a weapon involves the combination of weapon lethality, quantified in terms of a Theoretical Lethality Index (TLI) (e.g. see Dupuy [1987, p. 84]), and troop dispersion[9] (e.g. see Dupuy [1987, pp. 84- 85]). Weapons scores (i.e. the OLIs) are then combined with numbers (own side and enemy) and combat- environment factors to yield force strength. Six[10] different categories of weapons are aggregated, with nonlinear (i.e. piecewise-linear) models being used for the following three categories of weapons: antitank, air defense, and air firepower (i.e. c1ose—air support). Operational, e.g. mobility, posture, surprise, etc. (Dupuy [1987, p. 87]), and behavioral variables (quantified as a relative combat effectiveness value (CEV)) are then applied to force strength to determine a side’s combat-power potential.
Requirement for Consistent Scoring of Weapons, Force Aggregation, and Situational Adjustment for Operational Circumstances
The salient point to be gleaned from Fig.1 and 2 is that the same (or at least consistent) weapons—scoring, aggregation, and situational—adjustment methodologies be used for both developing functional relationships and then playing them to model future combat. The corresponding computational methods function as a system (organic whole) for determining relative combat power, e.g. Pa/Pd. For the development of functional relationships from historical data, a force ratio (relative combat power of the two opposing sides, e.g. attacker’s combat power divided by that of the defender, Pa/Pd is computed (i.e. it is a derived quantity) as the independent variable, with observed combat outcome being the dependent variable. Thus, as discussed above, this force ratio depends on the methodologies for scoring weapons, aggregating force strengths, and adjusting a force’s combat power for the operational circumstances of the engagement. It is a priori not clear that different scoring, aggregation, and situational-adjustment methodologies will lead to similar derived values. If such different computational procedures were to be used, these derived values should be recomputed and the corresponding functional relationships rederived and replotted.
However, users of the Tactical Numerical Deterministic Model (TNDM) (or for that matter, its predecessor, the Quantified Judgment Model (QJM)) need not worry about this point because it was apparently meticulously observed by Colonel Dupuy in all his work. However, portions of his work have found their way into a surprisingly large number of DOD models (usually not explicitly acknowledged), but the context and range of validity of historical results have been largely ignored by others. The need for recalibration of the historical data and corresponding functional relationships has not been considered in applying Dupuy’s results for some important current DOD models.
Implications for Current DOD Models
A number of important current DOD models (namely, TACWAR and JICM discussed below) make use of some of Dupuy’s historical results without recalibrating functional relationships such as loss rates and rates of advance as a function of some force ratio (e.g. Pa/Pd). As discussed above, it is not clear that such a procedure will capture the essence of past combat experience. Moreover, in calculating losses, Dupuy first determines personnel losses (expressed as a percent loss of personnel strength, i.e., number of combatants on a side) and then calculates equipment losses as a function of this casualty rate (e.g., see Dupuy [1971, pp. 219-223], also [1990, Chapters 5 through 7][11]). These latter functional relationships are apparently not observed in the models discussed below. In fact, only Dupuy (going back to Dupuy [1979][12] takes personnel losses to depend on a force ratio and other pertinent variables, with materiel losses being taken as derivative from this casualty rate.
For example, TACWAR determines personnel losses[13] by computing a force ratio and then consulting an appropriate casualty-rate curve (referred to as empirical data), much in the same fashion as ATLAS did[14]. However, such a force ratio is computed using a linear model with weapon values determined by the so-called antipotential-potential method[15]. Unfortunately, this procedure may not be consistent with how the empirical data (i.e. the casualty-rate curves) was developed. Further research is required to demonstrate that valid casualty estimates are obtained when different weapon scoring, aggregation, and situational-adjustment methodologies are used to develop casualty-rate curves from historical data and to use them to assess losses in aggregated combat models. Furthermore, TACWAR does not use Dupuy’s model for equipment losses (see above), although it does purport, as just noted above, to use “historical data” (e.g., see Kerlin et al. [1975, p. 22]) to compute personnel losses as a function (among other things) of a force ratio (given by a linear relationship), involving close air support values in a way never used by Dupuy. Although their force-ratio determination methodology does have logical and mathematical merit, it is not the way that the historical data was developed.
Moreover, RAND (Allen [1992]) has more recently developed what is called the situational force scoring (SFS) methodology for calculating force ratios in large-scale, aggregated-force combat situations to determine loss and movement rates. Here, SFS refers essentially to a force- aggregation and situation-adjustment methodology, which has many conceptual elements in common with Dupuy‘s methodology (except, most notably, extensive testing against historical data, especially documentation of such efforts). This SFS was originally developed for RSAS[16] and is today used in JICM[17]. It also apparently uses a weapon-scoring system developed at RAND[18]. It purports (no documentation given [citation of unpublished work]) to be consistent with historical data (including the ATLAS casualty-rate curves) (Allen [1992, p.41]), but again no consideration is given to recalibration of historical results for different weapon scoring, force-aggregation, and situational-adjustment methodologies. SFS emphasizes adjusting force strengths according to operational circumstances (the “situation”) of the engagement (including surprise), with many innovative ideas (but in some major ways has little connection with previous work of others[19]). The resulting model contains many more details than historical combat data would support. It also is methodology that differs in many essential ways from that used previously by any investigator. In particular, it is doubtful that it develops force ratios in a manner consistent with Dupuy’s work.
Final Comments
Use of (sophisticated) mathematics for modeling past historical combat (and extrapolating it into the future for planning purposes) is no reason for ignoring Dupuy’s work. One would think that the current Military OR community would try to understand Dupuy’s work before trying to improve and extend it. In particular, Colonel Dupuy’s various computational procedures (including constants) must be considered as an organic whole (i.e. a system) supporting the development of functional relationships. If one ignores this computational system and simply tries to use some isolated aspect, the result may be interesting and even logically sound, but it probably lacks any scientific validity.
REFERENCES
P. Allen, “Situational Force Scoring: Accounting for Combined Arms Effects in Aggregate Combat Models,” N-3423-NA, The RAND Corporation, Santa Monica, CA, 1992.
L. B. Anderson, “A Briefing on Anti-Potential Potential (The Eigen-value Method for Computing Weapon Values), WP-2, Project 23-31, Institute for Defense Analyses, Arlington, VA, March 1974.
B. W. Bennett, et al, “RSAS 4.6 Summary,” N-3534-NA, The RAND Corporation, Santa Monica, CA, 1992.
B. W. Bennett, A. M. Bullock, D. B. Fox, C. M. Jones, J. Schrader, R. Weissler, and B. A. Wilson, “JICM 1.0 Summary,” MR-383-NA, The RAND Corporation, Santa Monica, CA, 1994.
P. K. Davis and J. A. Winnefeld, “The RAND Strategic Assessment Center: An Overview and Interim Conclusions About Utility and Development Options,” R-2945-DNA, The RAND Corporation, Santa Monica, CA, March 1983.
T.N, Dupuy, Numbers. Predictions and War: Using History to Evaluate Combat Factors and Predict the Outcome of Battles, The Bobbs-Merrill Company, Indianapolis/New York, 1979,
T.N. Dupuy, Numbers Predictions and War, Revised Edition, HERO Books, Fairfax, VA 1985.
T.N. Dupuy, Understanding War: History and Theory of Combat, Paragon House Publishers, New York, 1987.
T.N. Dupuy, Attrition: Forecasting Battle Casualties and Equipment Losses in Modem War, HERO Books, Fairfax, VA, 1990.
General Research Corporation (GRC), “A Hierarchy of Combat Analysis Models,” McLean, VA, January 1973.
Historical Evaluation and Research Organization (HERO), “Average Casualty Rates for War Games, Based on Historical Data,” 3 Volumes in 1, Dunn Loring, VA, February 1967.
E. P. Kerlin and R. H. Cole, “ATLAS: A Tactical, Logistical, and Air Simulation: Documentation and User’s Guide,” RAC-TP-338, Research Analysis Corporation, McLean, VA, April 1969 (AD 850 355).
E.P. Kerlin, L.A. Schmidt, A.J. Rolfe, M.J. Hutzler, and D,L. Moody, “The IDA Tactical Warfare Model: A Theater-Level Model of Conventional, Nuclear, and Chemical Warfare, Volume II- Detailed Description” R-21 1, Institute for Defense Analyses, Arlington, VA, October 1975 (AD B009 692L).
R. McQuie, “Military History and Mathematical Analysis,” Military Review 50, No, 5, 8-17 (1970).
S.M. Robinson, “Shadow Prices for Measures of Effectiveness, I: Linear Model,” Operations Research 41, 518-535 (1993).
J.G. Taylor, Lanchester Models of Warfare. Vols, I & II. Operations Research Society of America, Alexandria, VA, 1983. (a)
J.G. Taylor, “A Lanchester-Type Aggregated-Force Model of Conventional Ground Combat,” Naval Research Logistics Quarterly 30, 237-260 (1983). (b)
NOTES
[1] For example, see Taylor [1983a, Section 7.18], which contains a number of examples. The basic references given there may be more accessible through Robinson [I993].
[2] This term was apparently coined by L.B. Anderson [I974] (see also Kerlin et al. [1975, Chapter I, Section D.3]).
[3] The Tactical Warfare (TACWAR) model is a theater-level, joint-warfare, computer-based combat model that is currently used for decision support by the Joint Staff and essentially all CINC staffs. It was originally developed by the Institute for Defense Analyses in the mid-1970s (see Kerlin et al. [1975]), originally referred to as TACNUC, which has been continually upgraded until (and including) the present day.
[4] For example, see Kerlin and Cole [1969], GRC [1973, Fig. 6-6], or Taylor [1983b, Fig. 5] (also Taylor [1983a, Section 7.13]).
[5] The only apparent difference between Dupuy [1979] and Dupuy [1985] is the addition of an appendix (Appendix C “Modified Quantified Judgment Analysis of the Bekaa Valley Battle”) to the end of the latter (pp. 241-251). Hence, the page content is apparently the same for these two books for pp. 1-239.
[6] Technically speaking, one also has the engagement type and possibly several other descriptors (denoted in Fig. 1 as reduced list of operational circumstances) as other inputs to a historical battle.
[7] In Dupuy [1979, e.g. pp. 43-46] only environmental variables are mentioned, although basically the same formulas underlie both Dupuy [1979] and Dupuy [1987]. For simplicity, Fig. 1 and 2 follow this usage and employ the term “environmental circumstances.”
[8] In Dupuy [1979, e.g. pp. 46-47] only operational variables are mentioned, although basically the same formulas underlie both Dupuy [1979] and Dupuy [1987]. For simplicity, Fig. 1 and 2 follow this usage and employ the term “operational circumstances.”
[9] Chris Lawrence has kindly brought to my attention that since the same value for troop dispersion from an historical period (e.g. see Dupuy [1987, p. 84]) is used for both the attacker and also the defender, troop dispersion does not actually affect the determination of relative combat power PM/Pd.
[10] Eight different weapon types are considered, with three being classified as infantry weapons (e.g. see Dupuy [1979, pp, 43-44], [1981 pp. 85-86]).
[11] Chris Lawrence has kindly informed me that Dupuy‘s work on relating equipment losses to personnel losses goes back to the early 1970s and even earlier (e.g. see HERO [1966]). Moreover, Dupuy‘s [1992] book Future Wars gives some additional empirical evidence concerning the dependence of equipment losses on casualty rates.
[12] But actually going back much earlier as pointed out in the previous footnote.
[13] See Kerlin et al. [1975, Chapter I, Section D.l].
[14] See Footnote 4 above.
[15] See Kerlin et al. [1975, Chapter I, Section D.3]; see also Footnotes 1 and 2 above.
[16] The RAND Strategy Assessment System (RSAS) is a multi-theater aggregated combat model developed at RAND in the early l980s (for further details see Davis and Winnefeld [1983] and Bennett et al. [1992]). It evolved into the Joint Integrated Contingency Model (JICM), which is a post-Cold War redesign of the RSAS (starting in FY92).
[17] The Joint Integrated Contingency Model (JICM) is a game-structured computer-based combat model of major regional contingencies and higher-level conflicts, covering strategic mobility, regional conventional and nuclear warfare in multiple theaters, naval warfare, and strategic nuclear warfare (for further details, see Bennett et al. [1994]).
[18] RAND apparently replaced one weapon-scoring system by another (e.g. see Allen [1992, pp. 9, l5, and 87-89]) without making any other changes in their SFS System.
[19] For example, both Dupuy’s early HERO work (e.g. see Dupuy [1967]), reworks of these results by the Research Analysis Corporation (RAC) (e.g. see RAC [1973, Fig. 6-6]), and Dupuy’s later work (e.g. see Dupuy [1979]) considered daily fractional casualties for the attacker and also for the defender as basic casualty-outcome descriptors (see also Taylor [1983b]). However, RAND does not do this, but considers the defender’s loss rate and a casualty exchange ratio as being the basic casualty-production descriptors (Allen [1992, pp. 41-42]). The great value of using the former set of descriptors (i.e. attacker and defender fractional loss rates) is that not only is casualty assessment more straight forward (especially development of functional relationships from historical data) but also qualitative model behavior is readily deduced (see Taylor [1983b] for further details).
In 1931, Lieutenant Colonel (later Brigadier General) Love, then a Medical Corps physician in the U.S. Army Medical Field Services School, published a study of American casualty data in the recent Great War, titled “War Casualties.”[1] This study was likely the source for tables used for casualty estimation by the U.S. Army through 1944.[2]
Love’s research was likely the basis for rate tables for calculating casualties that first appeared in the 1932 edition of the War Department’s Staff Officer’s Field Manual.[3]
Battle Casualties, including Killed, in Percent of Unit Strength, Staff Officer’s Field Manual (1932).
The 1932 Staff Officer’s Field Manual estimation methodology reflected Love’s sophisticated understanding of the factors influencing combat casualty rates. It showed that both the resistance and combat strength (and all of the factors that comprised it) of the enemy, as well as the equipment and state of training and discipline of the friendly troops had to be taken into consideration. The text accompanying the tables pointed out that loss rates in small units could be quite high and variable over time, and that larger formations took fewer casualties as a fraction of overall strength, and that their rates tended to become more constant over time. Casualties were not distributed evenly, but concentrated most heavily among the combat arms, and in the front-line infantry in particular. Attackers usually suffered higher loss rates than defenders. Other factors to be accounted for included the character of the terrain, the relative amount of artillery on each side, and the employment of gas.
The 1941 iteration of the Staff Officer’s Field Manual, now designated Field Manual (FM) 101-10[4], provided two methods for estimating battle casualties. It included the original 1932 Battle Casualties table, but the associated text no longer included the section outlining factors to be considered in calculating loss rates. This passage was moved to a note appended to a new table showing the distribution of casualties among the combat arms.
Rather confusingly, FM 101-10 (1941) presented a second table, Estimated Daily Losses in Campaign of Personnel, Dead and Evacuated, Per 1,000 of Actual Strength. It included rates for front line regiments and divisions, corps and army units, reserves, and attached cavalry. The rates were broken down by posture and tactical mission.
Estimated Daily Losses in Campaign of Personnel, Dead and Evacuated, Per 1,000 of Actual Strength, FM 101-10 (1941)
The source for this table is unknown, nor the method by which it was derived. No explanatory text accompanied it, but a footnote stated that “this table is intended primarily for use in school work and in field exercises.” The rates in it were weighted toward the upper range of the figures provided in the 1932 Battle Casualties table.
The October 1943 edition of FM 101-10 contained no significant changes from the 1941 version, except for the caveat that the 1932 Battle Casualties table “may or may not prove correct when applied to the present conflict.”
The October 1944 version of FM 101-10 incorporated data obtained from World War II experience.[5] While it also noted that the 1932 Battle Casualties table might not be applicable, the experiences of the U.S. II Corps in North Africa and one division in Italy were found to be in agreement with the table’s division and corps loss rates.
FM 101-10 (1944) included another new table, Estimate of Battle Losses for a Front-Line Division (in % of Actual Strength), meaning that it now provided three distinct methods for estimating battle casualties.
Estimate of Battle Losses for a Front-Line Division (in % of Actual Strength), FM 101-10 (1944)
Like the 1941 Estimated Daily Losses in Campaign table, the sources for this new table were not provided, and the text contained no guidance as to how or when it should be used. The rates it contained fell roughly within the span for daily rates for severe (6-8%) to maximum (12%) combat listed in the 1932 Battle Casualty table, but would produce vastly higher overall rates if applied consistently, much higher than the 1932 table’s 1% daily average.
FM 101-10 (1944) included a table showing the distribution of losses by branch for the theater based on experience to that date, except for combat in the Philippine Islands. The new chart was used in conjunction with the 1944 Estimate of Battle Losses for a Front-Line Division table to determine daily casualty distribution.
Distribution of Battle Losses–Theater of Operations, FM 101-10 (1944)
The final World War II version of FM 101-10 issued in August 1945[6] contained no new casualty rate tables, nor any revisions to the existing figures. It did finally effectively invalidate the 1932 Battle Casualties table by noting that “the following table has been developed from American experience in active operations and, of course, may not be applicable to a particular situation.” (original emphasis)
NOTES
[1] Albert G. Love, War Casualties, The Army Medical Bulletin, No. 24, (Carlisle Barracks, PA: 1931)
[2] This post is adapted from TDI, Casualty Estimation Methodologies Study, Interim Report (May 2005) (Altarum) (pp. 314-317).
[3] U.S. War Department, Staff Officer’s Field Manual, Part Two: Technical and Logistical Data (Government Printing Office, Washington, D.C., 1932)
[4] U.S. War Department, FM 101-10, Staff Officer’s Field Manual: Organization, Technical and Logistical Data (Washington, D.C., June 15, 1941)
[5] U.S. War Department, FM 101-10, Staff Officer’s Field Manual: Organization, Technical and Logistical Data (Washington, D.C., October 12, 1944)
[6] U.S. War Department, FM 101-10 Staff Officer’s Field Manual: Organization, Technical and Logistical Data (Washington, D.C., August 1, 1945)
Stretcher bearers of the East Surrey Regiment, with a Churchill tank of the North Irish Horse in the background, during the attack on Longstop Hill, Tunisia, 23 April 1943. [Imperial War Museum/Wikimedia]
British Army staff officers during World War II and the 1950s used a set of look-up tables which listed expected monthly losses in percentage of strength for various arms under various combat conditions. The origin of the tables is not known, but they were officially updated twice, in 1942 by a committee chaired by Major General Evett, and in 1951-1955 by the Army Operations Research Group (AORG).[2]
The methodology was based on staff predictions of one of three levels of operational activity, “Intense,” “Normal,” and “Quiet.” These could be applied to an entire theater, or to individual divisions. The three levels were defined the same way for both the Evett Committee and AORG rates:
The rates were broken down by arm and rank, and included battle and nonbattle casualties.
Rates of Personnel Wastage Including Both Battle and Non-battle Casualties According to the Evett Committee of 1942. (Percent per 30 days).
The Evett Committee rates were criticized during and after the war. After British forces suffered twice the anticipated casualties at Anzio, the British 21st Army Group applied a “double intense rate” which was twice the Evett Committee figure and intended to apply to assaults. When this led to overestimates of casualties in Normandy, the double intense rate was discarded.
From 1951 to 1955, AORG undertook a study of casualty rates in World War II. Its analysis was based on casualty data from the following campaigns:
Northwest Europe, 1944
6-30 June – Beachhead offensive
1 July-1 September – Containment and breakout
1 October-30 December – Semi-static phase
9 February to 6 May – Rhine crossing and final phase
Italy, 1944
January to December – Fighting a relatively equal enemy in difficult country. Warfare often static.
January to February (Anzio) – Beachhead held against severe and well-conducted enemy counter-attacks.
North Africa, 1943
14 March-13 May – final assault
Northwest Europe, 1940
10 May-2 June – Withdrawal of BEF
Burma, 1944-45
From the first four cases, the AORG study calculated two sets of battle casualty rates as percentage of strength per 30 days. “Overall” rates included KIA, WIA, C/MIA. “Apparent rates” included these categories but subtracted troops returning to duty. AORG recommended that “overall” rates be used for the first three months of a campaign.
The Burma campaign data was evaluated differently. The analysts defined a “force wastage” category which included KIA, C/MIA, evacuees from outside the force operating area and base hospitals, and DNBI deaths. “Dead wastage” included KIA, C/MIA, DNBI dead, and those discharged from the Army as a result of injuries.
The AORG study concluded that the Evett Committee underestimated intense loss rates for infantry and armor during periods of very hard fighting and overestimated casualty rates for other arms. It recommended that if only one brigade in a division was engaged, two-thirds of the intense rate should be applied, if two brigades were engaged the intense rate should be applied, and if all brigades were engaged then the intense rate should be doubled. It also recommended that 2% extra casualties per month should be added to all the rates for all activities should the forces encounter heavy enemy air activity.[1]
The AORG study rates were as follows:
Recommended AORG Rates of Personnel Wastage. (Percent per 30 days).
If anyone has further details on the origins and activities of the Evett Committee and AORG, we would be very interested in finding out more on this subject.
NOTES
[1] This post is adapted from The Dupuy Institute, Casualty Estimation Methodologies Study, Interim Report (May 2005) (Altarum) (pp. 51-53).
[2] Rowland Goodman and Hugh Richardson. “Casualty Estimation in Open and Guerrilla Warfare.” (London: Directorate of Science (Land), U.K. Ministry of Defence, June 1995.), Appendix A.

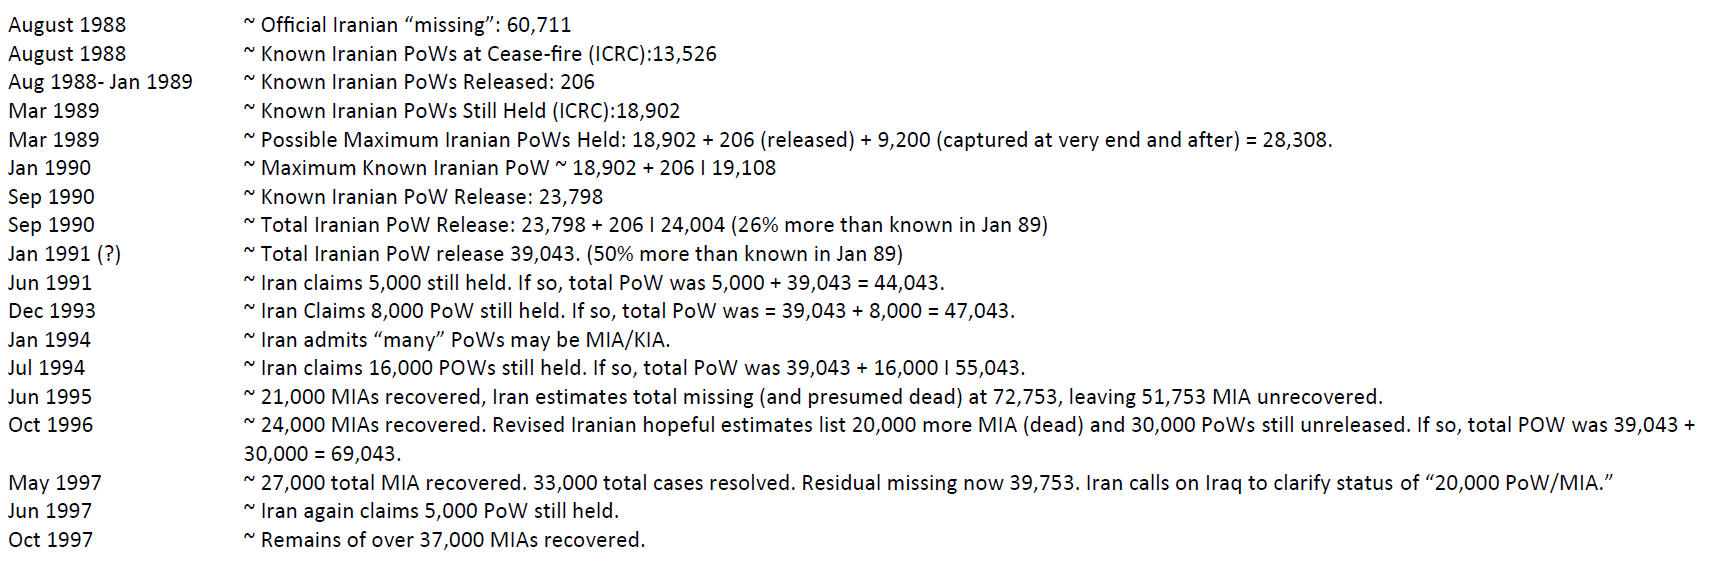 This author’s figures (admittedly incomplete) indicate the release of 92,267 PoWs (plus 547 more Iraqis as of November 1997) by both sides resulting from the Iran-Iraq and Desert Storm conflicts. If ICRC figures for “PoWs” (which seems to include PoWs and CIs from both conflicts) are correct 18,000 are still unreleased. Their own figures list 13,000 Iraqis and 5,000 Iranians still unreleased which makes up the difference.