Tag casualty estimation

Artillery Effectiveness vs. Armor (Part 1)

A U.S. M1 155mm towed artillery piece being set up for firing during the Battle of the Bulge, December 1944.

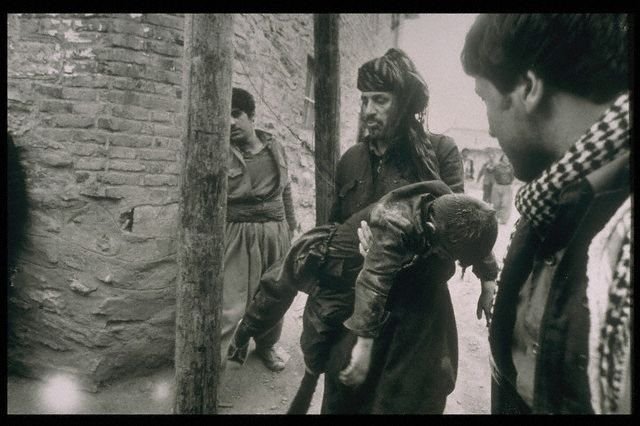
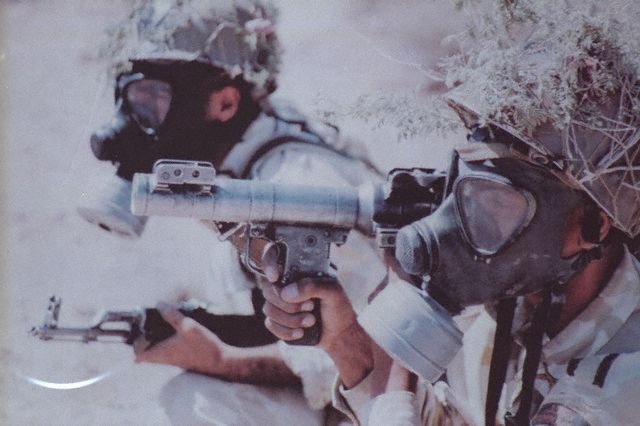
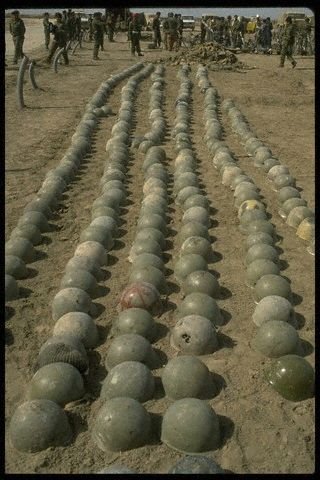
[This series of posts is adapted from the article “Artillery Effectiveness vs. Armor,” by Richard C. Anderson, Jr., originally published in the June 1997 edition of the International TNDM Newsletter.]

Posts in the series
Artillery Effectiveness vs. Armor (Part 1)
Artillery Effectiveness vs. Armor (Part 2-Kursk)
Artillery Effectiveness vs. Armor (Part 3-Normandy)
Artillery Effectiveness vs. Armor (Part 4-Ardennes)
Artillery Effectiveness vs. Armor (Part 5-Summary)

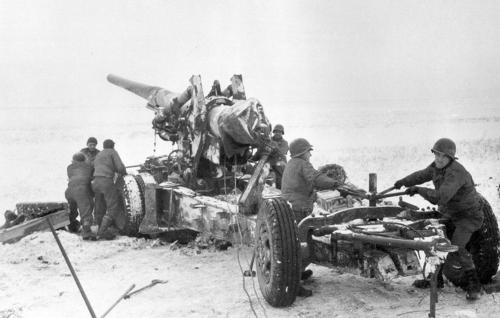
The effectiveness of artillery against exposed personnel and other “soft” targets has long been accepted. Fragments and blast are deadly to those unfortunate enough to not be under cover. What has also long been accepted is the relative—if not total—immunity of armored vehicles when exposed to shell fire. In a recent memorandum, the United States Army Armor School disputed the results of tests of artillery versus tanks by stating, “…the Armor School nonconcurred with the Artillery School regarding the suppressive effects of artillery…the M-1 main battle tank cannot be destroyed by artillery…”

This statement may in fact be true,[1] if the advancement of armored vehicle design has greatly exceeded the advancement of artillery weapon design in the last fifty years. [Original emphasis] However, if the statement is not true, then recent research by TDI[2] into the effectiveness of artillery shell fire versus tanks in World War II may be illuminating.

The TDI search found that an average of 12.8 percent of tank and other armored vehicle losses[3] were due to artillery fire in seven eases in World War II where the cause of loss could be reliably identified. The highest percent loss due to artillery was found to be 14.8 percent in the case of the Soviet 1st Tank Army at Kursk (Table II). The lowest percent loss due to artillery was found to be 5.9 percent in the case of Dom Bütgenbach (Table VIII).

The seven cases are split almost evenly between those that show armor losses to a defender and those that show losses to an attacker. The first four cases (Kursk, Normandy l. Normandy ll, and the “Pocket“) are engagements in which the side for which armor losses were recorded was on the defensive. The last three cases (Ardennes, Krinkelt. and Dom Bütgenbach) are engagements in which the side for which armor losses were recorded was on the offensive.

Four of the seven eases (Normandy I, Normandy ll, the “Pocket,” and Ardennes) represent data collected by operations research personnel utilizing rigid criteria for the identification of the cause of loss. Specific causes of loss were only given when the primary destructive agent could be clearly identified. The other three cases (Kursk, Krinkelt, and Dom Bütgenbach) are based upon combat reports that—of necessity—represent less precise data collection efforts.

However, the similarity in results remains striking. The largest identifiable cause of tank loss found in the data was, predictably, high-velocity armor piercing (AP) antitank rounds. AP rounds were found to be the cause of 68.7 percent of all losses. Artillery was second, responsible for 12.8 percent of all losses. Air attack as a cause was third, accounting for 7.4 percent of the total lost. Unknown causes, which included losses due to hits from multiple weapon types as well as unidentified weapons, inflicted 6.3% of the losses and ranked fourth. Other causes, which included infantry antitank weapons and mines, were responsible for 4.8% of the losses and ranked fifth.

NOTES

[1] The statement may be true, although it has an “unsinkable Titanic,” ring to it. It is much more likely that this statement is a hypothesis, rather than a truism.

[2] As pan of this article a survey of the Research Analysis Corporation’s publications list was made in an attempt to locate data from previous operations research on the subject. A single reference to the study of tank losses was found. Group 1 Alvin D. Coox and L. Van Loan Naisawald, Survey of Allied Tank Casualties in World War II, CONFIDENTIAL ORO Report T-117, 1 March 1951.

[3] The percentage loss by cause excludes vehicles lost due to mechanical breakdown or abandonment. lf these were included, they would account for 29.2 percent of the total lost. However, 271 of the 404 (67.1%) abandoned were lost in just two of the cases. These two cases (Normandy ll and the Falaise Pocket) cover the period in the Normandy Campaign when the Allies broke through the German defenses and began the pursuit across France.

Artillery Survivability In Modern Combat

The U.S. Army’s M109A6 Paladin 155 mm Self-Propelled Howitzer. [U.S. Army]
[This piece was originally published on 17 July 2017.]

Much attention is being given in the development of the U.S. joint concept of Multi-Domain Battle (MDB) to the implications of recent technological advances in long-range precision fires. It seems most of the focus is being placed on exploring the potential for cross-domain fires as a way of coping with the challenges of anti-access/area denial strategies employing long-range precision fires. Less attention appears to be given to assessing the actual combat effects of such weapons. The prevailing assumption is that because of the increasing lethality of modern weapons, battle will be bloodier than it has been in recent experience.

I have taken a look in previous posts at how the historical relationship identified by Trevor Dupuy between weapon lethality, battlefield dispersion, and casualty rates argues against this assumption with regard to personnel attrition and tank loss rates. What about artillery loss rates? Will long-range precision fires make ground-based long-range precision fire platforms themselves more vulnerable? Historical research suggests that trend was already underway before the advent of the new technology.

In 1976, Trevor Dupuy and the Historical Evaluation and Research Organization (HERO; one of TDI’s corporate ancestors) conducted a study sponsored by Sandia National Laboratory titled “Artillery Survivability in Modern War.” (PDF) The study focused on looking at historical artillery loss rates and the causes of those losses. It drew upon quantitative data from the 1973 Arab-Israel War, the Korean War, and the Eastern Front during World War II.

Conclusions

1. In the early wars of the 20th Century, towed artillery pieces were relatively invulnerable, and they were rarely severely damaged or destroyed except by very infrequent direct hits.

2. This relative invulnerability of towed artillery resulted in general lack of attention to the problems of artillery survivability through World War II.

3. The lack of effective hostile counter-artillery resources in the Korean and Vietnam wars contributed to continued lack of attention to the problem of artillery survivability, although increasingly armies (particularly the US Army) were relying on self-propelled artillery pieces.

4. Estimated Israeli loss statistics of the October 1973 War suggest that because of size and characteristics, self-propelled artillery is more vulnerable to modern counter-artillery means than was towed artillery in that and previous wars; this greater historical physical vulnerability of self-propelled weapons is consistent with recent empirical testing by the US Army.

5. The increasing physical vulnerability of modern self-propelled artillery weapons is compounded by other modern combat developments, including:

a. Improved artillery counter-battery techniques and resources;
b. Improved accuracy of air-delivered munitions;
c..increased lethality of modern artillery ammunition; and
d. Increased range of artillery and surface-to-surface missiles suitable for use against artillery.

6. Despite this greater vulnerability of self-propelled weapons, Israeli experience in the October war demonstrated that self-propelled artillery not only provides significant protection to cannoneers but also that its inherent mobility permits continued effective operation under circumstances in which towed artillery crews would be forced to seek cover, and thus be unable to fire their weapons. ‘

7. Paucity of available processed, compiled data on artillery survivability and vulnerability limits analysis and the formulation of reliable artillery loss experience tables or formulae.

8. Tentative analysis of the limited data available for this study indicates the following:

a. In “normal” deployment, percent weapon losses by standard weight classification are in the following proportions:

b. Towed artillery losses to hostile artillery (counterbattery) appear in general to very directly with battle intensity (as measured by percent personnel casualties per day), at a rate somewhat less than half of the percent personnel losses for units of army strength or greater; this is a straight-line relationship, or close to it; the stronger or more effective the hostile artillery is, the steeper the slope of the curve;

c. Towed artillery losses to all hostile anti-artillery means appears in general to vary directly with battle intensity at a rate about two-thirds of the-percent personnel losses for units of army strength or greater; the curve rises slightly more rapidly in high intensity combat than in normal or low-intensity combat; the stronger or more effective the hostile anti-artillery means (primarily air and counter-battery), the steeper the slope of the curve;

d. Self-propelled artillery losses appear to be generally consistent with towed losses, but at rates at least twice as great in comparison to battle intensity.

9. There are available in existing records of US and German forces in World war II, and US forces in the Korean and Vietnam Wars, unit records and reports that will permit the formulation of reliable artillery loss experience tables and formulae for those conflicts; these, with currently available and probably improved, data from the Arab-Israeli wars, will permit the formulation of reliable artillery loss experience tables and formulae for simulations of modern combat under current and foreseeable future conditions.

The study caveated these conclusions with the following observations:

Most of the artillery weapons in World War II were towed weapons. By the time the United States had committed small but significant numbers of self-propelled artillery pieces in Europe, German air and artillery counter-battery retaliatory capabilities had been significantly reduced. In the Korean and Vietnam wars, although most American artillery was self-propelled, the enemy had little counter-artillery capability either in the air or in artillery weapons and counter-battery techniques.

It is evident from vulnerability testing of current Army self-propelled weapons, that these weapons–while offering much more protection to cannoneers and providing tremendous advantages in mobility–are much more vulnerable to hostile action than are towed weapons, and that they are much more subject to mechanical breakdowns involving either the weapons mountings or the propulsion elements. Thus there cannot be a direct relationship between aggregated World War II data, or even aggregated Korean war or October War data, and current or future artillery configurations. On the other hand, the body of data from the October war where artillery was self-propelled is too small and too specialized by environmental and operational circumstances to serve alone as a paradigm of artillery vulnerability.

Despite the intriguing implications of this research, HERO’s proposal for follow on work was not funded. HERO only used easily accessible primary and secondary source data for the study. It noted much more primary source data was likely available but that it would require a significant research effort to compile it. (Research is always the expensive tent-pole in quantitative historical analysis. This seems to be why so little of it ever gets funded.) At the time of the study in 1976, no U.S. Army organization could identify any existing quantitative historical data or analysis on artillery losses, classified or otherwise. A cursory search on the Internet reveals no other such research as well. Like personnel attrition and tank loss rates, it would seem that artillery loss rates would be another worthwhile subject for quantitative analysis as part of the ongoing effort to develop the MDB concept.

Looking At Recent Reported Combat Loss Rates In Afghanistan

Afghan National Army soldiers simulate clearing a compound with help from their instructors at the 2nd Brigade, 205th Corps ANA Non-commissioned Officer Academy on Forward Operating Base Eagle in Zabul province Jan. 10, 2012 [{Wikimedia]

Last Friday, Rod Nordland published an article in the New York Times alleging that Afghan security forces (Afghan National Army (ANA) and police) had suffered an average of 57 killed in action (KIA) per day during the previous week, up from 22 killed per day in 2016. If true, such reports would indicate a dramatic increase in loss rates over the previous years.

These reported figures should be regarded critically, however. It is not clear how Nordland arrived at the total of 22 KIA per day for 2016. His article cited another article by Thomas Gibbons-Neff, published in the Times on 30 October 2017. This reported Afghan security forces casualties for 2016 at 6,700 KIA and 12,000 wounded in action (WIA), which works out to an average of 18.36 KIA per day (6,700/365), not 22. The total number of KIA + WIA works out to an average of 51.23 per day (18,700/365).

The lede of Gibbons-Neff’s 2017 article was that the U.S. and Afghan governments had stopped providing official strength and loss figures for the Afghan security forces. Citing the last report of the U.S. Special Inspector General for Afghanistan Reconstruction (SIGAR), Gibbons-Neff reported Afghan security forces losses from 1 January-8 May 2017 (126 days) as 2,531 KIA and 4,238 WIA. This works out to an average of 20.08 KIA (2,531/126) and 53.72 KIA + WIA (6,679/126) per day.

Nordland arrived at the figure of 57 KIA per day based on a report of 400 Afghan security forces killed in the week leading up the publication of his article on 21 September 2018. He calculated it by averaging the total over the previous seven days (400/7). Casualty rates in combat have been highly variable, historically. Brief spikes in rates are common. In the same paragraph reporting the 400 KIA total, Nordland quoted senior Afghan government officials stating that the daily average for recent months had been 30 to 40 KIA per day.

It is possible to use the figures cited by Nordland and Gibbons-Neff to make ballpark estimates for Afghan security forces casualties in 2017 and 2018. Even if the weekly loss of 400 KIA for 14-20 September 2018 represents an abnormally high total, it is reasonable to conclude that the Afghan security forces are very likely incurring sharply higher combat losses in 2018 than the previous two years. These figures do not include counts of missing or captured and thus underestimate the actual numbers of battle casualties being suffered by the Afghan forces. It is also possible that the estimates of 30-40 KIA per day apply only to the peak spring-to-autumn fighting season, which would somewhat reduce the overall 2018 KIA and WIA totals.

As Nordland reported, these losses are resulting in an increasing strain on the Afghan forces. His article stated that the strength of the ANA and police in April 2018 was 314,000, 38,000 below the authorized total of 352,000, and that the actual total was likely even lower due to fraudulent reporting and unreported desertions. The ANA suffered a monthly attrition rate of 2.9 percent in early 2017 from combat casualties, desertion, and failed reenlistments, requiring one-third of the overall force to be replaced by new recruits annually. That attrition rate is undoubtedly far higher now and almost certainly not sustainable for long.

In comparison, the Afghan government reported in August that its security forces had killed 42 Taliban fighters per day, or 1,300 per month. For the year ending in March 2018, it claimed to have killed 13,600 insurgent fighters. There has been no independent confirmation of these claims and they should be treated skeptically.

TDI Friday Read: Iranian Casualties In The 1980-88 Iran-Iraq War

This series of posts was based on the article “Iranian Casualties in the Iran-Iraq War: A Reappraisal,” by H. W. Beuttel, originally published in the December 1997 edition of the International TNDM Newsletter. Mr Beuttel was a former U.S. Army intelligence officer employed as a military analyst by Boeing Research & Development at the time of original publication. He also authored several updates to this original article, to be posted at a later date, which refined and updated his analysis.

Iranian Casualties in the Iran-Iraq War: A Reappraisal (1)

Iranian Missing In Action From The Iran-Iraq War (2)

Iranian Prisoners Of War From The Iran-Iraq War (3)

The “Missing” Iranian Prisoners Of War From The Iran-Iraq War (4)

Iranian Killed In Action and Died of Wounds In The Iran-Iraq War (5)

Iranian Wounded In Action In The Iran-Iraq War (6)

Iranian Chemical Casualties In The Iran-Iraq War (7)

Iranian Civilian Casualties In The Iran-Iraq War (8)

A Summary Estimate Of Iranian Casualties In The Iran-Iraq War (9)


A Summary Estimate Of Iranian Casualties In The Iran-Iraq War (9)

[Conflict Iran]

[This post is based on “Iranian Casualties in the Iran-Iraq War: A Reappraisal,” by H. W. Beuttel, originally published in the December 1997 edition of the International TNDM Newsletter.]


Posts in this series:
Iranian Casualties in the Iran-Iraq War: A Reappraisal
Iranian Missing In Action From The Iran-Iraq War
Iranian Prisoners of War From The Iran-Iraq War
The “Missing” Iranian Prisoners of War From The Iran-Iraq War
Iranian Killed In Action And Died Of Wounds In The Iran-Iraq War
Iranian Wounded In Action In The Iran-Iraq War
Iranian Chemical Casualties In The Iran-Iraq War
Iranian Civil Casualties In The Iran-Iraq War
A Summary Estimate Of Iranian Casualties In The Iran-Iraq War


If we estimate that at least 5,000,000 troops (about 12% of Iran’s then population) served in the war zone, then the military casualty distribution is not less than the following (Bold indicates the author’s choice from ranges):

Killed in Action/Died of Wounds: 188,000 (156,000-196,000) (17%)

Wounded in Action: 945,000 (754,000-1,110,000) (83%)

Severely Wounded/Disabled: 200,000 (18%) (Note: carve out of total wounded)

Missing in Action: 73,000 (6%) (Note: Carve out of total KIA plus several thousand possible defectors/collaborators)

PoW: 39,000-44,000

Total Military Battle Casualties (KIA + WIA): 1,133,000-1,302,000 (28% theater rate)

Possible Non-Battle Military Deaths: 74,000

Non-Battle Military Injuries: No idea.

With Civilian KIA (11,000) and WIA (34,000) and “chemical” (45,000) Total Hostile Action Casualties: 1,223,000

Possible Military Non-Battle Deaths (74,000):1,297,000

Total Deaths Due to the Imposed War: 273,000 (104% of Pentagon estimate of 262,000)

Of 5,000,000 estimated Iranian combatants (1 million regular army, 2 million Pasdaran, 2 million Baseej)

~ 4% were Killed in Action/Missing in Action

~ 4% were Disabled

~ 13% were Wounded

~ 1% were Non-Battle Deaths

~ 1% were PoWs

Total military losses all known causes ~ 27%

The military battle casualty total percentile (27%) is intermediate between that of World War I (50% ~ British Army) and World War II (13% ~ U.S. Army/U.S. Marine Corps, 22% British Army).[118]

The author acknowledges the highly speculative nature of much of the data and argument presented above. It is offered as a preliminary starting point to further study. As such, the author would appreciate hearing from anyone with additional data on this subject. In particular he would invite the Government of the Islamic Republic of Iran to provide any information that would corroborate, correct or expand on the information presented in this article.

NOTES

[118] Kenneth R. Timmerman, Death Lobby: How the West Armed Iraq, New York, Houghton Mifflin Company, 1991, pp. 406-407, n. 3

Iranian Civilian Casualties In The Iran-Iraq War (8)

[Conflict Iran]

[This post is based on “Iranian Casualties in the Iran-Iraq War: A Reappraisal,” by H. W. Beuttel, originally published in the December 1997 edition of the International TNDM Newsletter.]


Posts in this series:
Iranian Casualties in the Iran-Iraq War: A Reappraisal
Iranian Missing In Action From The Iran-Iraq War
Iranian Prisoners of War From The Iran-Iraq War
The “Missing” Iranian Prisoners of War From The Iran-Iraq War
Iranian Killed In Action And Died Of Wounds In The Iran-Iraq War
Iranian Wounded In Action In The Iran-Iraq War
Iranian Chemical Casualties In The Iran-Iraq War
Iranian Civil Casualties In The Iran-Iraq War
A Summary Estimate Of Iranian Casualties In The Iran-Iraq War


The Iran-Iraq War produced remarkably few civilian casualties compared to World War I or World War II rates. UNICEF data suggests that prior to World War I, civilians accounted for only 5% of all deaths in a given war. This rose to 15% in World War I and an astounding 65% in World War II.[113] Iran claims 11,000 civilian deaths as a result of the war primarily through Iraqi air and missile strikes. The author‘s own study of Iranian civilian deaths places it at about 8,800 known deaths, indicating this number is probably very close to the true figure. If so, civilian deaths accounted for just 5% of total war dead, a turn-of-the-century standard. The number of wounded has not been released, but this author’s figures can account for over 34,000 civilian wounded by air and missile strikes. Further, Iran claims 45,000 civilian “chemical” casualties. If all claims are true then approximately 90,000 civilians became casualties of the war.

This yields a military to civilian casualty ratio of 11:1. This is far better than the ratio claimed in recent wars of 1:9. This suggests that despite the hysteria surrounding “War of the Cities,” the Iranian civilian population was not severely at risk during the war. Compare this to World War II England where the one-year German V-1/V-2 campaign killed 8,588 and wounded 46,838.[114] Then contrast it to total English civilian casualties during World War II at 60,000 dead and 86,800 wounded due to the blitz and buzz bombs. U.K. military killed, wounded and missing (excluding PoW) were 582,900 in World War II giving a military-to-civilian casualty ratio of 4:1.[115] Of course the World War II German bombing and missile campaigns against England were far more severe than that experienced by Iran at the hands of Iraq.

Civilian chemical casualties match military in magnitude. At first this might seem strange. I have found no World War I data on military-to-civilian casualty ratios as regards chemical agents, so there is no point of comparison or contrast here. The high number of civilian chemical casualties seems to be a function of several factors. First some 2,000 Iranian towns and villages lay in areas where Iraqi forces employed chemical weapons.[116] Secondly, Iraqi chemical strikes were often delivered deep into Iranian rear areas to attack reinforcements and support troops. Casualties were often high as the rear echelon troops were less well equipped and prepared to cope with chemical attacks.[117] In these rear area attacks the civilian population density must have been much higher than on the front line. Further, civilians probably had no means of chemical defense. Witness the chemical attack on Halabja in March 1988 with mustard, nerve and cyanogen chloride which killed some 4,000-5,000 civilians and maimed 7,000 others, This may explain the 1:1 relationship between overall Iranian military and civilian chemical casualties.

Mr. Beuttel, a former U.S. Army intelligence officer, was employed as a military analyst by Boeing Research & Development at the time of original publication. The views and opinions expressed in this article do not necessarily reflect those of The Boeing Company.

NOTES

[113] Abstracts Obtained from Iran on Medical Research Conducted After the 1980-1988 Iran-Iraq War,” www.chronicillnet.org/PGWS/tuite/IRMED/IRANTOC.html

[114] Charles E. Heller, Chemical Warfare in World War I: The American Experience 1917-1918, Leavenworth Papers No. 10, Ft. Leavenworth, KS: Combat Studies Institute, 1984, p. 67; Denis Winter, Death’s Men: Soldiers of the Great War,New York, Penguin, Viking, 1978, p. 124.

[115] “Bis(2-chloroethyl)thioether, C4H8SCI2,” www.ch.ic.ac.uk/vchemlib/mol/horrible/War/mustard

[116] Anthony Coordesman, The Lessons of Modern War Volume II: The Iran-Iraq War, Boulder, CO; Westview Press, 1990, p. 525, n. 56.

[117] Kenneth R. Timmerman, Death Lobby: How the West Armed Iraq, New York, Houghton Mifflin Company, 1991, pp. 145-146.

Iranian Chemical Casualties In The Iran-Iraq War (7)

[Conflict Iran]

[This post is based on “Iranian Casualties in the Iran-Iraq War: A Reappraisal,” by H. W. Beuttel, originally published in the December 1997 edition of the International TNDM Newsletter.]


Posts in this series:
Iranian Casualties in the Iran-Iraq War: A Reappraisal
Iranian Missing In Action From The Iran-Iraq War
Iranian Prisoners of War From The Iran-Iraq War
The “Missing” Iranian Prisoners of War From The Iran-Iraq War
Iranian Killed In Action And Died Of Wounds In The Iran-Iraq War
Iranian Wounded In Action In The Iran-Iraq War
Iranian Chemical Casualties In The Iran-Iraq War
Iranian Civil Casualties In The Iran-Iraq War
A Summary Estimate Of Iranian Casualties In The Iran-Iraq War


Historical Chemical Casualties

The War of Sacred Defense was the only conflict of the 20th Century other than World War I fought under conditions of general chemical release. The Iranian ground forces were generally ill-prepared for chemical defense, during the course of the war much NBC defense gear was purchased from the U.K., Germany, and Czechoslovakia, but there was never enough and NBC [nuclear, biological, chemical] defense training was insufficient. Many Iranian solders became gas casualties because they did not shave often enough to allow their protective masks to make a tight seal.[88]

Throughout the war Iraq employed chemical weapons against Iranian forces 195 times. After the chemical attack on Halabja in March 1988 killed some 4,000-5,000 civilians and maimed 7,000 others, the IRGC sent a video crew to document the atrocity. The video was used as a training film for Iranian recruits. Instead of instilling hatred for Saddam’s brutality, the film demoralized its viewers and exaggerated the power of Iraqi chemical weapons.[89] Iranian troops later panicked under gas attack conditions at Fao and Majnoon and abandoned their positions. However, this phenomenon was widespread in the First World War.[90] Further, chemical attacks were usually not significantly lethal. This is again in accord with World War I experience. Gas inflicted 70,552 casualties on the American Expeditionary Force in 1917-18. Of these only 1,221 died (2% lethality). The British Army suffered 185,706 gas casualties of which only 5,899 died (3% lethality), Total British battle casualties for World War I were 677,515 KIA and 1,837,613 WIA. Gas accounted for only 7% of all British casualties and only 1% of all KIA. The Russian Anny suffered an amazing 600,000 gas casualties with a lethality rate at times as much as 12%.[91]

The Use Of Gas In The Iran-Iraq War

Iraq may have first used gas in late 1980 near Salamcheh. Iran reported its first chemical casualty in fighting near Hoveyzeh in early 1981. These early attacks seem to have been limited to the riot control agent CS. On 27 October 1982, near Musain, four Iranian soldiers died from toxic chemical exposure, probably mustard gas. In mid-August 1983 Iran suffered 318 casualties from mustard and arsenic agents. On 7, 9, and 13 November 1983, Iraq used mustard in the Panjwin area. Four seriously wounded Iranian soldiers later died in European hospitals.[92] Between May 1981 and March 1984, Iran claimed Iraq had employed chemical weapons on forty-nine different occasions. This had resulted in 1,200 Iranian dead and 5,000 wounded.[93] Mycotoxins may also have been used.[94] On 17 March 1984 Iraqi forces employed gas which caused 400 Iranian casualties, 40 of which were from nerve agents.[95] In the Badr operation (1-18 March 1985) Iraq used chemical weapons five times, but inflicted only 200 Iranian casualties, none apparently fatal.[96] In one unnamed 1985 attack, Iran claimed 11,000 troops were exposed to Iraqi chemical agents.[97] In Wal Fajir-9 (15 February-11 March 1986) Iran claimed 1,800 chemical casualties from a total of about 30,000.[98] Up to 8,500 Iranian soldier were gas casualties by the end of Wal Fajir-8 and Wal Fajir-9 (15 February-19 May 1986) with about 700 killed or seriously wounded.[99] In attacks on 27 and 30 January, 9, 10, 12, and 13 February 1986, 8,500 Iranian gas casualties were reportedly suffered, of which 35 died and 2,500 had to be hospitalized.[100] In Karbala-4 (24-26 December 1986) only five Iranian troops died from toxic gas out of 10,000 battle casualties.[101] By early 1987, chemical weapons had inflicted at least 10,000 Iranian casualties.[102] In all Iran had suffered 25,600 gas casualties by April 1988, of which 260 (sic 2,600?) died. Iraq’s extensive use of chemical agents in the final months before the August 1988 cease-fire may have raised the casualty count to as much as 45,000.[103] In the Iraqi “In God We Trust” offensive of June 1988 against Majnoon, Iran claimed sixty soldiers killed and 4,000 wounded by Iraqi chemical weapons, which included nerve and blood agents.[104] A small U.K. article on mustard gas from the Internet cites 5,000 Iranian troops killed by gas and 40,000-50,000 injured during the war.[105] The overall cumulative wartime pattern of Iranian military chemical casualties is illustrated in the below figure.

The Lethality Of Gas

Speaking in 1996, Abdollah Mazandarani, Secretary General of the Iranian Foundation for Chemical Warfare Victims, claimed 25,000 Iranian soldiers were “martyred” (killed?) by Iraqi use of chemical weapons in operations Wal Fajir-8, Karbala-8, Badr, Fao, and Majnoon. 45,000 civilians were also affected by chemical weapons.[106] Iran claims at least 100,000 wounded by chemical weapons during the imposed war with Iraq. 1,500 of these casualties require constant medical attention to this day. Since 1991, 118 have died as a result of their toxic chemical exposure according to Hamid Sohralr-Pur, head of the Foundation of the Oppressed and Disabled’s Center for Victims of Chemical Warfare.[107] One of these was Reza Alishahi, who died in September 1994 after suffering 70% disability when he was gassed during the Wal Fajir offensives of 1987.[108] Another pathetic story is that of Magid Azam, now a 27-year-old medical student, who was a 16-year-old Baseej fighter gassed with mustard in the Karbala-5 offensive of January 1987 with no apparent permanent effects. In 1995 his health suddenly began to deteriorate so rapidly he required intensive care. His lungs are now so damaged that only a transplant can save his life. He is one of 30,000 Iranian veterans who have received treatment for recurring or delayed reactions to chemical weapons. It is estimated that up to 100,000 Iranian soldiers were exposed to toxic agents during the war.[109]

In the First World War toxic chemical agents accounted for only 4-5% of total casualties. Of 1,296,853 known chemical casualties in that conflict, 90,080 died (7%), 143,613 were badly wounded (11%) and the remaining 1,053,160 (82%) not seriously affected.[110] 25,000 Iranian military dead out of 45,000 chemical casualties gives an incredible chemical lethality rate of 56%, higher than that for land mines. This claim of 25,000 Iranian troops “martyred” is not an exaggeration, but rather a probable misprint.[111] Elimination of an extraneous zero makes the number 2,500, in line with previously released figures. This would give a chemical lethality rate of 6% per chemical casualty, remarkably close to the World War I general rate, although somewhat higher than individual U.S. or British experience. Further, 45,000-55,000 military chemical casualties out of 1,133,000 total combat casualties yields a 4% casualty total for chemical weapons, again in line with overall World War I experience. 2,500 dead from chemical weapons is only 1% of total Iranian KIA. If 5,000 cited above is correct, about 3%. A representative sample of 400 chemical warfare casualties treated at the Labbati-Nejad Medical Center in Tehran in early 1986 yielded 11 deaths (3%) and 64 (16%) very seriously injured.[112]

Mr. Beuttel, a former U.S. Army intelligence officer, was employed as a military analyst by Boeing Research & Development at the time of original publication. The views and opinions expressed in this article do not necessarily reflect those of The Boeing Company.

NOTES

[88] Anthony Cordesman, The Lessons of Modern War Volume II: The Iran-Iraq War, Boulder CO: Westview Press, 1990, pp. 516.

[89] Kenneth R. Timmerman, Death Lobby: How the West Armed Iraq, New York: Houghton Mifflin Company, 1991, pp. 293-94.

[90] G. M. Hammerman et al., Impact of the Introduction of Lethal Gas on the Combat Performance of Defending Troops, Fairfax VA: Data Memory Systems Inc., 1985, Contract No. DNA 001-84-C-0241.

[91] Charles E. Heller, Chemical Warfare in World War I: The American Experience 1917-1918, Leavenworth Papers No. 10, Ft Leavenwoth, KS: Combat Studies Institute, 1984, pp. 33, 91-92. This represented some 32% of all hospitalized AEF casualties in World War I. Only about 200 were killed in action outright by gas. U.S. troops were ill prepared, poorly equipped and inadequately trained to fight on the European chemical battlefield. See Denis Winter, Death’s Men: Soldiers of the Great War, London: Penguin Books, 1978, p.125.

[92] Cordesman, The Lessons of Modem War Volume II, pp. 188, n. 23, 513-518.

[93] Edgar O’Ballance, The Gulf War, London: Brassey’s, 1988, p. 149; Peter Dunn, “The Chemical War: Journey to Iran,” NBC Defense and Technology International, April 1986, pp. 28-37.

[94] U.S. Chemical and Biological Warfare Related Dual Use Exports to Iraq and Their Possible Impact on Health Consequences of the Gulf War. (The “Riegle Report”) citing H Kadivar and S.C. Adams, “Treatment of Chemical and Biological Warfare Injuries: Insights Derived from the 1984 Attack on Majnoon Island,” Military Medicine, April 1991, pp. 171-177.

[95] Dunn, “The Chemical War: Journey to Iran,” pp. 28-37.

[96] O’Ballance, The Gulf War, p. 164.

[97] “Iranians Still Suffering from Saddam‘s Use of Mustard Gas in War,” Buffalo News, 23 November 1997.

[98] O’Ballance, The Gulf War, p. 179.

[99] Cordesman, The Lessons of Modem War Volume II, pp. 224; Peter Dunn, “The Chemical War: Iran Revisited – 1986,” NBC Defense and Technology International, June 1986, pp. 32-37.

[100] “Iran Keeps Chemical ‘Options’ Open; Claims to Have Upper I-land,” NBC Defense and Technology International, April 1986, pp. 12-13.

[101] O’Ballance, The Gulf War, p. 193.

[102] Cordesman, The Lessons of Modem War Volume II, p. 264, n. 39.

[103] ibid, pp. 516-517.

[104] ibid, p. 389.

[105] “Bis(2-chloroethyl)thioether, C4H8SCI2,” www.ch.ic.ac.uk/vchemlib/mol/horrible/War/mustard

[106] “Official Says Germany, U.S. and Britain were Main Suppliers of Chemicals to Iraq,” IRNA, 1 December 1996.

[107] “I18 Iranian Chemically Wounded War Veterans Martyred Since 1991,” IRNA, 17 April 1997.

[108] “Latest Victim of Iraqi Chemical Warfare Against Iran Dies,” IRNA, 27 September 1994.

[109] “Iranians Still Suffering from Saddam’s Use of Mustard Gas in War,” Buffalo News, 23 November 1997.

[110] Ian V. Hogg, Gas, New York: Ballantine Books, 1975, p.136.

[111] This report was taken from the intemet where sometimes an extraneous number appears in figures. Such was the case when another report stated that 9974 Iraqi PoWs had been released in 1996, when the true figure was 974.

[112] Dunn, “The Chemical War: Iran Revisited – 1986,” pp. 32-39.

Iranian Wounded In Action In The Iran-Iraq War (6)

[Conflict Iran]

[This post is based on “Iranian Casualties in the Iran-Iraq War: A Reappraisal,” by H. W. Beuttel, originally published in the December 1997 edition of the International TNDM Newsletter.]


Posts in this series:
Iranian Casualties in the Iran-Iraq War: A Reappraisal
Iranian Missing In Action From The Iran-Iraq War
Iranian Prisoners of War From The Iran-Iraq War
The “Missing” Iranian Prisoners of War From The Iran-Iraq War
Iranian Killed In Action And Died Of Wounds In The Iran-Iraq War
Iranian Wounded In Action In The Iran-Iraq War
Iranian Chemical Casualties In The Iran-Iraq War
Iranian Civil Casualties In The Iran-Iraq War
A Summary Estimate Of Iranian Casualties In The Iran-Iraq War


No official Iranian figures of overall wounded have been released to this author’s knowledge. Major General Rezai in the interview cited above mentioned some 200,000 permanently disabled. For reasons given above, this probably represents all components, not just Pasdaran forces. Given the standard 4:1 wounded-to-killed ratio, Iranian wounded must have been about 752,000. This gives a total battle casualty sum of right at 940,000. A problem is we have no data on Died of Wounds (DoW) as a category. Also the war was one of general chemical release which biases figures somewhat as the experience of World War I shows.

If the official Iranian figures are only rigorous KIA (death within one hour and counting 72,754 MIAs as KIAs) then using a “World War I w/gas” planning factor the ratio of wounded-to-killed would be 5.96 indicating about 1,120,480 “wounded.” This is probably high as the blanket Iranian casualty figures for deaths probably include both KIA and DoW.

If we consider the Iranian figures to indicate both KIA and DOW the “World War I w/gas” ratio of surviving wounded to KIA and DOW of 4.1 yields 770,800 “surviving wounded.”

The average of these latter two figures is on the order of 945,440 wounded. This produces a ratio of 5:1. It seems reasonable that this average is closest to the truth.

Another clue to total Iranian wounded comes from the statistics of the Khuzistan Blood Transfusion Center. During the war the center provided 736,284 units of blood and blood products for both combatants and civilian patients in the province. The center itself produced 501,639 of the units.[83] In World War II, 10-12% of wounded were transfused with an average usage of 4.3 units of blood per patient.[84] It is likely the center used the majority of its blood products for combatants. If the 501,639 units it produced itself was so used with the remainder procured for the civilian population, applying World War II standards the total number of wounded transfused would be: 501,639/4.3 = 116,660. This in tum might represent 12% of total wounded. Back calculating gives 116,660/12 * 100 = 972,168. This is very close to the above estimate of 945,000 surviving wounded. It, however, may be high as it would probably include a substantial number who received transfusion, but died of wounds.

One last observation—the Iranians tried to make extensive use of Medevac [medical evacuation] helicopters during the war similar to U.S. Army practice in Viet Nam. In the latter conflict the ratio of KIA and DoW to surviving wounded was 4.16, very close to the “World War I w/gas” planning factor of 4.1.[85] However, the Medevac solution was not completely feasible as it did not suit Iranian climatic and geographic situations. As a result the Iranians built a series of underground clinics immediately behind the front lines which offered the best and most expeditious medical service to their wounded according to Brigadier General Abolqasem Musavi, chancellor of the Iranian Army Medical University. This system allowed speedy evacuation and treatment of wounded even in mass casualty situations.[86]

Given that the Iranian Army suffered on the order of 1,133,000 casualties in the War of Sacred Defense what else does this tell us about the conflict?

First, the average annual “theater” battle casualties would be approximately 28% or 141,000 battle casualties per year (given that the Iranians had about 500,000 troops committed at any one time). This rate is only little over half that of World War I although about 50% higher than that of World War II. As far as U.S. wars are concerned it most resembles that of the U.S. Civil War (24.6%).

The distribution of casualties is also in accordance with modern experience since 1945. The dead (188,000) represent about 17%, severely wounded (200,000) about 18%, and other wounded (745,000) about 65%. This matches closely with T. N. Dupuy’s historically derived distribution of modern war casualties of 20% KIA, 15% severely wounded and 65% other wounded.[87]

Mr Beuttel, a former U.S. Army intelligence officer, was employed as a military analyst by Boeing Research & Development at the time of original publication. The views and opinions expressed in this article do not necessarily reflect those of The Boeing Company.

NOTES

[83] “Kuzistan’s Blood Transfusion Center’s Effectiveness Role in Hygiene and War,” abstract contained in “Abstracts Obtained from Iran on Medical Research Conducted After the 1980-1988 Iran-Iraq War,” www.chronicillnet.org/PGWS/tuite/IRMED/IRANTOC.html.[Dead link, August 2018]

[84] John Ellis, The Sharp End: The Fighting Man in World War II, New York: Charles Scribner’s Sons, 1980, p.169.

[85] Trevor N. Dupuy, Attrition: Forecasting Battle Casualties and Equipment Losses in Modern War, Fairfax, VA: HERO Books, 1990, pp. 48-50.

[86] “Army Medical Department Acquired Expertise,” Iran News, 16 October 1997.

[87] Dupuy, Attrition, pp. 165-167.

Iranian Killed In Action and Died of Wounds In The Iran-Iraq War (5)

[Conflict Iran]

[This post is based on “Iranian Casualties in the Iran-Iraq War: A Reappraisal,” by H. W. Beuttel, originally published in the December 1997 edition of the International TNDM Newsletter.]


Posts in this series:
Iranian Casualties in the Iran-Iraq War: A Reappraisal
Iranian Missing In Action From The Iran-Iraq War
Iranian Prisoners of War From The Iran-Iraq War
The “Missing” Iranian Prisoners of War From The Iran-Iraq War
Iranian Killed And Died Of Wounds In The Iran-Iraq War
Iranian Wounded In Action In The Iran-Iraq War
Iranian Chemical Casualties In The Iran-Iraq War
Iranian Civil Casualties In The Iran-Iraq War
A Summary Estimate Of Iranian Casualties In The Iran-Iraq War


Killed and Died of Wounds

As early as 1984—only half way through the war—estimates of Iranian casualties were wildly exaggerated as equally as wildly divergent. Figure 2 illustrates this so-called “Thermometer of Death” widely believed in the West.

Of 72,753 currently estimated MIAs, virtually all are probably KIA. When this is added to the official KIA count of 123,230 we arrive at a total of 195,983 fallen.

Another clue for total KIA total comes from the Behest-e Zahra Military Cemetery in Tehran. In this cemetery rest 36,000 fallen from Tehran Province alone.[77] The Iranian Army was (and is) a territorially based and mobilized entity. Depending on population base, the regions and provinces support various numbers and echelons of operational units. For example, the entire 1st Sarollah Corps is mobilized in Region 10 (Tehran) which has the largest population base. Kerman province, which is far less populous, is home to only the 41st Sarollah Division and the Zulfiqar Brigade.[78] Given this fact we may postulate that total casualties of all provinces are proportional to their populations. If so, the 36,000 KIA from Tehran Province (about 20% of Iran’s total population) represents about 20% of total KIA. This leads us to the calculation Total KIA = 36,000 * 5 = 180,000. This proportion is also confirmed by the mass ceremony for 3,000 recovered MIAs in February 1995. Six hundred of these were from Tehran Province, 20% of the total count in this instance.[79] Again, when 1,200 martyrs were buried nationwide in October 1997, 112 (or 17%) were from Tehran Province.

If we do a simple average of the two figures we arrive at somewhere in the vicinity of 188,000 KIA. The minimum is too low as all MIAs are not yet accounted for. I use the average rather than the maximum as I feel that probably several thousand of the missing were defectors or collaborators who joined the ranks of the Iraqi sponsored National Liberation Army of Iran. Iran recruited at least 10,000 Iraqi PoWs into their “Badr” Army of Iraqi expatriates to fight against Saddam Hussein.

The Moshen Rezui Excursion

In September of 1997, outgoing commander of the Pasdaran, Major General Moshen Rezai, cited some compelling statistics on Iranian casualties in the War of Sacred Defense. Speaking of the IRGC, he claimed some 2,000,000 Pasdaran served in combat over the course of the war. Of these 150,000 were martyred, 200,000 permanently disabled.[80] Taken at face value, these figures suggest KIA totals far higher than released in 1988. The Pasdaran are cited as taking some 90% more KIA than disclosed at war’s end. If the proportion is the same for the regular army, then it must have suffered some 66,000 KIA, and paramilitary deaths were on the order of 16,000. The total KIA would stand at 232,000. Another question is whether Rezai counted the MIAs, and if so how many were Pasdaran (and Baseej)? If he did and the proportion is constant (69%) then some 23,000 of 33,000 cases recovered or settled were Pasdaran (or Baseej). This in turn boosts the count by at least 11,000 (counting regular army and paramilitary recovered M1As) to about 243,000. As there are at least 39,000 still missing (and presumed dead) the final tally would be on the order of 282,000 military and paramilitary dead.

On the other hand Major General Rezai may have been speaking somewhat loosely to exaggerate his component’s contribution. He has been known to exaggerate before. The number of 150,000 KIA matches the sum of the announced dead (123,220) at war’s end plus officially announced recovered MIA bodies—27,000 as of June 1997—(remember: 6,000 MIAs have been simply declared dead at family request). 123,220 + 27,000 = 150,220. The remaining estimated 39,000 residual MIAs would bring the total count of military combat dead to 189,000, in line with above estimates.

Possible Clues to Non-Battle Deaths

Another piece of indirect evidence comes from the vast quantities of Iranian equipment captured by Iraqi forces between March and July 1988. These losses included 1,298 tanks, 155 infantry fighting vehicles, 512 armored personnel carriers, 365 pieces of artillery, 300 anti-aircraft guns, 6,196 mortars, 5,550 recoilless rifles, 8,050 RPG-7s, 60,164 assault rifles, 322 pistols, 501 engineer vehicles, 6,156 radios, 2,054 trucks and light vehicles, 16,863 items of NBC defense equipment and 24,257 caskets.[81] It is the caskets which are of interest.

These were obviously intended for Iranian dead. For an army that popular imagination saw as taking 10,000 dead in a single battle this was a paltry number, In early 1988 Iran had 600,000 troops on the battle front. 24,000 represent only 4% of this number. Interestingly, if this author’s calculation of Iranian KIA at circa 188,000 is correct, annual average war deaths would be roughly 188,000/8 or 23,500, almost the exact number of caskets. However, the Iranians did not know they were actually taking this many dead. They listed only 123,220 KIA at war’s end, not realizing how many “missing” (PoW/MIA) they really had and that over half of these were, in fact, dead. Expected annual war dead under their original figures would have been 123,000/8 = 15,000. This figure is 40% less than the casket cache total, but probably represented an Iranian planning factor for annual graves registration requirements at the front, but with a 60% hedge?

Sixty percent seems somewhat excessive. 10-25% is a more normal “fudge” factor. It may, however, provide a clue to the rate of Iranian non-battle deaths which would require caskets too. In the latter case this would indicate a non-battle-to- (then known) battle deaths ratio of roughly .6. This would represent something like 74,000 non-battle deaths (accident, disease, etc). Ground truth ratio (with now known MIA dead) would be .39. This is almost identical to U.S. experience in World War II (.36) and does not approach the World War I experience (1.43).[82]

Mr Beuttel, a former U.S. Army intelligence officer, was employed as a military analyst by Boeing Research & Development at the time of original publication. The views and opinions expressed in this article do not necessarily reflect those of The Boeing Company.

NOTES

[77] “36,000 Martyr Commemoration Ceremony Wound Up,” Iran News, 10 May 1997.

[78] Kenneth Katzman, The Warriors of Islam: Iran’s Revolutionary Guard, Boulder, CO: Westview Press, 1994, pp. 86-89.

[79] “Leader, President Attend Funeral of 3,000 Martyrs in Tehran,” IRNA, 19 February 1995.

[80] “Rezai Speaks Out About His New Appointment, IRGC,” Iran News, 13 September 1997.

[81] Anthony H. Cordesman, After the Storm: The Changing Military Balance in the Middle East, Boulder, CO: Westview Press, 1993, p. 404.

[82] Trevor N. Dupuy, Attrition: Forecasting Battle Casualties and Equipment Losses in Modern War, Fairfax, VA: HERO Books, 1990, p. 51.

The “Missing” Iranian Prisoners Of War From The Iran-Iraq War (4)

Helmets from dead Iranian soldiers. [Conflict Iran]

[This post is based on “Iranian Casualties in the Iran-Iraq War: A Reappraisal,” by H. W. Beuttel, originally published in the December 1997 edition of the International TNDM Newsletter.]


Posts in this series:
Iranian Casualties in the Iran-Iraq War: A Reappraisal
Iranian Missing In Action From The Iran-Iraq War
Iranian Prisoners of War From The Iran-Iraq War
The “Missing” Iranian Prisoners of War From The Iran-Iraq War
Iranian Killed And Died Of Wounds In The Iran-Iraq War
Iranian Wounded In Action In The Iran-Iraq War
Iranian Chemical Casualties In The Iran-Iraq War
Iranian Civil Casualties In The Iran-Iraq War
A Summary Estimate Of Iranian Casualties In The Iran-Iraq War


It is the opinion of this author that, aside from the 400 expatriates Iraq admitted, that the “5,000” Iranian PoW and “20,000 PoW/MIA” still unaccounted for [as of December 1997] will be shown to be KIA (dead on the battlefield or died in captivity) as recovery operations proceed (20 more were delivered to Iran in June 1997 and another 15 in August). The alternate possibility is that some or most of these personnel now serve in the NLA or other Iraqi supported resistance groups and their identities and existence are concealed for this reason. There is no real evidence that such a large number of living Iranian PoWs are still being held by Iraq. Another chilling possibility recently raised is that some Iranian POWs may have disappeared into the Iraqi biological weapons programs as human guinea pigs.”[73]

[Authors note: As this article went to press I uncovered a small piece of information from 1988. In reference to some of the Iranian MIAs being defectors to the Iraqi-sponsored NLA, the Iranians estimated that as many as 3,000 of their troops may have defected while PoWs in Iraq. They have never mentioned this since. Also 136 Iranian soldiers were arrested and shot for desertion.]

The continued Iranian insistence on 5,000 possible remaining PoWs may also be related to the 6,000 missing declared dead at family request without recovery of a body. In an interesting turn to usual practice, the families seem to have given up hope before the government has lost interest.

Further complicating the matter, Iran seems to have lost control of its accounting procedures. Originally listing 60,711 “missing” in 1988, this increased to 72,753 estimated MIA by 1995. If we combine the 39,048 released PoWs with 72,753 estimated MIA, Iran actually had some 111,801 PoW/MIA during the war or 84% more than they first thought. If there are 5,000 Iranian PoWs still held by Iraq then the total would be 116,801 or 92% higher than estimated.

The answer to this poor accounting probably lies in the overall organization for combat employed by Iranian forces during the war. In addition to the regular army and Pasdaran, Iran employed a third component called the Baseej. The Baseej al Mostafazim (Mobilization of the Oppressed) was founded as a wartime expedient to augment the IRGC and formally placed under their control in January 1981. Baseej formations comprised 300-man battalions divided into 100-man companies with 22-man platoons armed with light weapons.[74] Their functions were IRGC reinforcement in the war. Baseej units fought extensively in the War of Sacred Defense (1980-88). However, their availability was only episodic as their tour of duty was normally only three months, usually from January to March. At this time most Baseej were rural peasants, often very young (some only 10) or very old and illiterate, who had to return for spring planting and fall harvests. As a result their training was rudimentary, often as little as two weeks of small arms and hand grenade practice. It was the Baseej who were given plastic keys to hang around their necks with the promise these would unlock the gates of paradise if they were killed in action.[75] As many as two million Baseej forces saw combat in the imposed war with Iraq.[76]

When the Iranian government offered its original tally of dead and missing in 1988 the Baseej losses were not mentioned separately and assumed to fall under the category of Pasdaran. It was only after the war when most (if not all) Iranian PoWs had been released and the magnitude of the MIA issue became evident that Iran realized it had suffered far more losses than originally thought. It is likely the degree of Baseej unit administration and accountability was far below regular army or established Pasdaran formations. Given the episodic nature of their participation, widespread personnel illiteracy and their poor level of training (and the fact they were used as temporary human “fill” for Pasdaran formations), it is unlikely that unit returns were maintained in anything like a proper or organized manner.

This author believes that the bulk of the additional true MIAs claimed since the end of the war are represented by primarily Baseej fallen who were simply not originally accounted for in established Pasdaran or regular army unit returns. Baseej units made up to 40% of Iranian force strength during the war. The 73,000 now-claimed missing (and presumed dead) of the war represent 38% of the total known and presumed combat dead (circa 188,000—see below). This is too close to be accidental.

Mr Beuttel, a former U.S. Army intelligence officer, was employed as a military analyst by Boeing Research & Development at the time of original publication. The views and opinions expressed in this article do not necessarily reflect those of The Boeing Company.

NOTES

[73] “The World’s Deadliest Woman?” MSNBC News, November 1997.

[74] Anthony H. Cordesman, The Iran-Iraq War and Western Security 1984-87, London: Jane’s Publishing Ltd, 1987, p. 103.

[75] Kenneth Katzman, The Warriors of Islam: Iran’s Revolutionary Guard, Boulder, CO: Westview Press, 1994, p. 67, 93.

[76] “Plans for 20 Million Strong Army by 2025,” Iran News, 25 September 1997.