On the first page (page 28) in the third column they make the statement that:
Models of complex systems, especially those that incorporate human behavior, such as that demonstrated in combat, do not often lend themselves to empirical validation of output measures, such as attrition.
Really? Why can’t you? If fact, isn’t that exactly the model you should be validating?
More to the point, people have validated attrition models. Let me list a few cases (this list is not exhaustive):
1. Done by Center for Army Analysis (CAA) for the CEM (Concepts Evaluation Model) using Ardennes Campaign Simulation Study (ARCAS) data. Take a look at this study done for Stochastic CEM (STOCEM): https://apps.dtic.mil/dtic/tr/fulltext/u2/a489349.pdf
2. Done in 2005 by The Dupuy Institute for six different casualty estimation methodologies as part of Casualty Estimation Methodologies Studies. This was work done for the Army Medical Department and funded by DUSA (OR). It is listed here as report CE-1: http://www.dupuyinstitute.org/tdipub3.htm
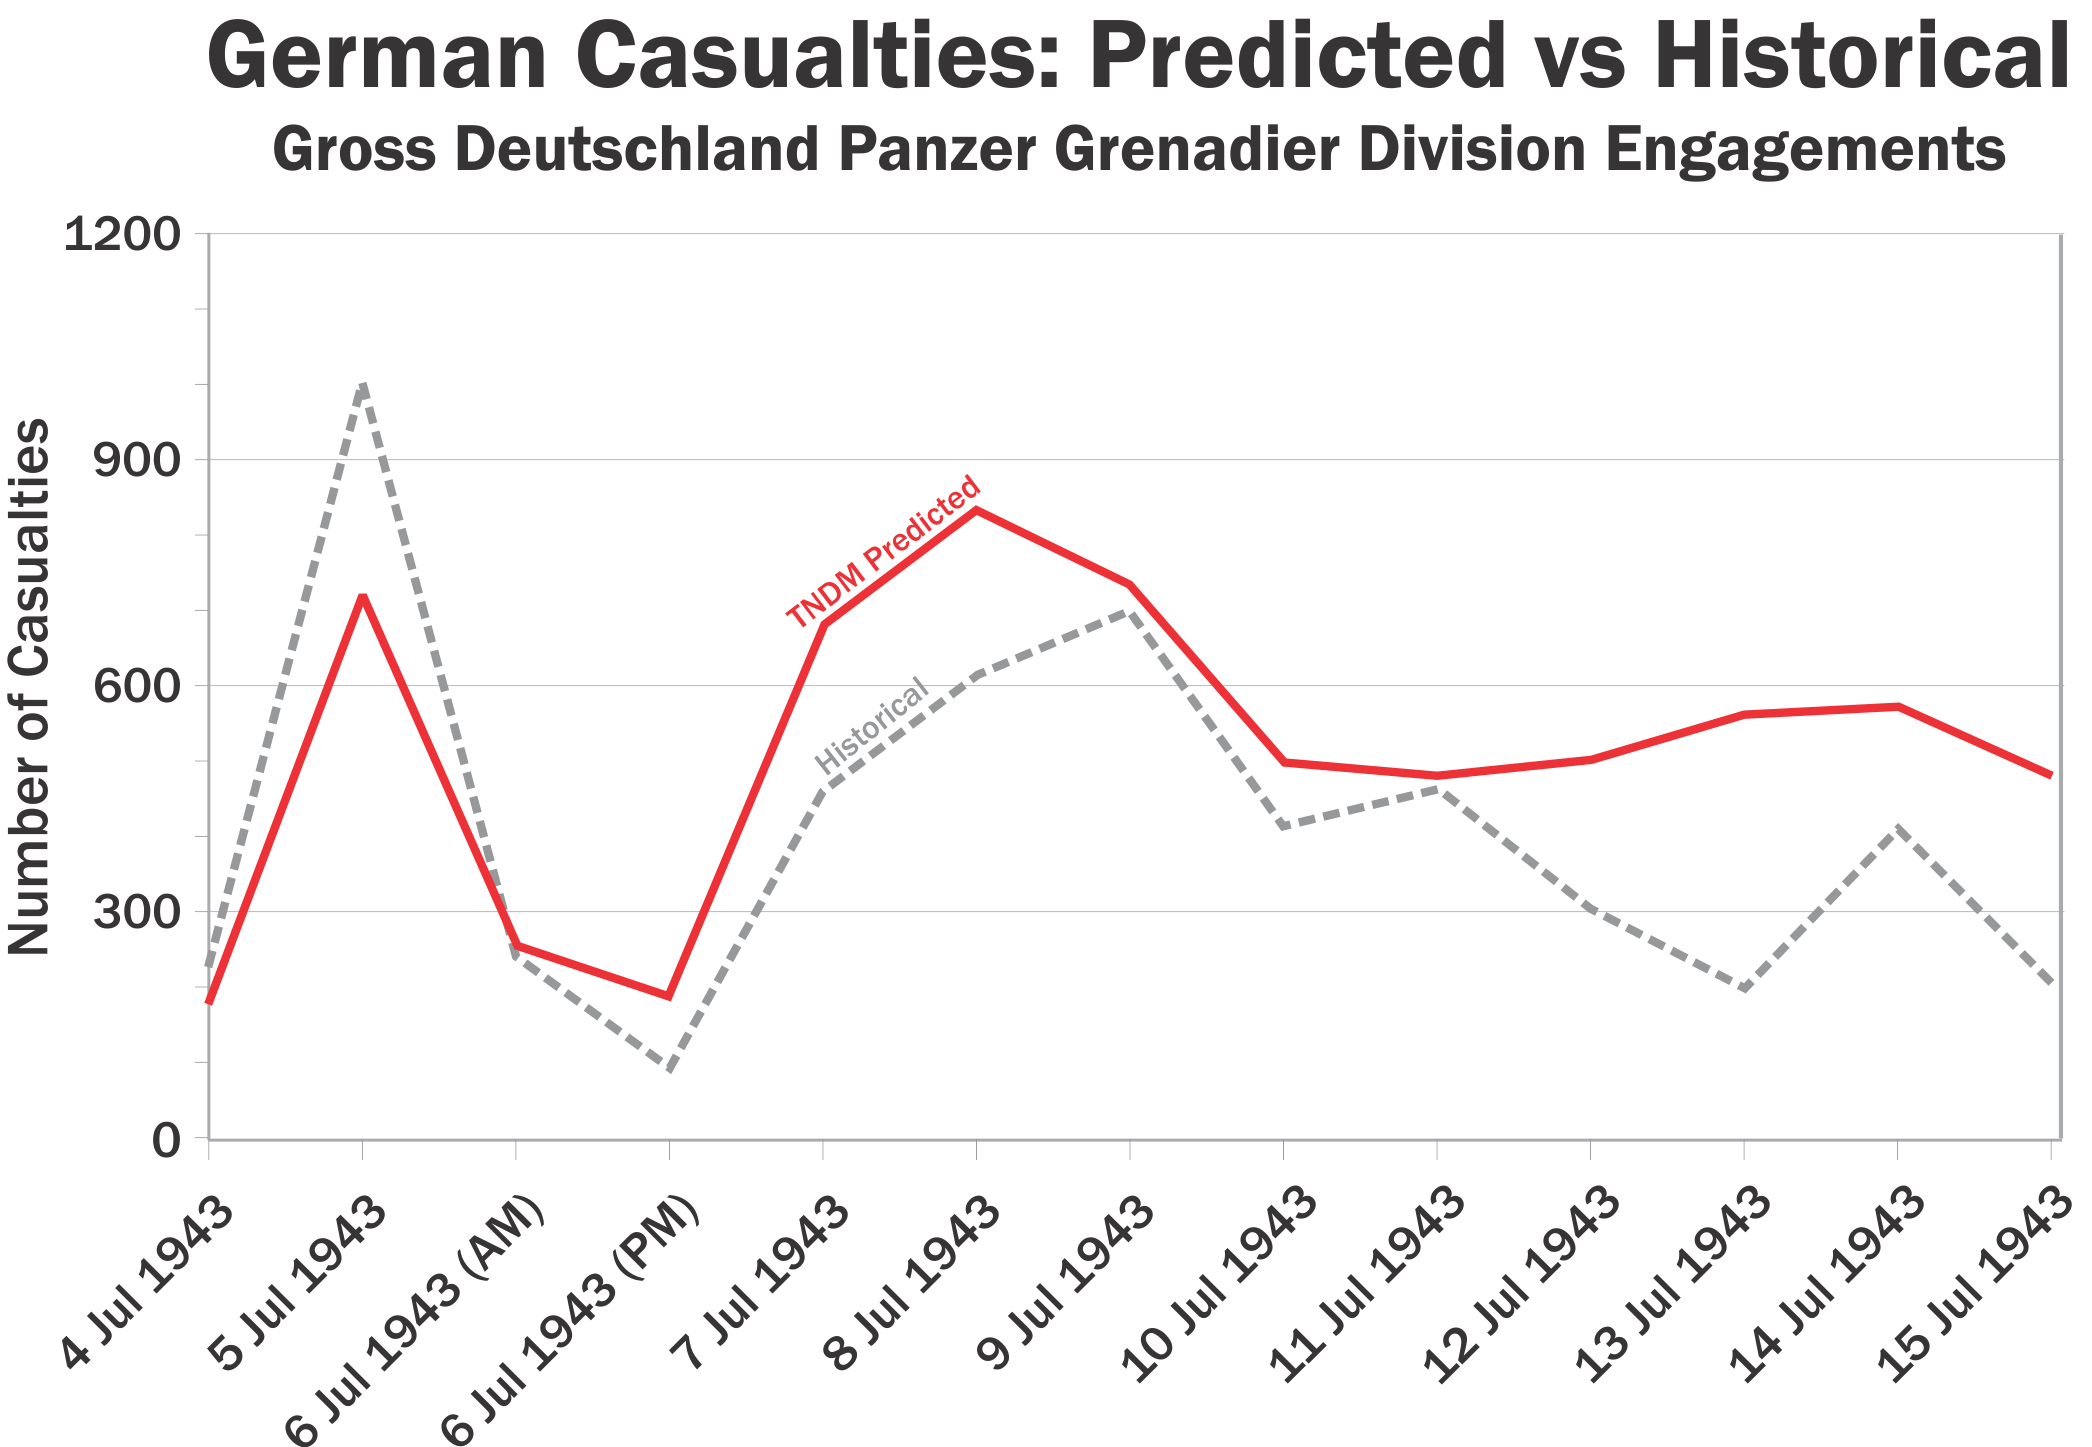
3. Done in 2006 by The Dupuy Institute for the TNDM (Tactical Numerical Deterministic Model) using Corps and Division-level data. This effort was funded by Boeing, not the U.S. government. This is discussed in depth in Chapter 19 of my book War by Numbers (pages 299-324) where we show 20 charts from such an effort. Let me show you one from page 315:
So, this is something that multiple people have done on multiple occasions. It is not so difficult that The Dupuy Institute was not able to do it. TRADOC is an organization with around 38,000 military and civilian employees, plus who knows how many contractors. I think this is something they could also do if they had the desire.
On the first page (page 28) top of the third column they make the rather declarative statement that:
The combat simulations used by military operations research and analysis agencies adhere to strict standards established by the DoD regarding verification, validation and accreditation (Department of Defense, 2009).
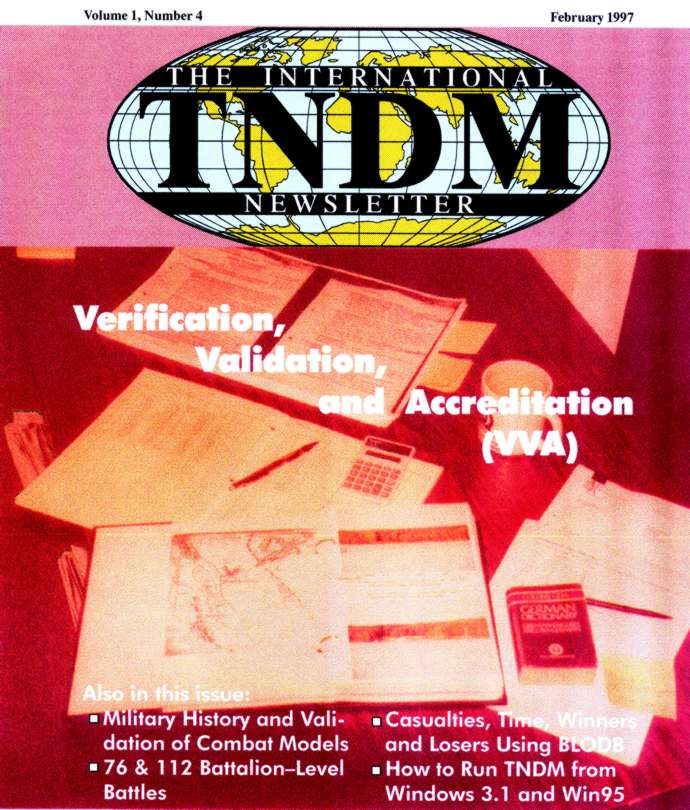
Now, I have not reviewed what has been done on verification, validation and accreditation since 2009, but I did do a few fairly exhaustive reviews before then. One such review is written up in depth in The International TNDM Newsletter. It is Volume 1, No. 4 (February 1997). You can find it here:
The newsletter includes a letter dated 21 January 1997 from the Scientific Advisor to the CG (Commanding General) at TRADOC (Training and Doctrine Command). This is the same organization that the three gentlemen who wrote the article in the Phalanx work for. The Scientific Advisor sent a letter out to multiple commands to try to flag the issue of validation (letter is on page 6 of the newsletter). My understanding is that he received few responses (I saw only one, it was from Leavenworth). After that, I gather there was no further action taken. This was a while back, so maybe everything has changed, as I gather they are claiming with that declarative statement. I doubt it.
This issue to me is validation. Verification is often done. Actual validations are a lot rarer. In 1997, this was my list of combat models in the industry that had been validated (the list is on page 7 of the newsletter):
1. Atlas (using 1940 Campaign in the West)
2. Vector (using undocumented turning runs)
3. QJM (by HERO using WWII and Middle-East data)
4. CEM (by CAA using Ardennes Data Base)
5. SIMNET/JANUS (by IDA using 73 Easting data)
Now, in 2005 we did a report on Casualty Estimation Methodologies (it is report CE-1 list here: http://www.dupuyinstitute.org/tdipub3.htm). We reviewed the listing of validation efforts, and from 1997 to 2005…nothing new had been done (except for a battalion-level validation we had done for the TNDM). So am I now to believe that since 2009, they have actively and aggressively pursued validation? Especially as most of this time was in a period of severely declining budgets, I doubt it. One of the arguments against validation made in meetings I attended in 1987 was that they did not have the time or budget to spend on validating. The budget during the Cold War was luxurious by today’s standards.
If there have been meaningful validations done, I would love to see the validation reports. The proof is in the pudding…..send me the validation reports that will resolve all doubts.
The Military Operations Research Society (MORS) publishes a periodical journal called the Phalanx. In the December 2018 issue was an article that referenced one of our blog posts. This took us by surprise. We only found out about thanks to one of the viewers of this blog. We are not members of MORS. The article is paywalled and cannot be easily accessed if you are not a member.
It is titled “Perspectives on Combat Modeling” (page 28) and is written by Jonathan K. Alt, U.S. Army TRADOC Analysis Center, Monterey, CA.; Christopher Morey, PhD, Training and Doctrine Command Analysis Center, Ft. Leavenworth, Kansas; and Larry Larimer, Training and Doctrine Command Analysis Center, White Sands, New Mexico. I am not familiar with any of these three gentlemen.
The blog post that appears to be generating this article is this one:
Simply by coincidence, Shawn Woodford recently re-posted this in January. It was originally published on 10 April 2017 and was written by Shawn.
The opening two sentences of the article in the Phalanx reads:
Periodically, within the Department of Defense (DoD) analytic community, questions will arise regarding the validity of the combat models and simulations used to support analysis. Many attempts (sic) to resurrect the argument that models, simulations, and wargames “are built on the thin foundation of empirical knowledge about the phenomenon of combat.” (Woodford, 2017).
It is nice to be acknowledged, although it this case, it appears that we are being acknowledged because they disagree with what we are saying.
Probably the word that gets my attention is “resurrect.” It is an interesting word, that implies that this is an old argument that has somehow or the other been put to bed. Granted it is an old argument. On the other hand, it has not been put to bed. If a problem has been identified and not corrected, then it is still a problem. Age has nothing to do with it.
On the other hand, maybe they are using the word “resurrect” because recent developments in modeling and validation have changed the environment significantly enough that these arguments no longer apply. If so, I would be interested in what those changes are. The last time I checked, the modeling and simulation industry was using many of the same models they had used for decades. In some cases, were going back to using simpler hex-games for their modeling and wargaming efforts. We have blogged a couple of times about these efforts. So, in the world of modeling, unless there have been earthshaking and universal changes made in the last five years that have completely revamped the landscape….then the decades old problems still apply to the decades old models and simulations.
More to come (this is the first of at least 7 posts on this subject).
The President of Afghanistan, Ashraf Ghani, speaking with CNN’s Farid Zakiria, at the World Economic Forum in Davos, Switzerland, 25 January 2019. [Office of the President, Islamic Republic of Afghanistan]
This revised figure casts significant doubt on the validity of analysis based on the previous reporting. Correcting it will be difficult. At the request of the Afghan government in May 2017, the U.S. military has treated security forces attrition and loss data as classified and has withheld it from public release.
[This piece was originally posted on 27 June 2016.]
Previous posts have detailed casualty estimates by Trevor Dupuy or The Dupuy Institute (TDI) for the 1990-91 Gulf War and the 1995 intervention in Bosnia. Today I will detail TDI’s 2004 forecast for U.S. casualties in the Iraqi insurgency that began in 2003.
In April 2004, as simultaneous Sunni and Shi’a uprisings dramatically expanded the nascent insurgency in Iraq, the U.S. Army Center for Army Analysis (CAA) accepted an unsolicited proposal from TDI President and Executive Director Christopher Lawrence to estimate likely American casualties in the conflict. A four-month contract was finalized in August.
The methodology TDI adopted for the estimate was a comparative case study analysis based on a major data collection effort on insurgencies. 28 cases were selected for analysis based on five criteria:
The conflict had to be post-World War II to facilitate data collection;
It had to have lasted more than a year (as was already the case in Iraq);
It had to be a developed nation intervening in a developing nation;
The intervening nation had to have provided military forces to support or establish an indigenous government; and
There had to be an indigenous guerilla movement (although it could have received outside help).
Extensive data was collected from these 28 cases, including the following ten factors used in the estimate:
Country Area
Orderliness
Population
Intervening force size
Border Length
Insurgency force size
Outside support
Casualty rate
Political concept
Force ratios
Initial analysis compared this data to insurgency outcomes, which revealed some startlingly clear patterns suggesting cause and effect relationships. From this analysis, TDI drew the following conclusions:
It is difficult to control large countries.
It is difficult to control large populations.
It is difficult to control an extended land border.
Limited outside support does not doom an insurgency.
“Disorderly” insurgencies are very intractable and often successful insurgencies.
Insurgencies with large intervening third-party counterinsurgent forces (above 95,000) often succeed.
Higher combat intensities do not doom an insurgency.
In all, TDI assessed that the Iraqi insurgency fell into the worst category in nine of the ten factors analyzed. The outcome would hinge on one fundamental question: was the U.S. facing a regional, factional insurgency in Iraq or a widespread anti-intervention insurgency? Based on the data, if the insurgency was factional or regional, it would fail. If it became a nationalist revolt against a foreign power, it would succeed.
Based on the data and its analytical conclusions, TDI provided CAA with an initial estimate in December 2004, and a final version in January 2005:
Insurgent force strength is probably between 20,000–60,000.
This is a major insurgency.
It is of medium intensity.
It is a regional or factionalized insurgency and must remain that way.
U.S. commitment can be expected to be relatively steady throughout this insurgency and will not be quickly replaced by indigenous forces.
It will last around 10 or so years.
It may cost the U.S. 5,000 to 10,000 killed.
It may be higher.
This assumes no major new problems in the Shiite majority areas.
When TDI made its estimate in December 2004, the conflict had already lasted 21 months, and U.S. casualties were 1,335 killed, 1,038 of them in combat.
When U.S. forces withdrew from Iraq in December 2011, the war had gone on for 105 months (8.7 years), and U.S. casualties had risen to 4,485 fatalities—3,436 in combat. The United Kingdom lost 180 troops killed and Coalition allies lost 139. There were at least 468 contractor deaths from a mix of nationalities. The Iraqi Army and police suffered at least 10,125 deaths. Total counterinsurgent fatalities numbered at least 15,397.
As of this date, the conflict in Iraq that began in 2003 remains ongoing.
A great deal of importance has been placed on the knowledge derived from these activities. As the U.S. Army Training and Doctrine Command recently stated,
Concept analysis informed by joint and multinational learning events…will yield the capabilities required of multi-domain battle. Resulting doctrine, organization, training, materiel, leadership, personnel and facilities solutions will increase the capacity and capability of the future force while incorporating new formations and organizations.
There is, however, a problem afflicting the Defense Department’s wargames, of which the military operations research and models and simulations communities have long been aware, but have been slow to address: their models are built on a thin foundation of empirical knowledge about the phenomenon of combat. None have proven the ability to replicate real-world battle experience. This is known as the “base of sand” problem.
A Brief History of The Base of Sand
All combat models and simulations are abstracted theories of how combat works. Combat modeling in the United States began in the early 1950s as an extension of military operations research that began during World War II. Early model designers did not have large base of empirical combat data from which to derive their models. Although a start had been made during World War II and the Korean War to collect real-world battlefield data from observation and military unit records, an effort that provided useful initial insights, no systematic effort has ever been made to identify and assemble such information. In the absence of extensive empirical combat data, model designers turned instead to concepts of combat drawn from official military doctrine (usually of uncertain provenance), subject matter expertise, historians and theorists, the physical sciences, or their own best guesses.
As the U.S. government’s interest in scientific management methods blossomed in the late 1950s and 1960s, the Defense Department’s support for operations research and use of combat modeling in planning and analysis grew as well. By the early 1970s, it became evident that basic research on combat had not kept pace. A survey of existing combat models by Gary Shubik and Martin Brewer for RAND in 1972 concluded that
Basic research and knowledge is lacking. The majority of the MSGs [models, simulations and games] sampled are living off a very slender intellectual investment in fundamental knowledge…. [T]he need for basic research is so critical that if no other funding were available we would favor a plan to reduce by a significant proportion all current expenditures for MSGs and to use the saving for basic research.
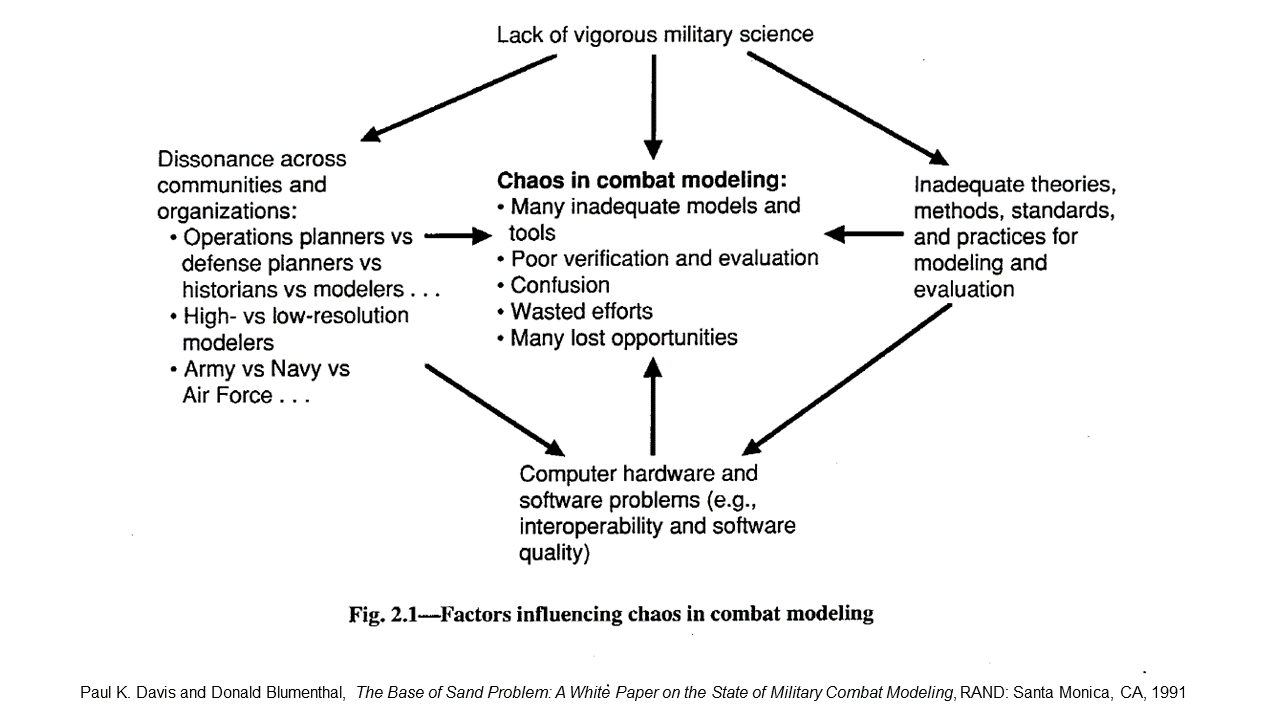
The [Defense Department]is becoming critically dependent on combat models (including simulations and war games)—even more dependent than in the past. There is considerable activity to improve model interoperability and capabilities for distributed war gaming. In contrast to this interest in model-related technology, there has been far too little interest in the substance of the models and the validity of the lessons learned from using them. In our view, the DoD does not appreciate that in many cases the models are built on a base of sand…
[T]he DoD’s approach in developing and using combat models, including simulations and war games, is fatally flawed—so flawed that it cannot be corrected with anything less than structural changes in management and concept. [Original emphasis]
As a remedy, the authors recommended that the Defense Department create an office to stimulate a national military science program. This Office of Military Science would promote and sponsor basic research on war and warfare while still relying on the military services and other agencies for most research and analysis.
Davis and Blumenthal initially drafted their white paper before the 1991 Gulf War, but the performance of the Defense Department’s models and simulations in that conflict underscored the very problems they described. Defense Department wargames during initial planning for the conflict reportedly predicted tens of thousands of U.S. combat casualties. These simulations were said to have led to major changes in U.S. Central Command’s operational plan. When the casualty estimates leaked, they caused great public consternation and inevitable Congressional hearings.
The Defense Department’s current generation of models and simulations harbor the same weaknesses as the ones in use in the 1990s. Some are new iterations of old models with updated graphics and code, but using the same theoretical assumptions about combat. In most cases, no one other than the designers knows exactly what data and concepts the models are based upon. This practice is known in the technology world as black boxing. While black boxing may be an essential business practice in the competitive world of government consulting, it makes independently evaluating the validity of combat models and simulations nearly impossible. This should be of major concern because many models and simulations in use today contain known flaws.
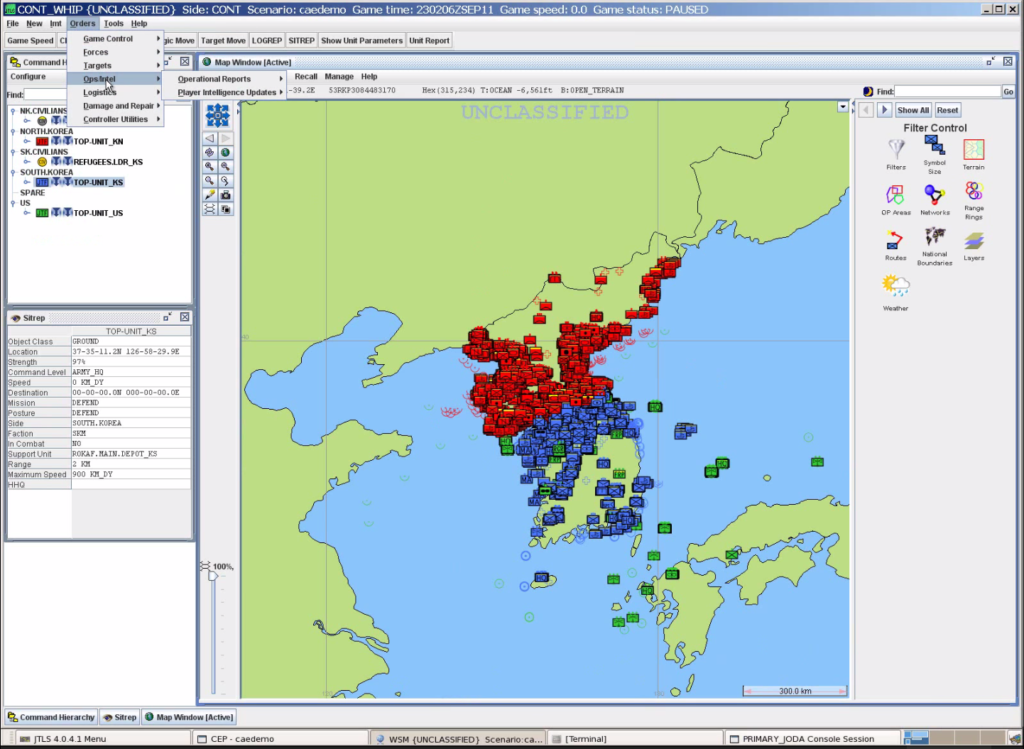
Others, such as the Joint Conflict And Tactical Simulation (JCATS), MAGTF Tactical Warfare System (MTWS), and Warfighters’ Simulation (WARSIM) adjudicate ground combat using probability of hit/probability of kill (pH/pK) algorithms. Corps Battle Simulation (CBS) uses pH/pK for direct fire attrition and a modified version of Lanchester for indirect fire. While these probabilities are developed from real-world weapon system proving ground data, their application in the models is combined with inputs from subjective sources, such as outputs from other combat models, which are likely not based on real-world data. Multiplying an empirically-derived figure by a judgement-based coefficient results in a judgement-based estimate, which might be accurate or it might not. No one really knows.
This state of affairs seems remarkable given the enormous stakes that are being placed on the output of the Defense Department’s modeling and simulation activities. After decades of neglect, remedying this would require a dedicated commitment to sustained basic research on the military science of combat and warfare, with no promise of a tangible short-term return on investment. Yet, as Biddle pointed out, “With so much at stake, we surely must do better.”
[NOTE: The attrition methodologies used in CBS and WARSIM have been corrected since this post was originally published per comments provided by their developers.]
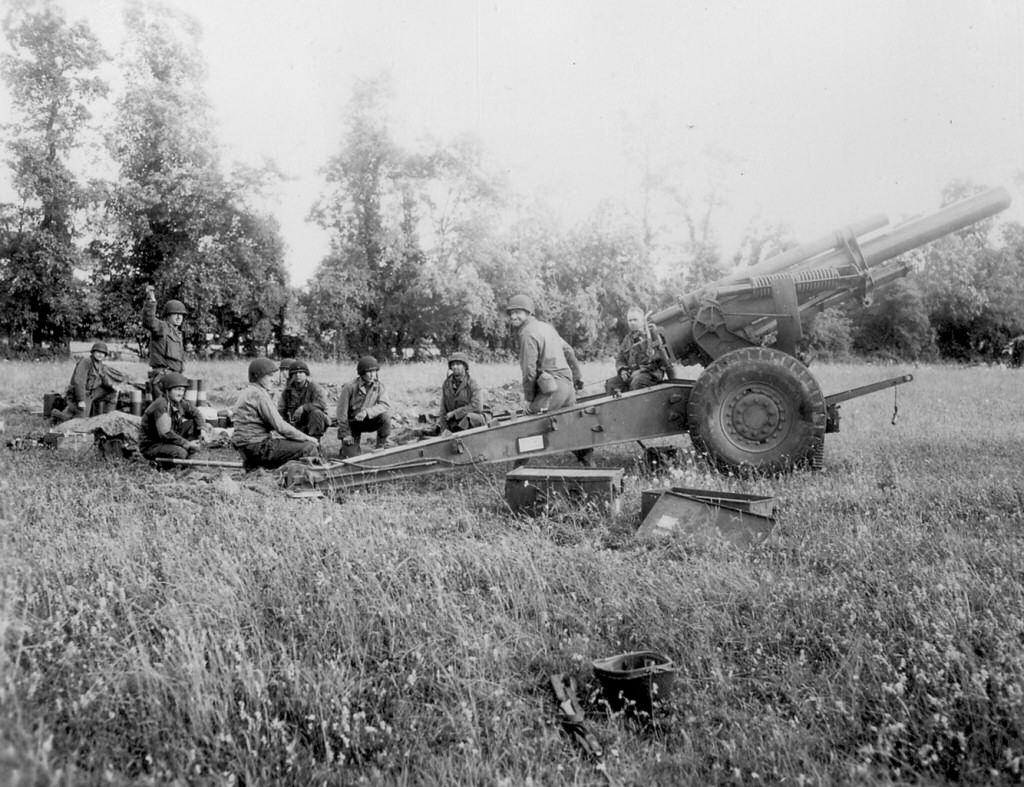
U.S. Army 155mm field howitzer in Normandy. [padresteve.com]
[This series of posts is adapted from the article “Artillery Effectiveness vs. Armor,” by Richard C. Anderson, Jr., originally published in the June 1997 edition of the International TNDM Newsletter.]
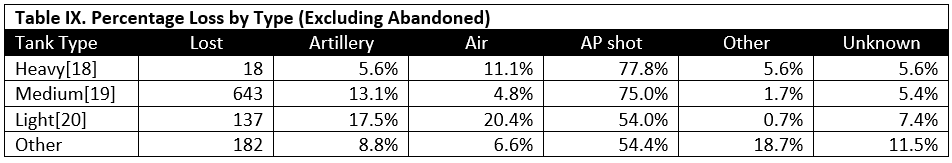
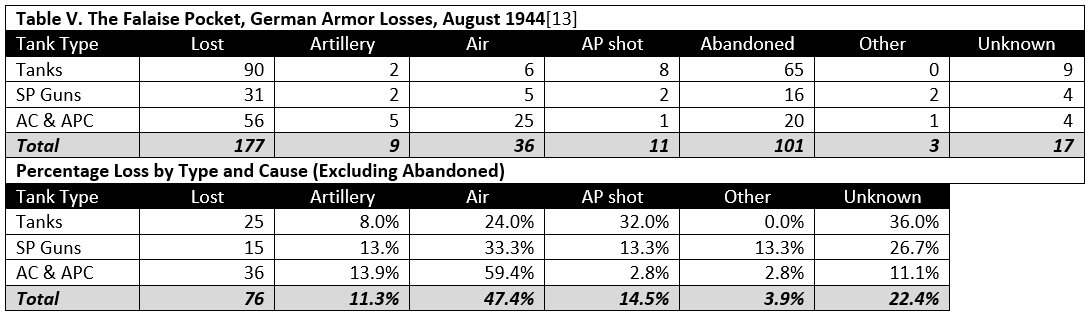
Table IX shows the distribution of cause of loss by type or armor vehicle. From the distribution it might be inferred that better protected armored vehicles may be less vulnerable to artillery attack. Nevertheless, the heavily armored vehicles still suffered a minimum loss of 5.6 percent due to artillery. Unfortunately the sample size for heavy tanks was very small, 18 of 980 cases or only 1.8 percent of the total.
The data are limited at this time to the seven cases.[6] Further research is necessary to expand the data sample so as to permit proper statistical analysis of the effectiveness of artillery versus tanks.
NOTES
[18] Heavy armor includes the KV-1, KV-2, Tiger, and Tiger II.
[19] Medium armor includes the T-34, Grant, Panther, and Panzer IV.
[20] Light armor includes the T-60, T-70. Stuart, armored cars, and armored personnel carriers.
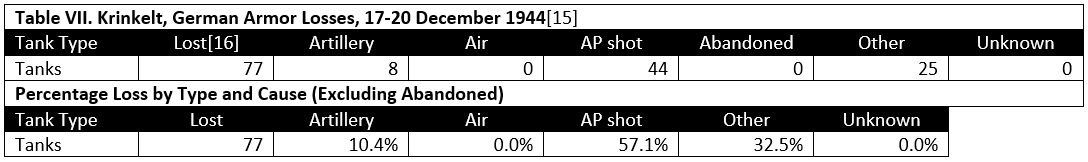
Knocked-out Panthers in Krinkelt, Belgium, Battle of the Bulge, 17 December 1944. [worldwarphotos.info]
[This series of posts is adapted from the article “Artillery Effectiveness vs. Armor,” by Richard C. Anderson, Jr., originally published in the June 1997 edition of the International TNDM Newsletter.]
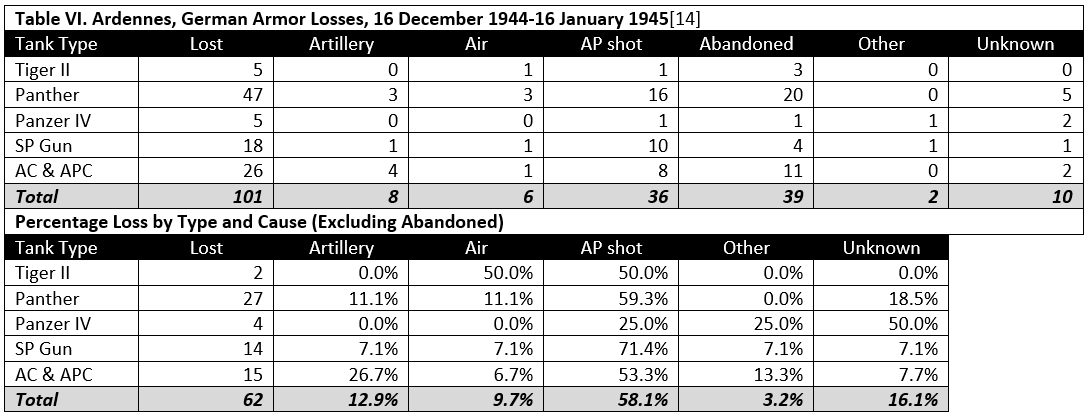
[14] From ORS Joint Report No. 1. A total of an estimated 300 German armor vehicles were found following the battle.
[15] Data from 38th Infantry After Action Report (including “Sketch showing enemy vehicles destroyed by 38th Inf Regt. and attached units 17-20 Dec. 1944″), from 12th SS PzD strength report dated 8 December 1944, and from strengths indicated on the OKW briefing maps for 17 December (1st [circa 0600 hours], 2d [circa 1200 hours], and 3d [circa 1800 hours] situation), 18 December (1st and 2d situation), 19 December (2d situation), 20 December (3d situation), and 21 December (2d and 3d situation).
[16] Losses include confirmed and probable losses.
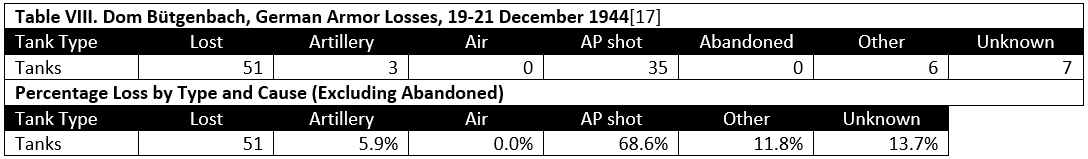
[17] Data from Combat Interview “26th Infantry Regiment at Dom Bütgenbach” and from 12th SS PzD, ibid.
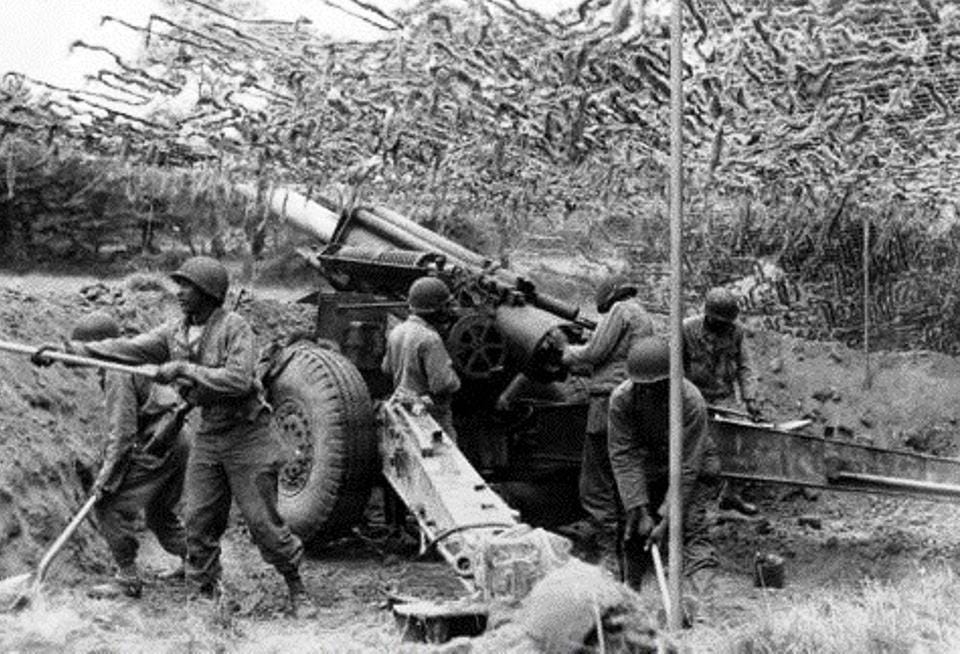
The U.S. Army 333rd Field Artillery Battalion (Colored) in Normandy, July 1944 (US Army Photo/Tom Gregg)
[This series of posts is adapted from the article “Artillery Effectiveness vs. Armor,” by Richard C. Anderson, Jr., originally published in the June 1997 edition of the International TNDM Newsletter.]
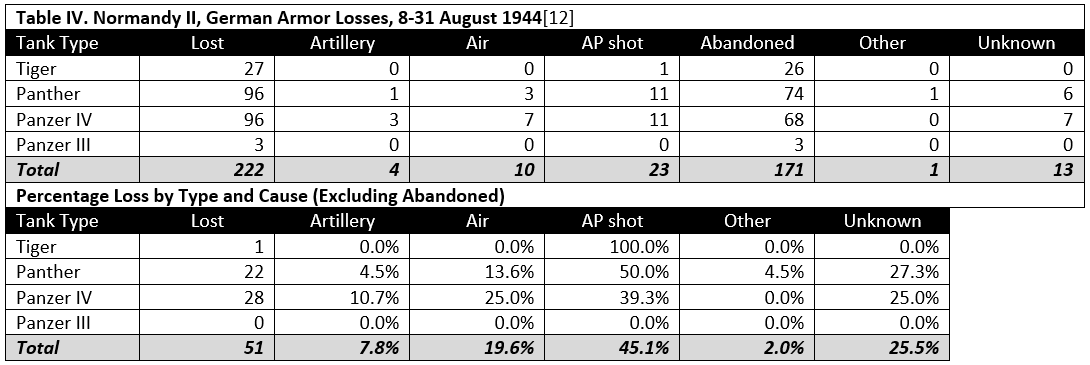
[11] Five of the 13 counted as unknown were penetrated by both armor piercing shot and by infantry hollow charge weapons. There was no evidence to indicate which was the original cause of the loss.
[12] From ORS Report No. 17
[13] From ORS Report No. 15. The “Pocket” was the area west of the line Falaise-Argentan and east of the line Vassy-Gets-Domfront in Normandy that was the site in August 1944 of the beginning of the German retreat from France. The German forces were being enveloped from the north and south by Allied ground forces and were under constant, heavy air attack.
German Army 150mm heavy field howitzer 18 L/29.5 battery. [Panzer DB/Pinterest]
[This series of posts is adapted from the article “Artillery Effectiveness vs. Armor,” by Richard C. Anderson, Jr., originally published in the June 1997 edition of the International TNDM Newsletter.]
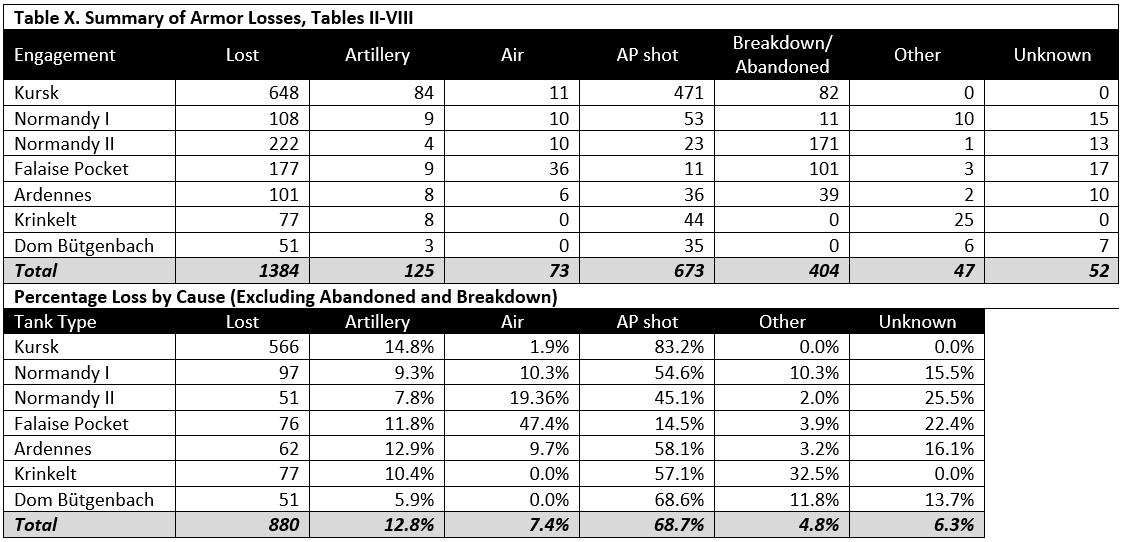
Curiously, at Kursk, in the case where the highest percent loss was recorded, the German forces opposing the Soviet 1st Tank Army—mainly the XLVIII Panzer Corps of the Fourth Panzer Army—were supported by proportionately fewer artillery pieces (approximately 56 guns and rocket launchers per division) than the US 1st Infantry Division at Dom Bütgenbach (the equivalent of approximately 106 guns per division)[4]. Nor does it appear that the German rate of fire at Kursk was significantly higher than that of the American artillery at Dom Bütgenbach. On 20 July at Kursk, the 150mm howitzers of the 11th Panzer Division achieved a peak rate of fire of 87.21 rounds per gum. On 21 December at Dom Bütgenbach, the 155mm howitzers of the 955th Field Artillery Battalion achieved a peak rate of fire of 171.17 rounds per gun.[5]
NOTES
[4] The US artillery at Dom Bütgenbach peaked on 21 December 1944 when a total of 210 divisional and corps pieces fired over 10,000 rounds in support of the 1st Division’s 26th Infantry.
[5] Data collected on German rates of fire are fragmentary, but appear to be similar to that of the American Army in World War ll. An article on artillery rates of fire that explores the data in more detail will be forthcoming in a future issue of this newsletter. [NOTE: This article was not completed or published.]
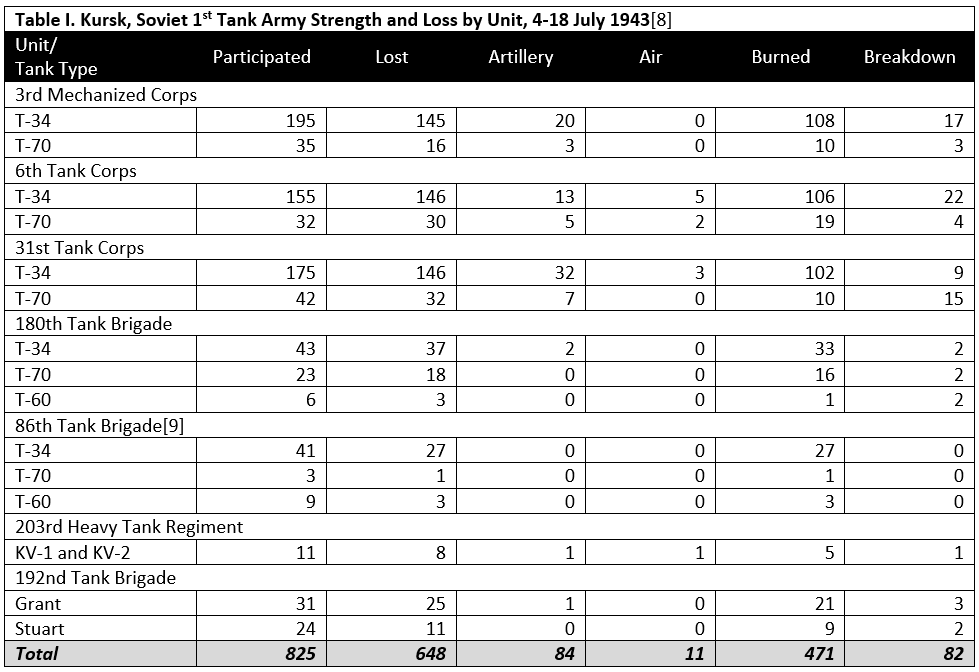
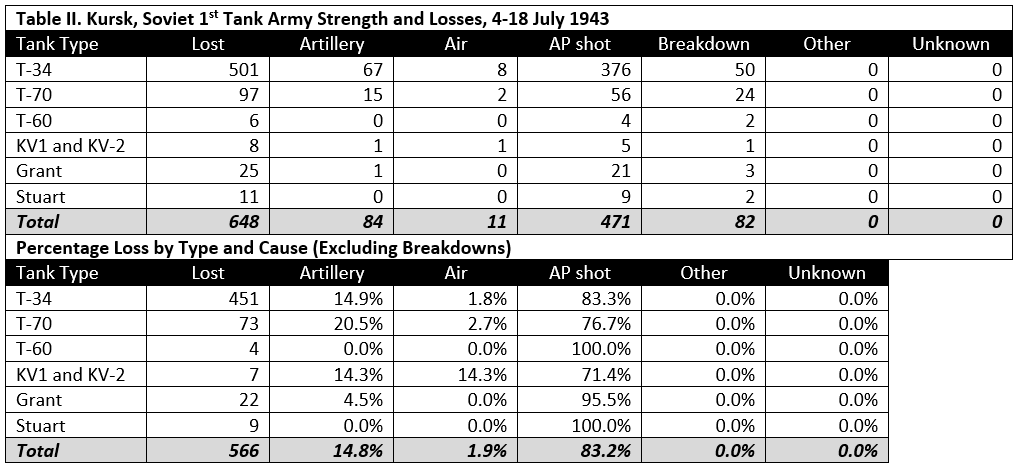
Notes to Table I.
[8] The data were found in reports of the 1st Tank Army (Fond 299, Opis‘ 3070, Delo 226). Obvious math errors in the original document have been corrected (the total lost column did not always agree with the totals by cause). The total participated column evidently reflected the starting strength of the unit, plus replacement vehicles. “Burned'” in Soviet wartime documents usually indicated a total loss, however it appears that in this case “burned” denoted vehicles totally lost due to direct fire antitank weapons. “Breakdown” apparently included both mechanical breakdown and repairable combat damage.
[9] Note that the brigade report (Fond 3304, Opis‘ 1, Delo 24) contradicts the army report. The brigade reported that a total of 28 T-34s were lost (9 to aircraft and 19 to “artillery”) and one T-60 was destroyed by a mine. However, this report was made on 11 July, during the battle, and may not have been as precise as the later report recorded by 1st Tank Army. Furthermore, it is not as clear in the brigade report that “artillery” referred only to indirect fire HE and not simply lo both direct and indirect fire guns.