Mystics & Statistics

A blog on quantitative historical analysis hosted by The Dupuy Institute

Some National Coronavirus Graphs – update 3

I may continue updating this post for a while. This basically addresses the question of when is the virus mitigated, or even better when it is contained, and eventually when should restrictions be relaxed. So we look at South Korea compared to the three worst plagued countries in the world. We then look at three other countries in East Asia that were near China and had to deal with the virus sooner than most. We then look at a few other countries that appear to getting the virus under control. I think there is considerable value here in comparing results across several countries. All these are simple graphs pulled from the Johns Hopkins CSSE website as of 8:31:22 AM: Johns Hopkins CSSE

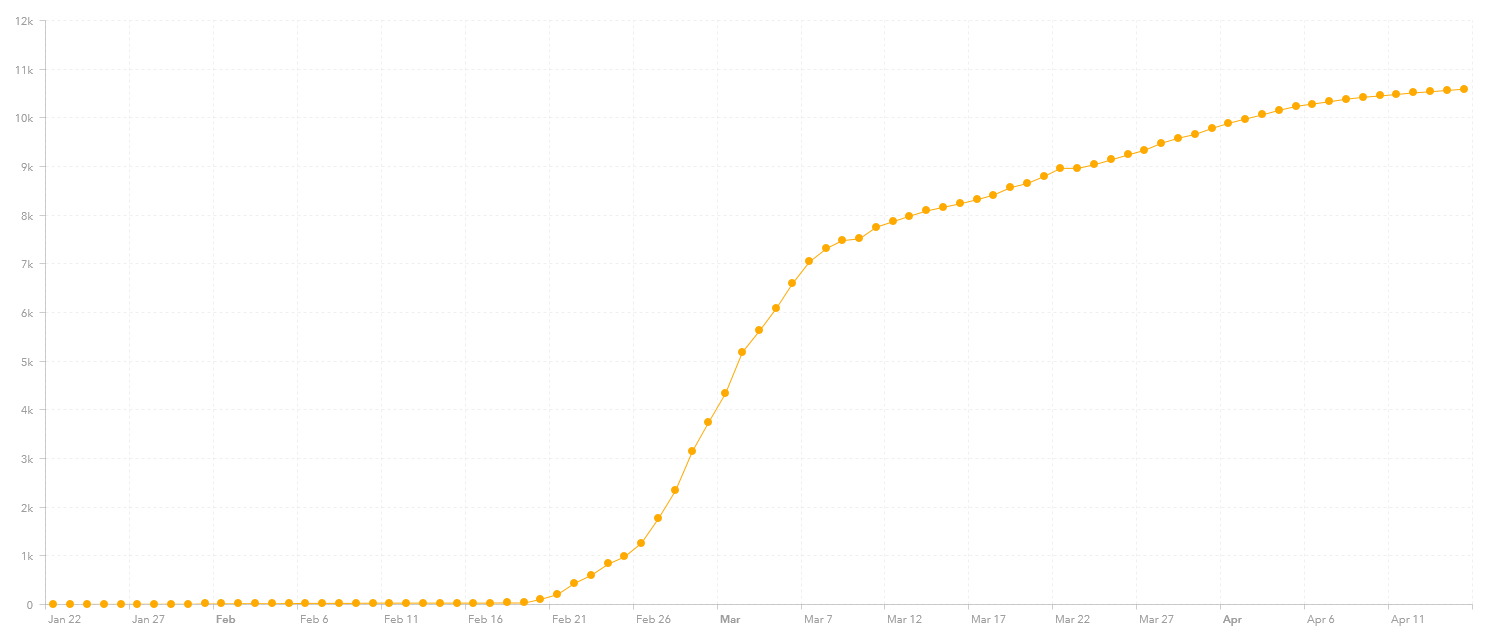
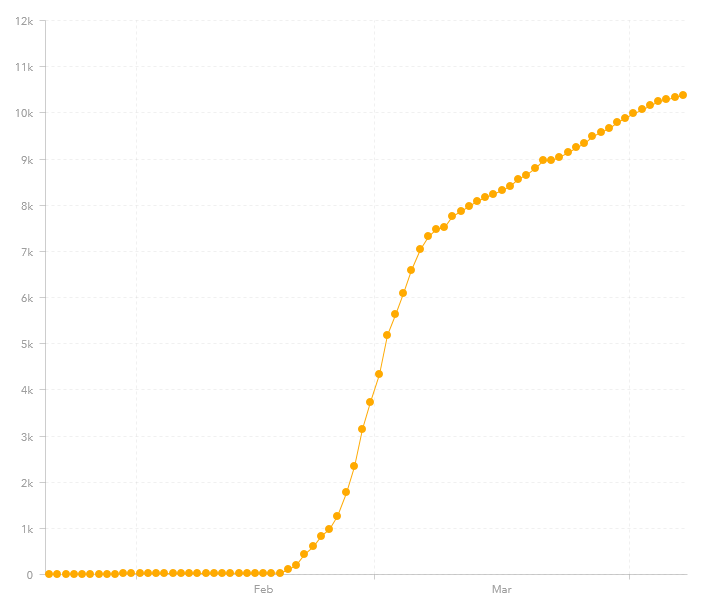
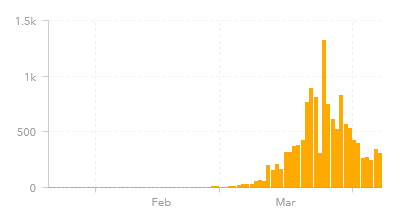
Here is the graph for the number of cases in South Korea (10,702 reported cases, only 89 more case than reported around this same time last week):

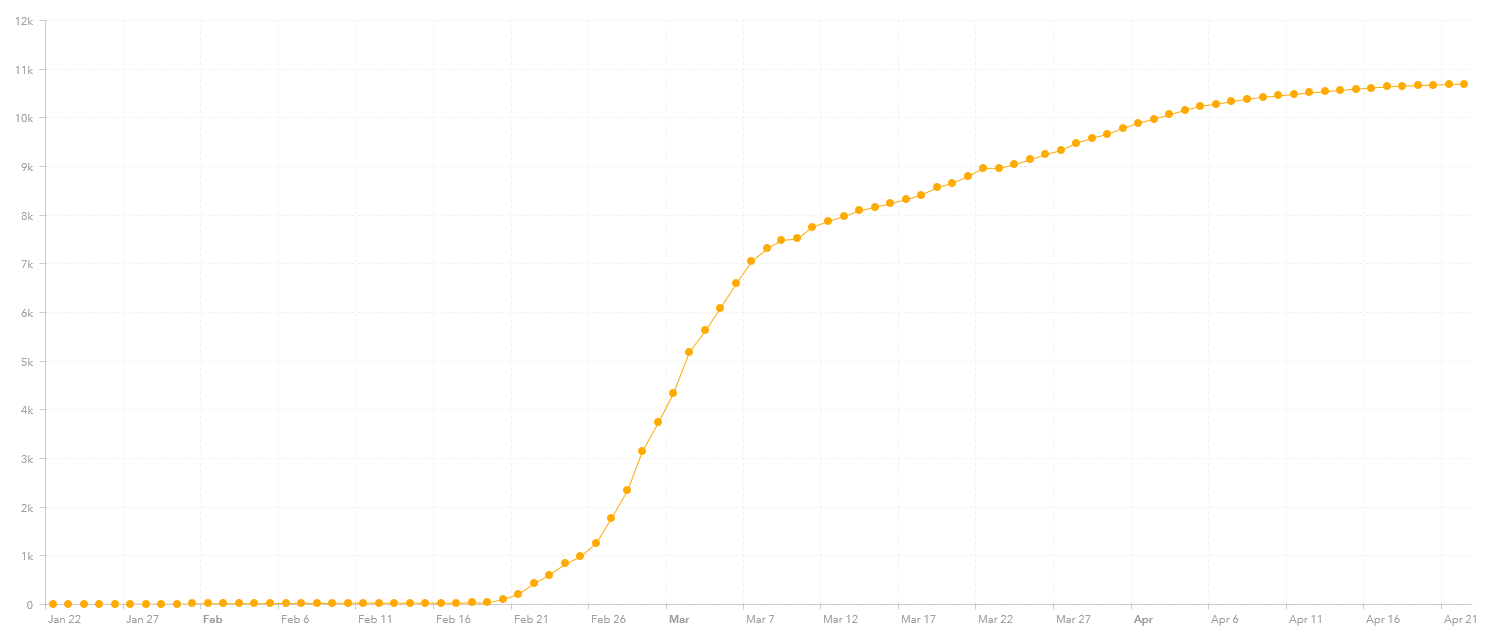
This is good. This looks like a country that now has the situation under control. Note how long it took (time is on the x-axis).

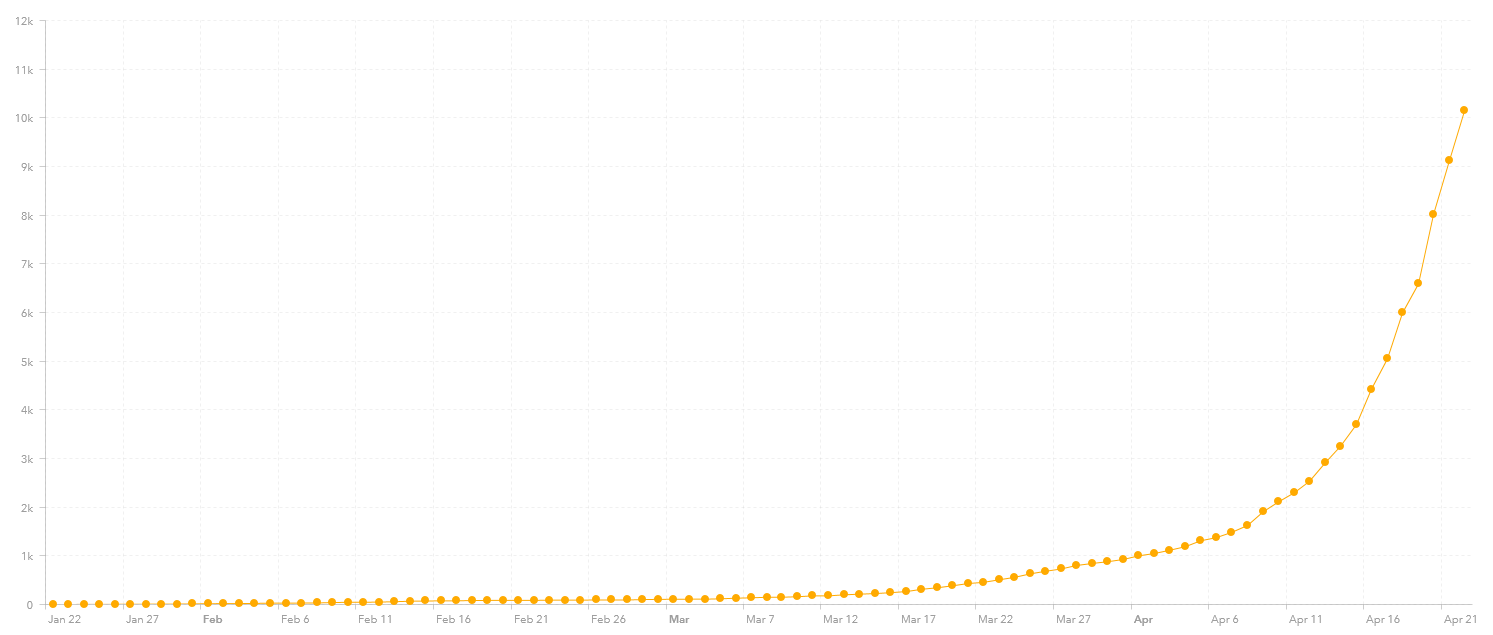
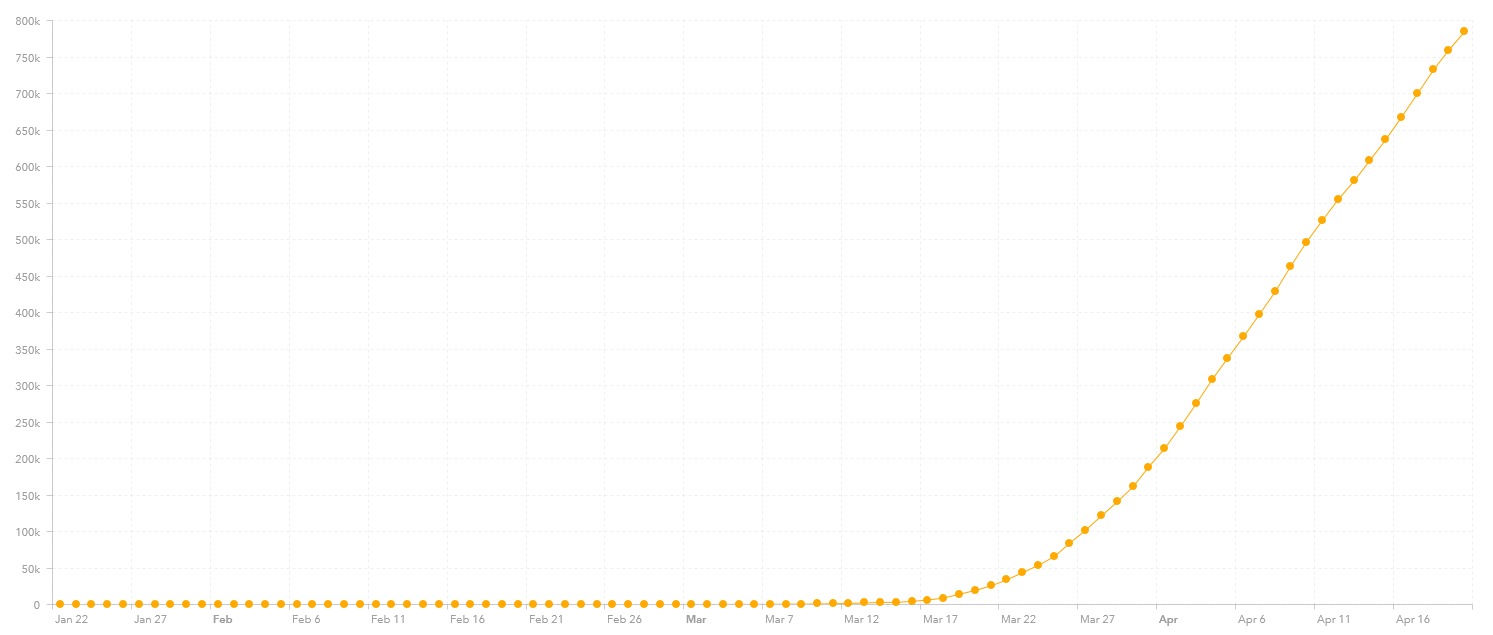
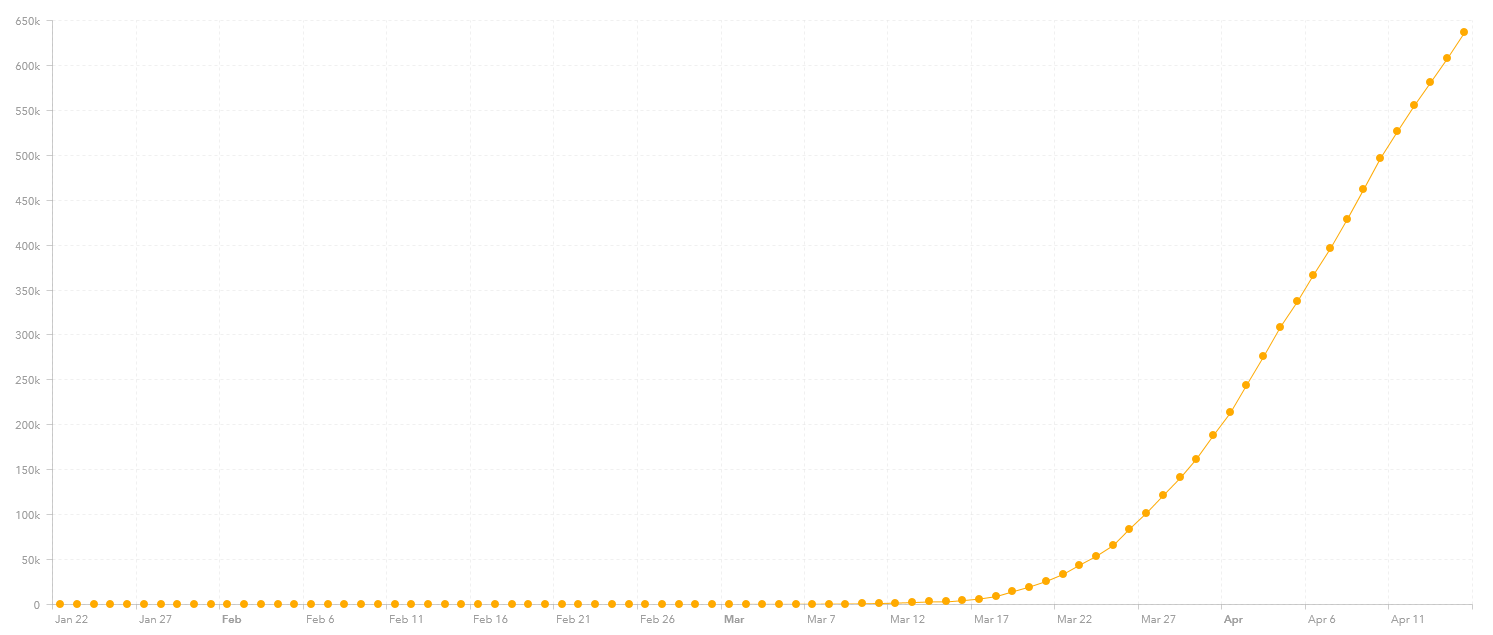
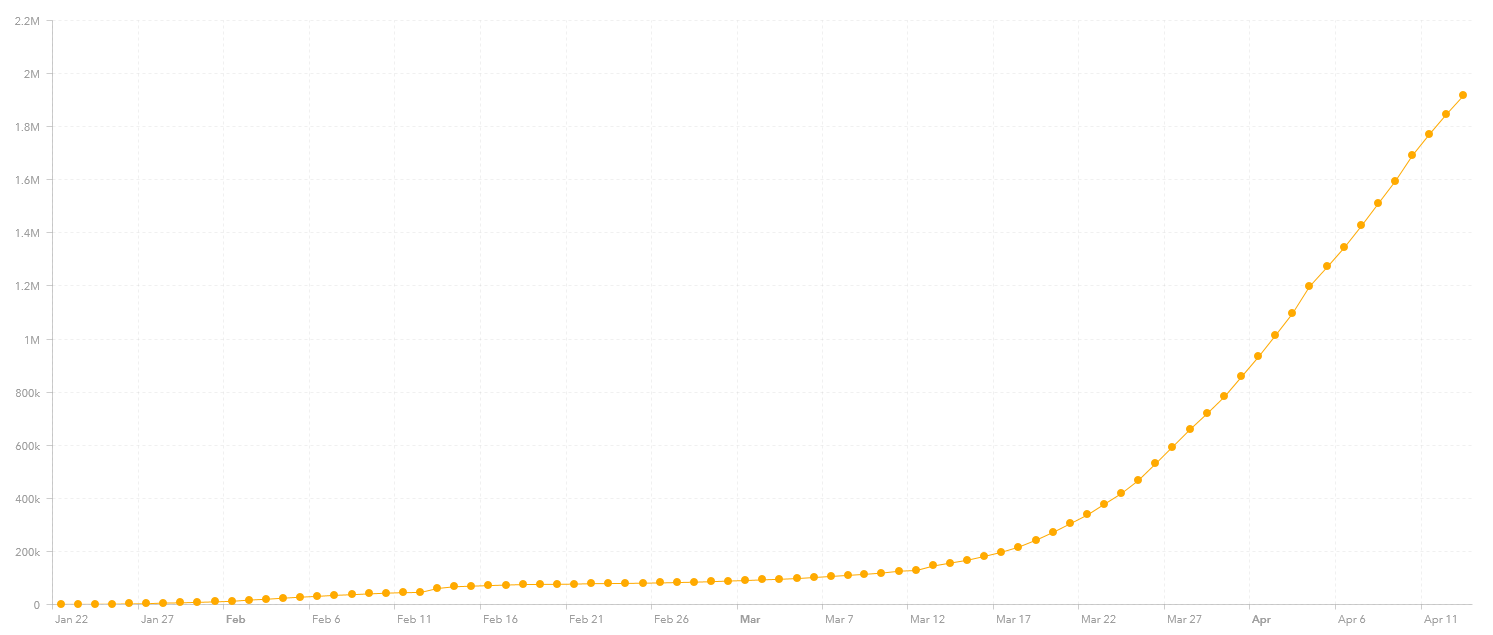
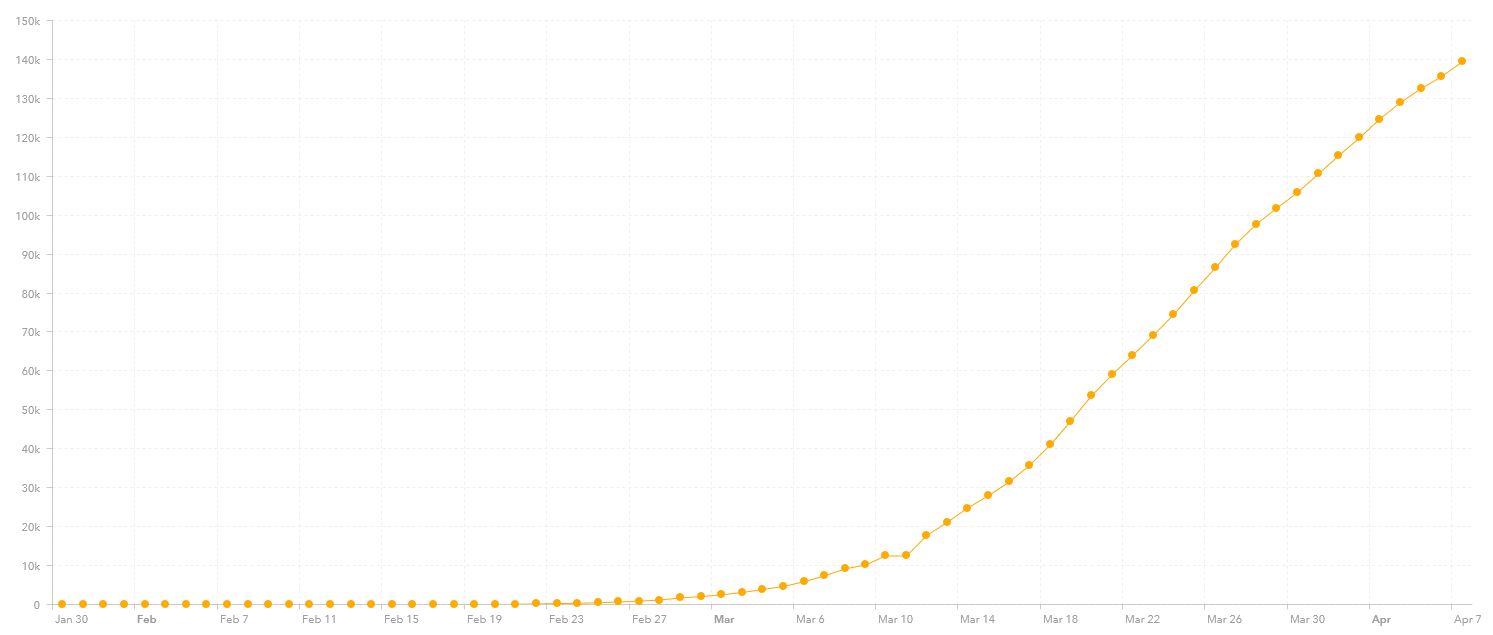
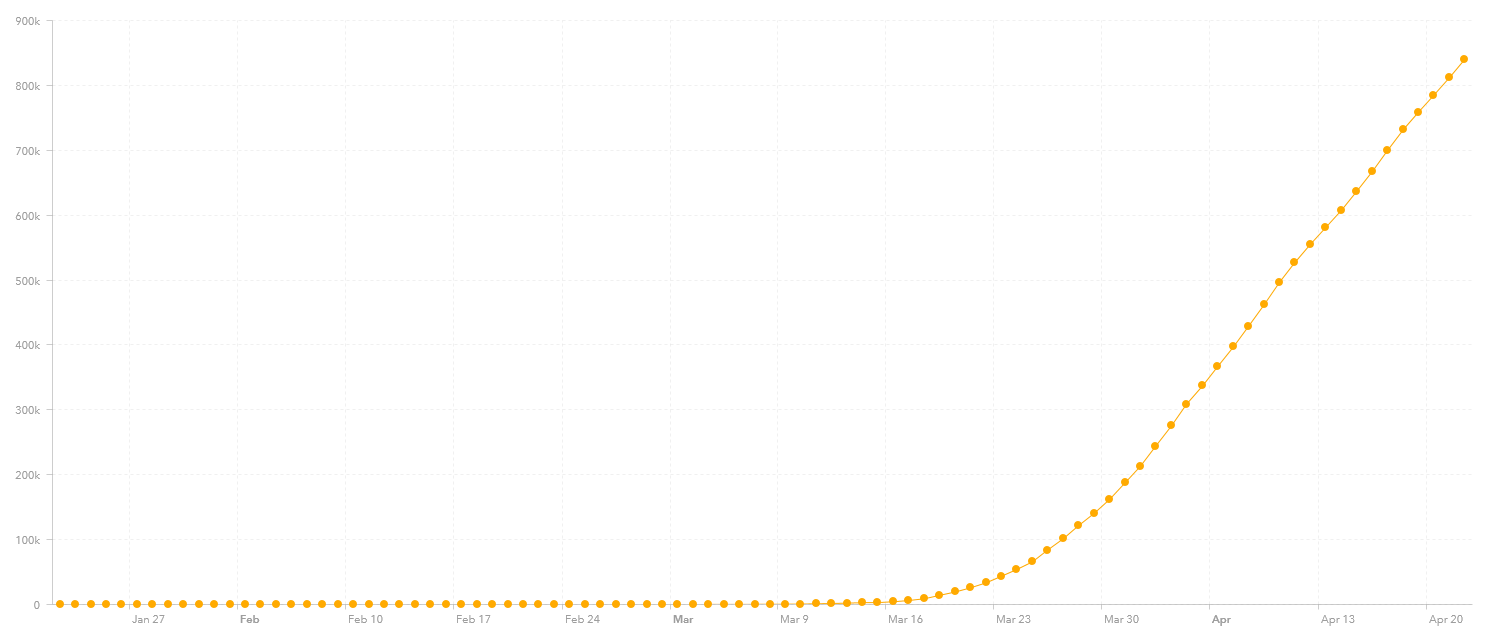
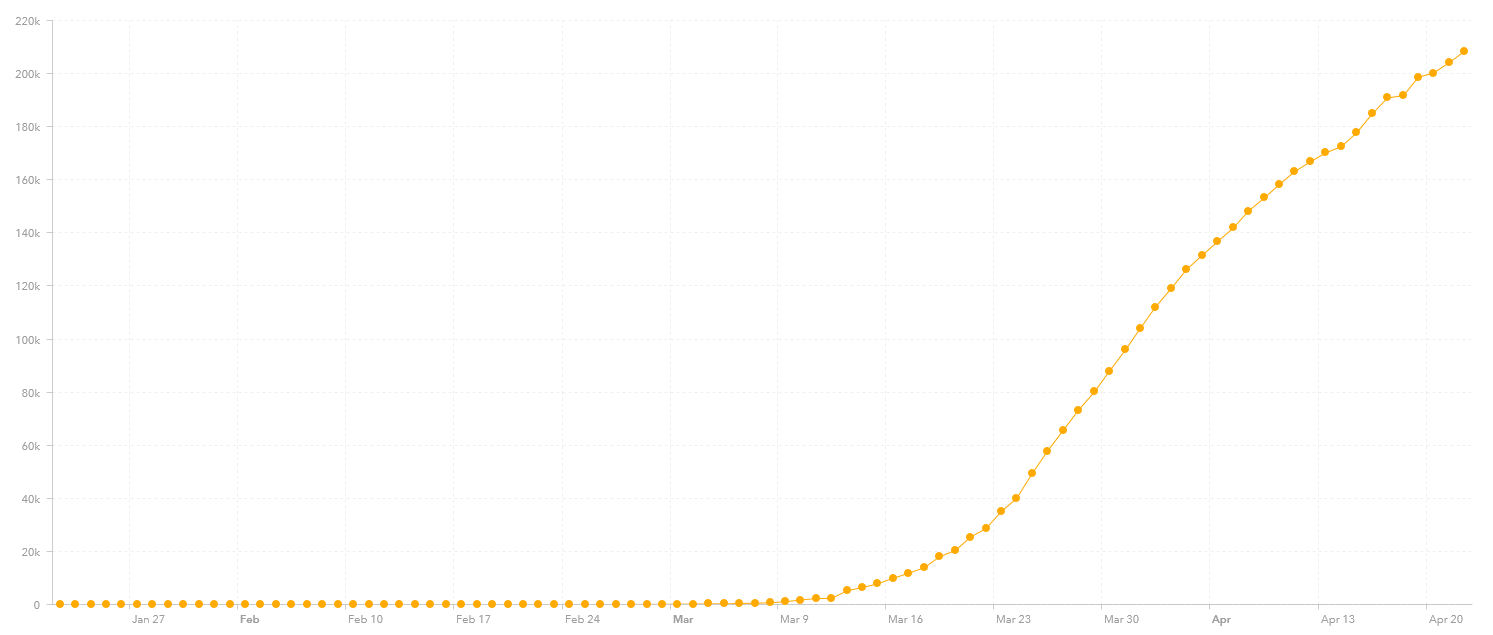
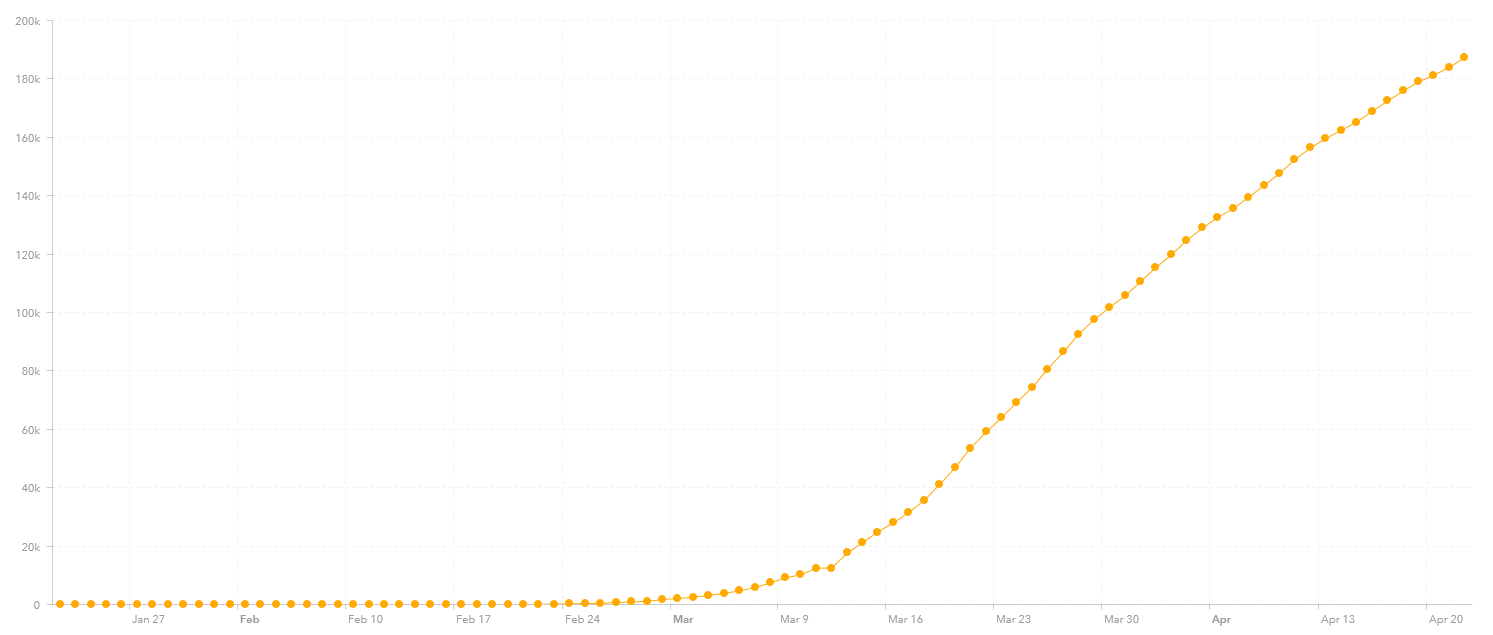
In comparison, here are the graphs for the United States (842,624 reported cases), Spain (213,024 reported cases) and Italy (187,327 reported cases). It looks like Spain and Italy are reaching their deflection point:

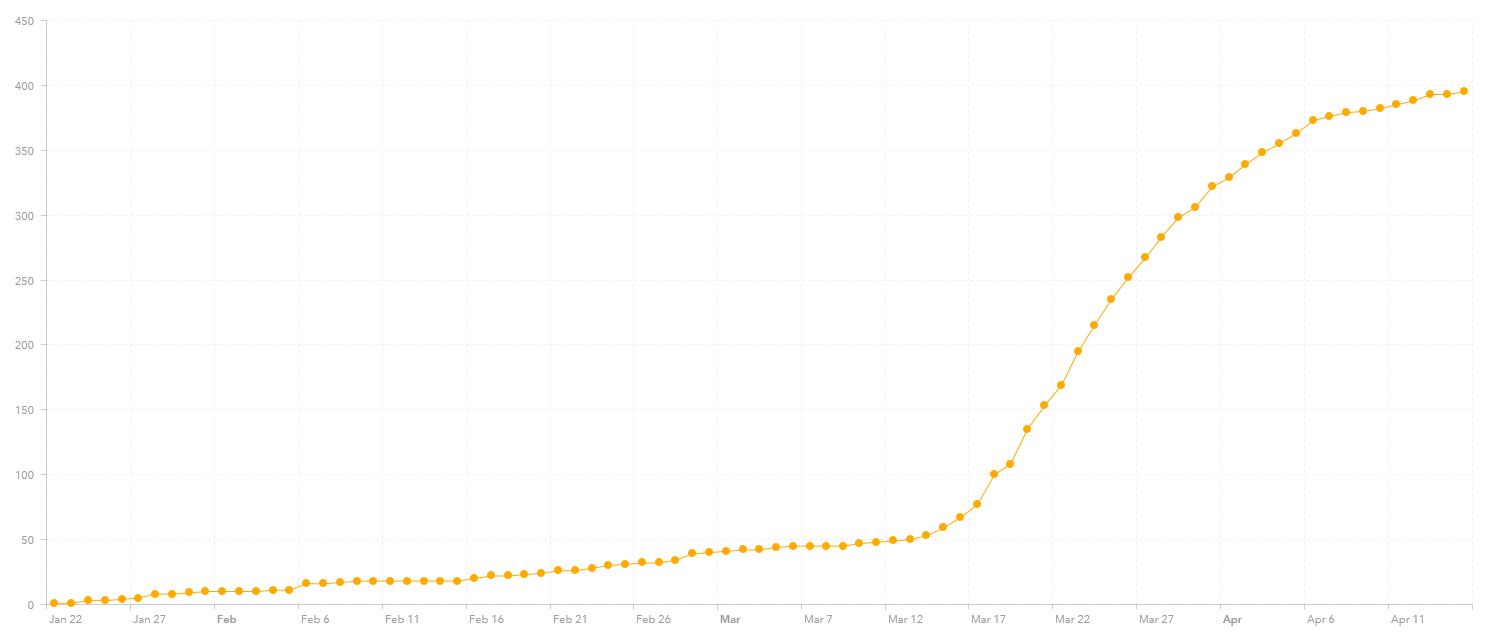
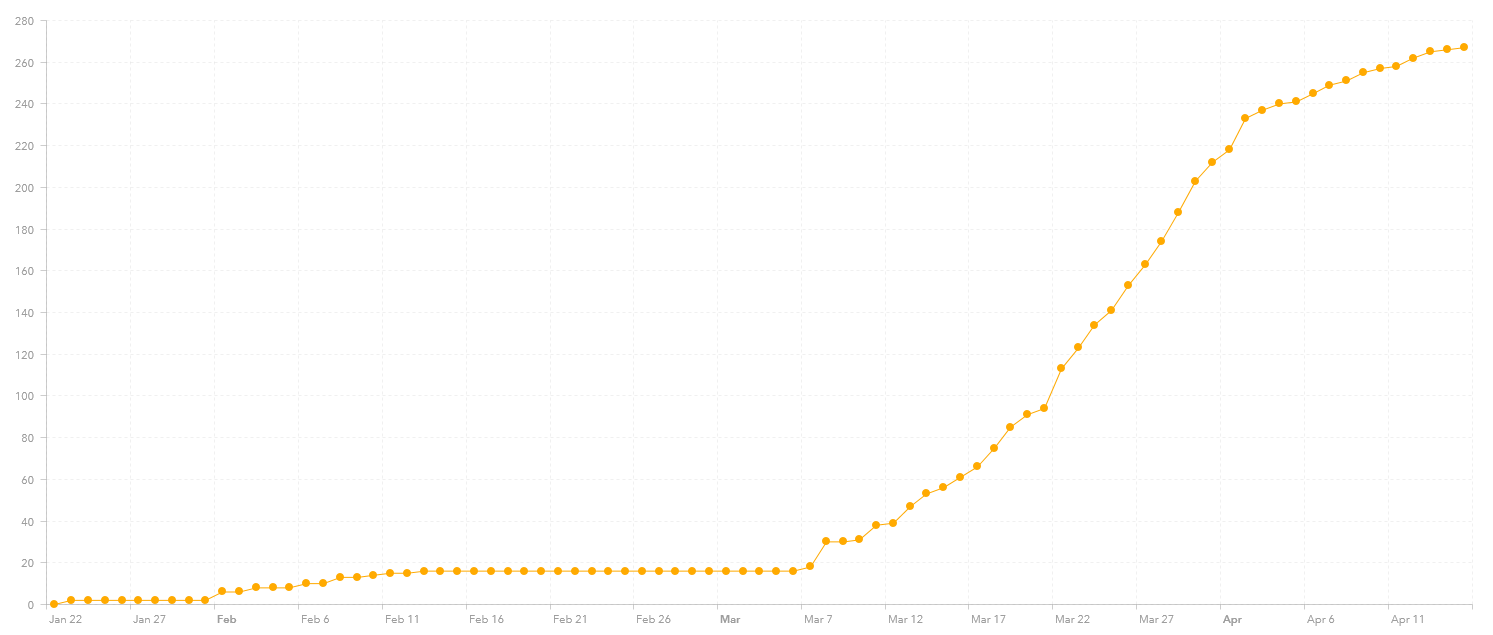
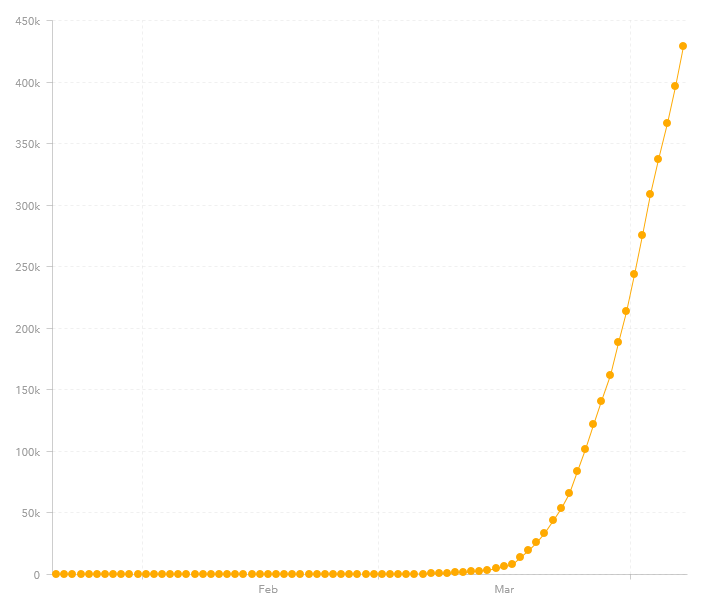
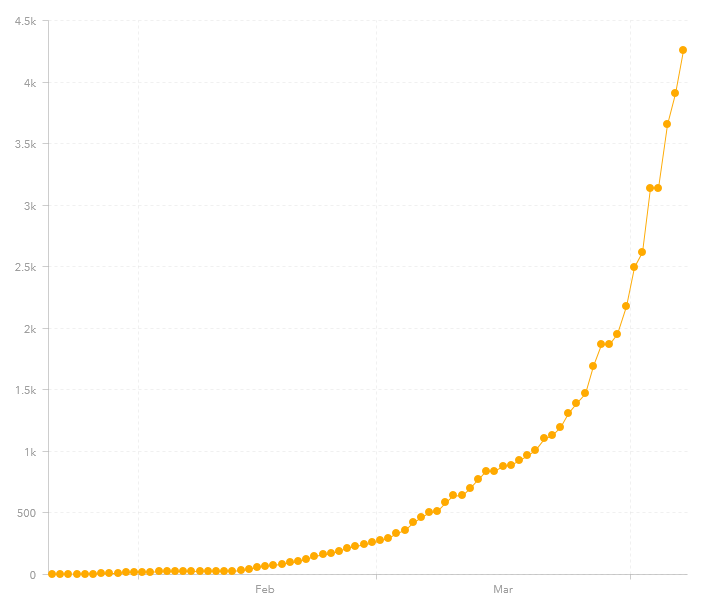
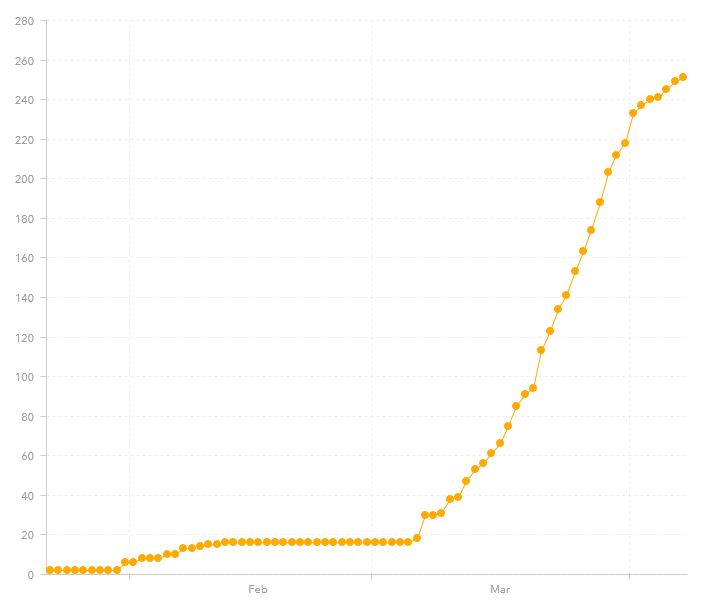
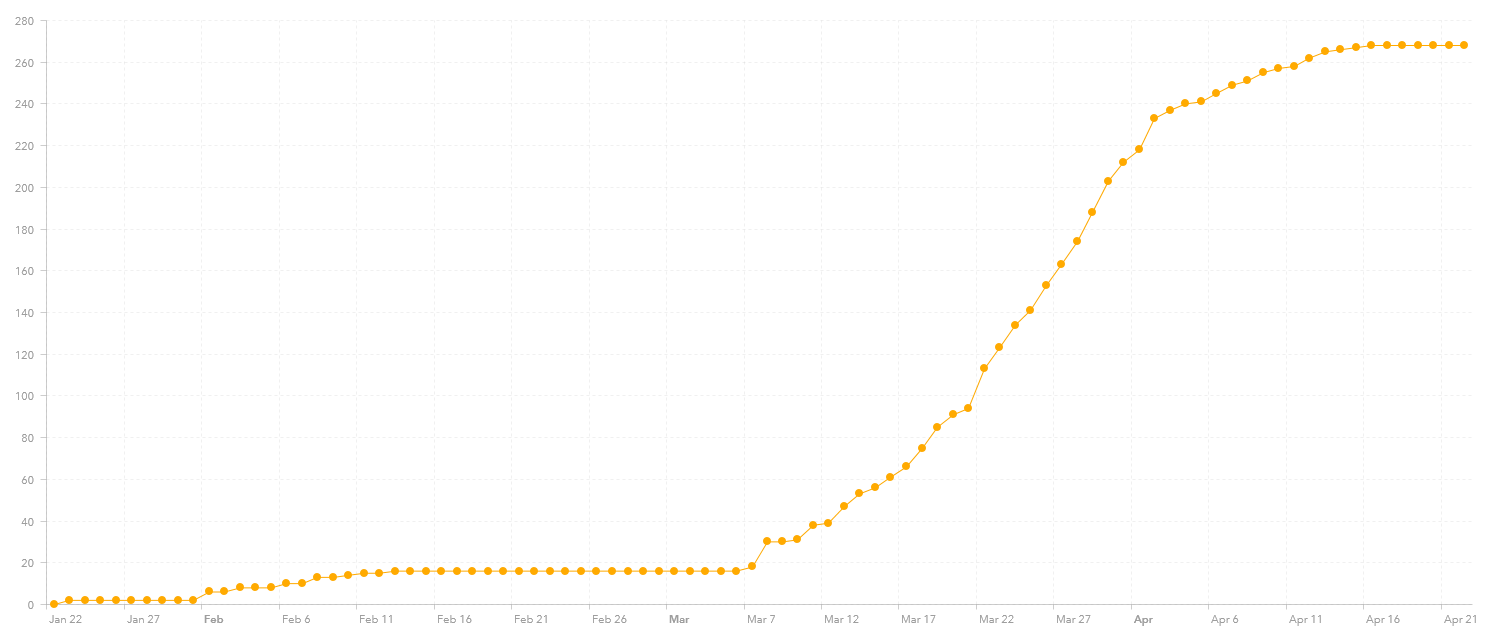
In contrast here are the graphs for three other East Asian nations, Japan (11,950 cases), Taiwan (427 cases) and Vietnam (268 cases, the same as last week). Not sure why Japan does not have the virus under control like South Korea does. This would be worth looking into.

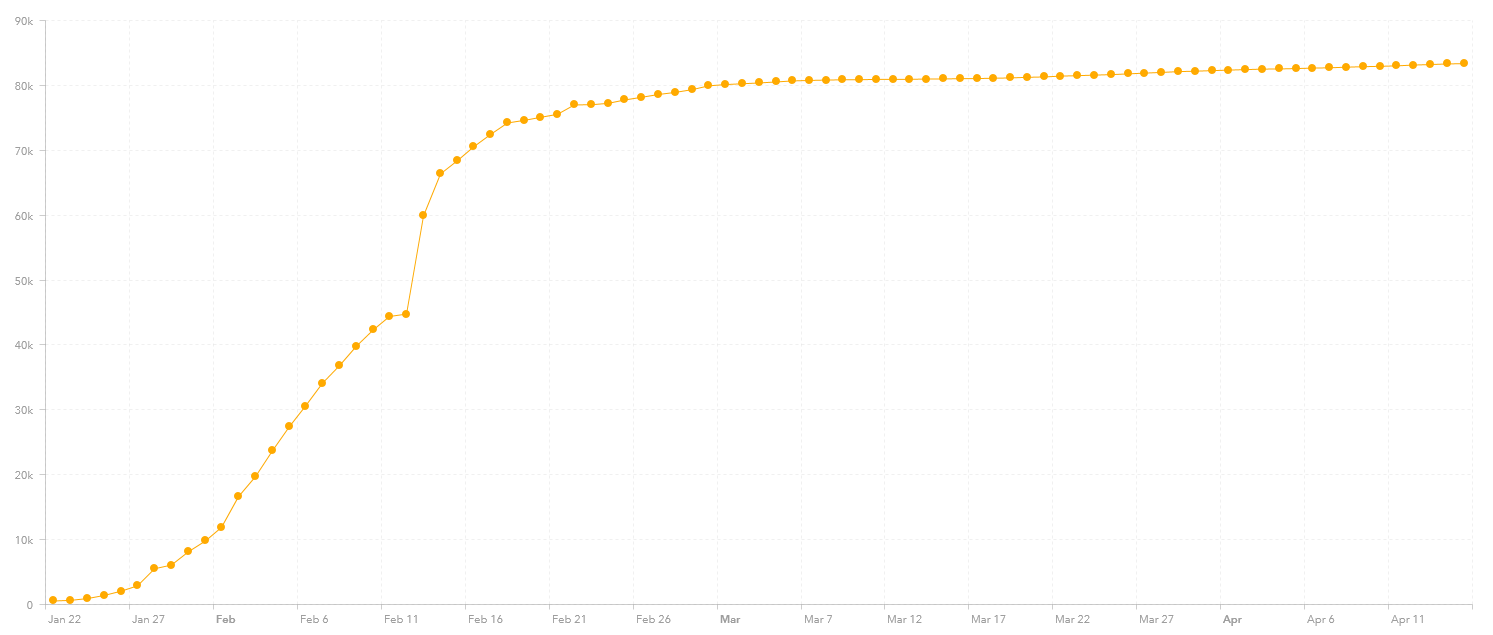
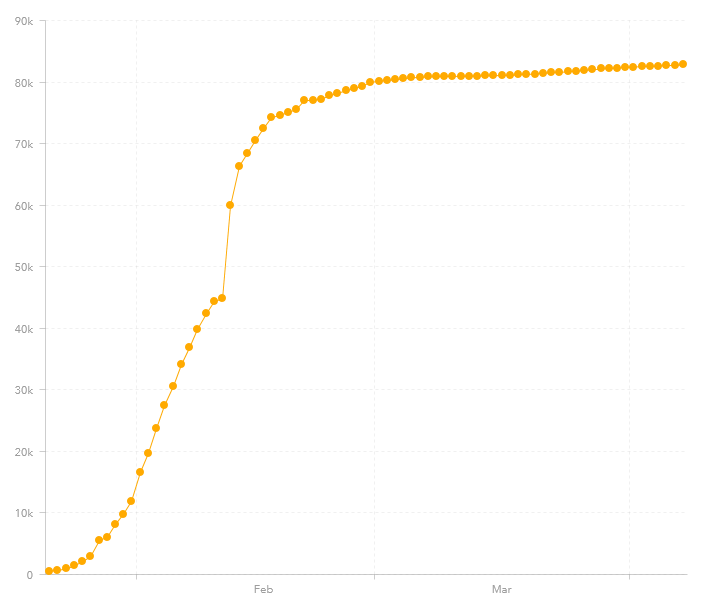
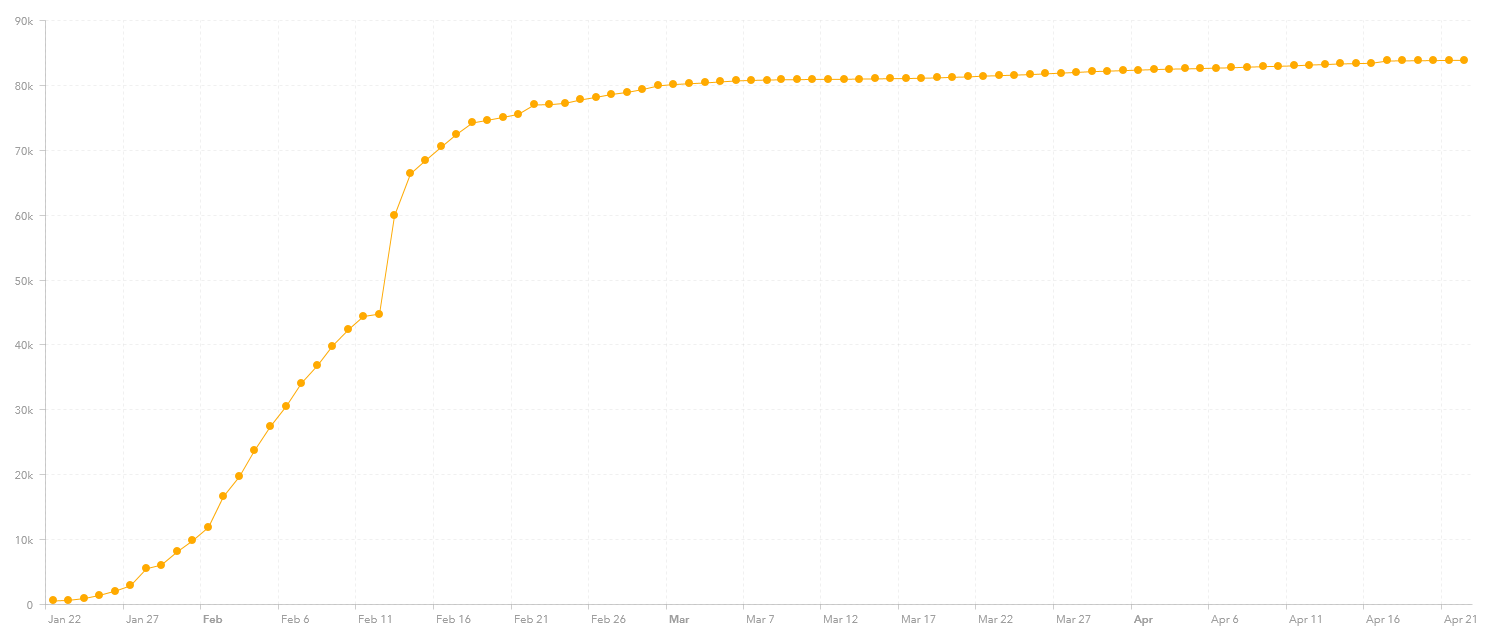
And here is China (83,878 reported cases), although there is still some concern about the accuracy of their statistics:

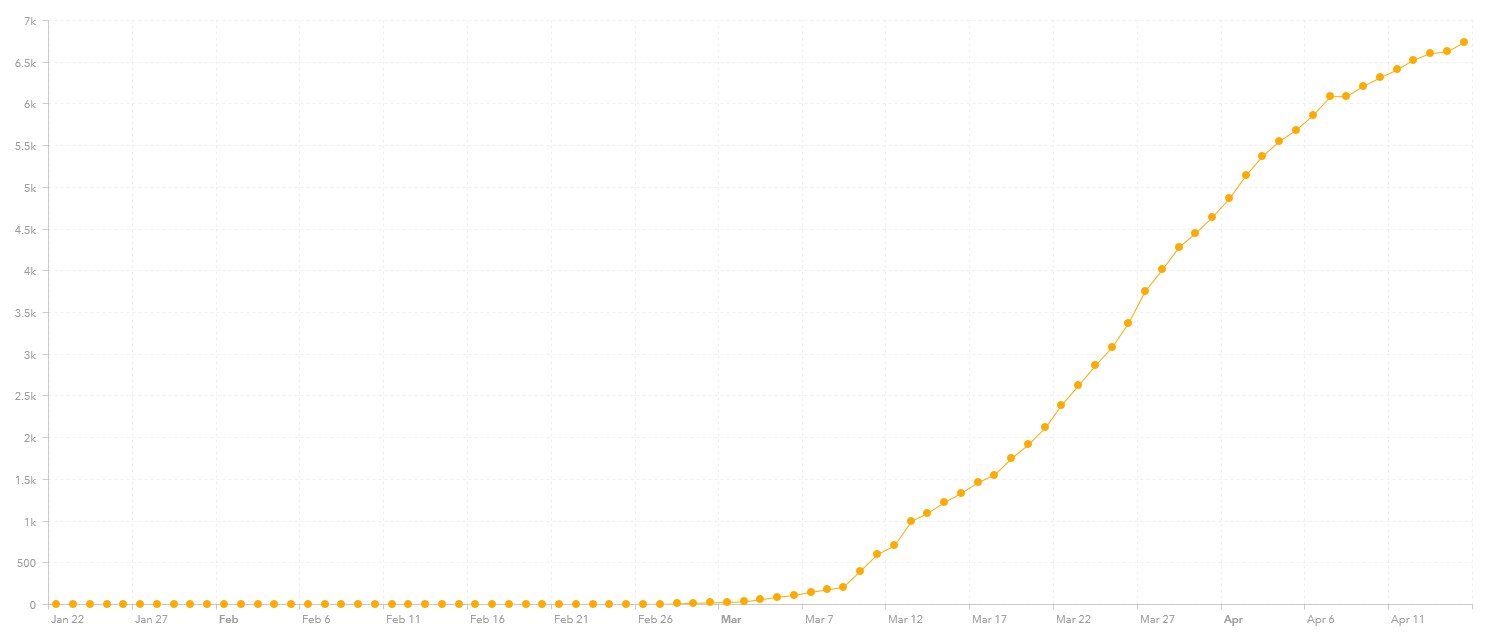
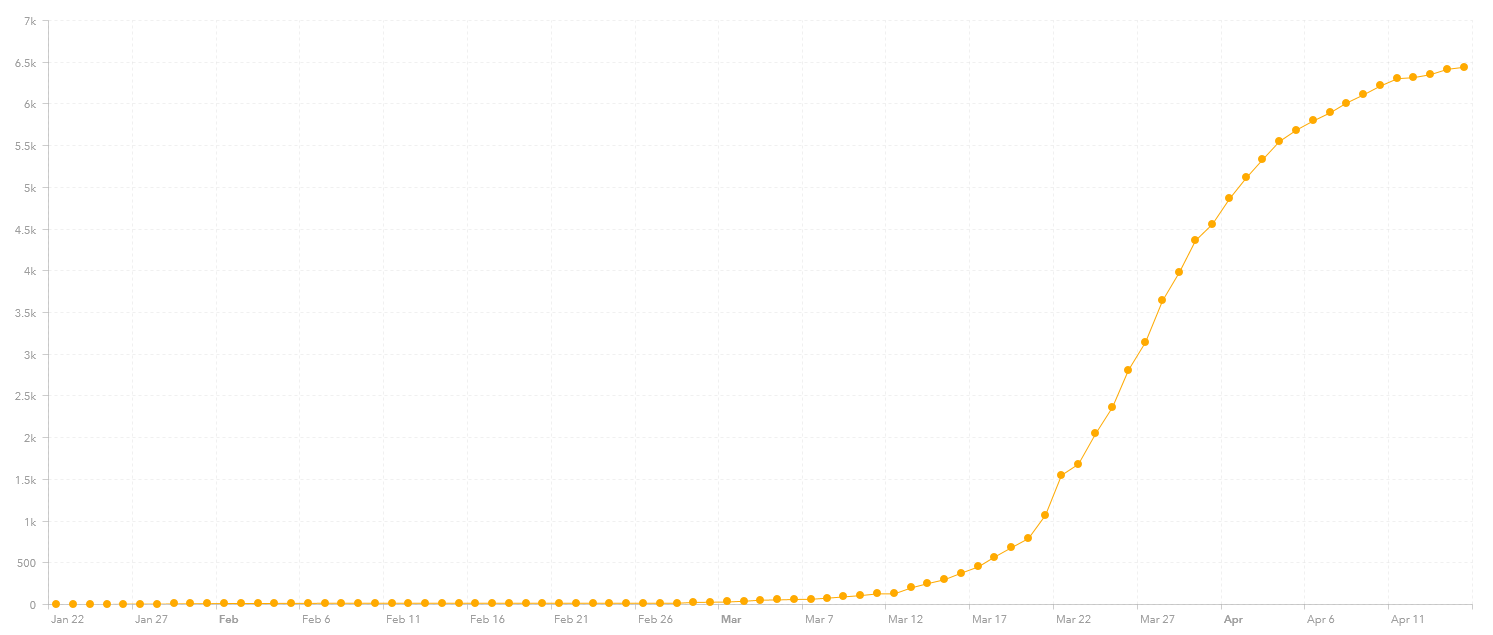
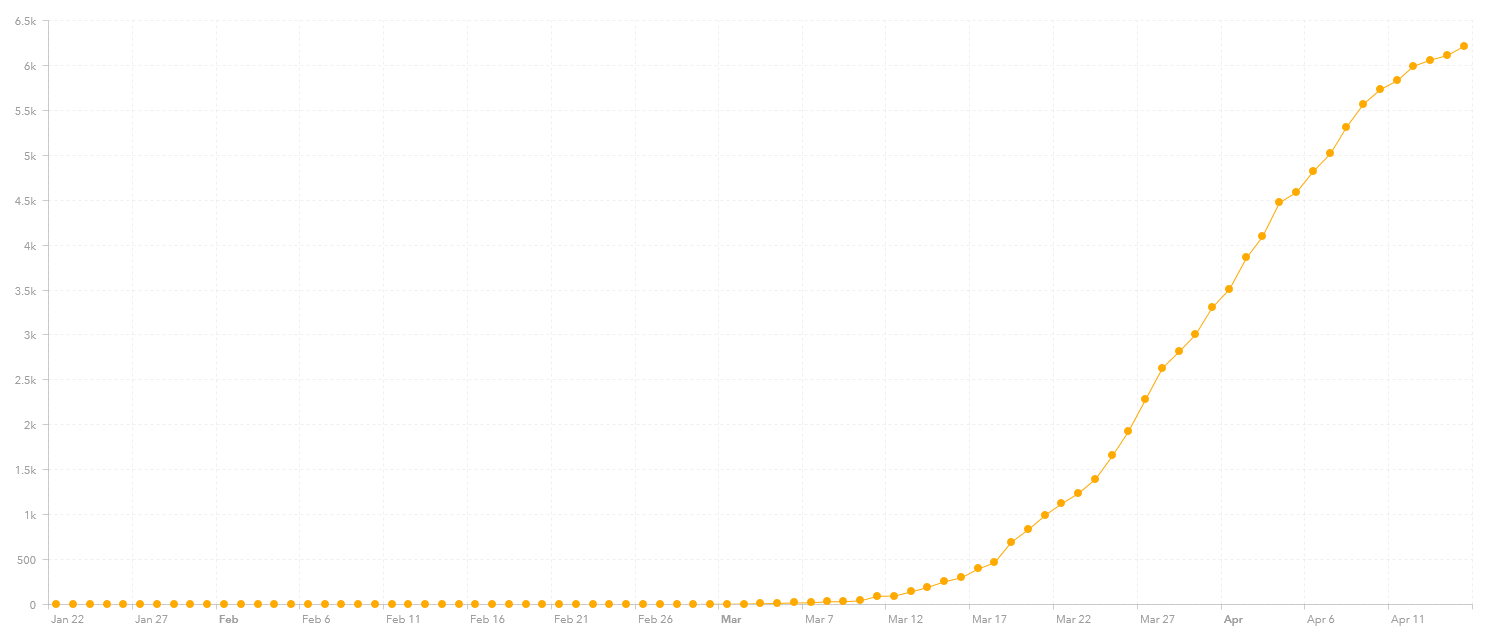
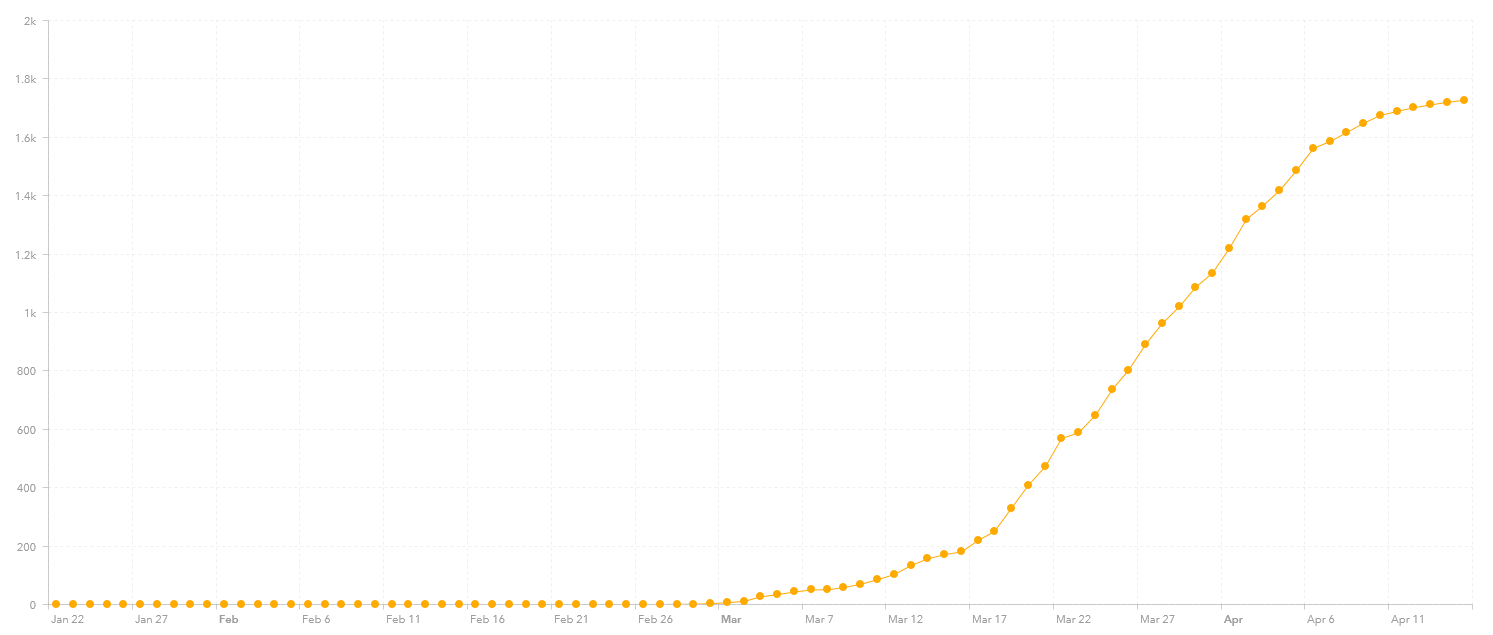
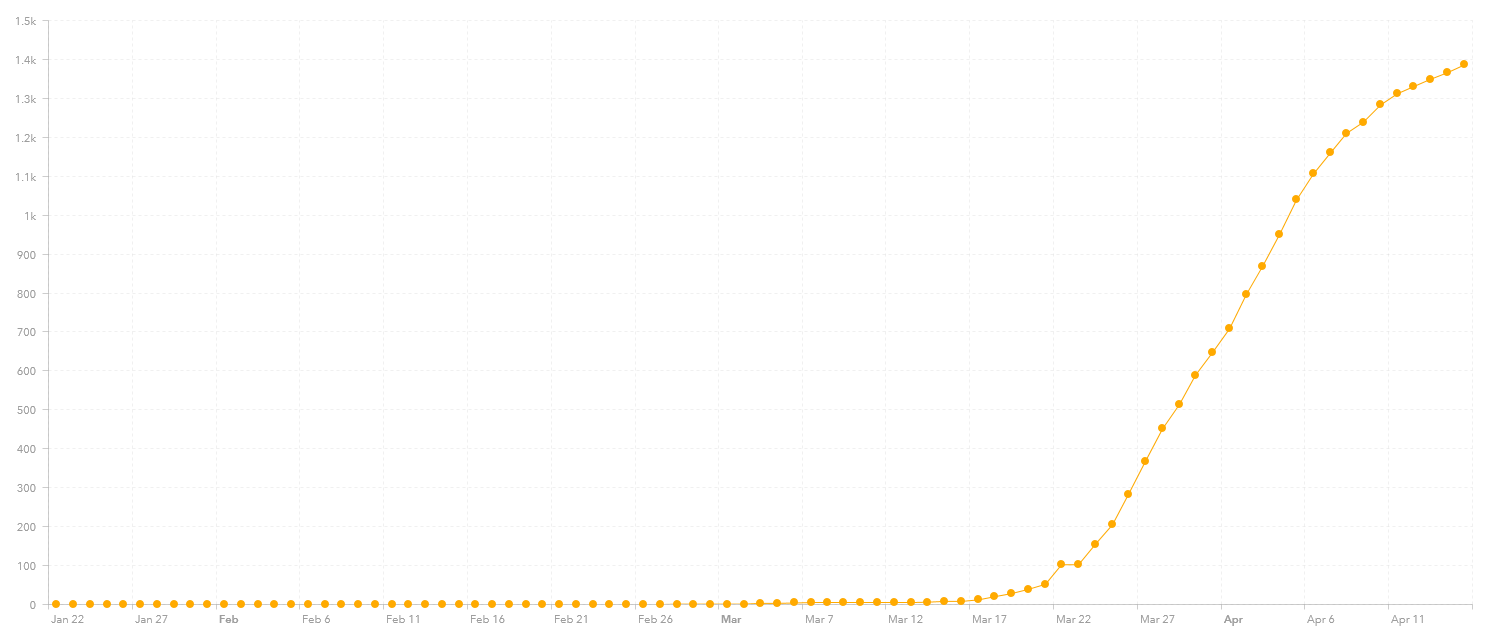
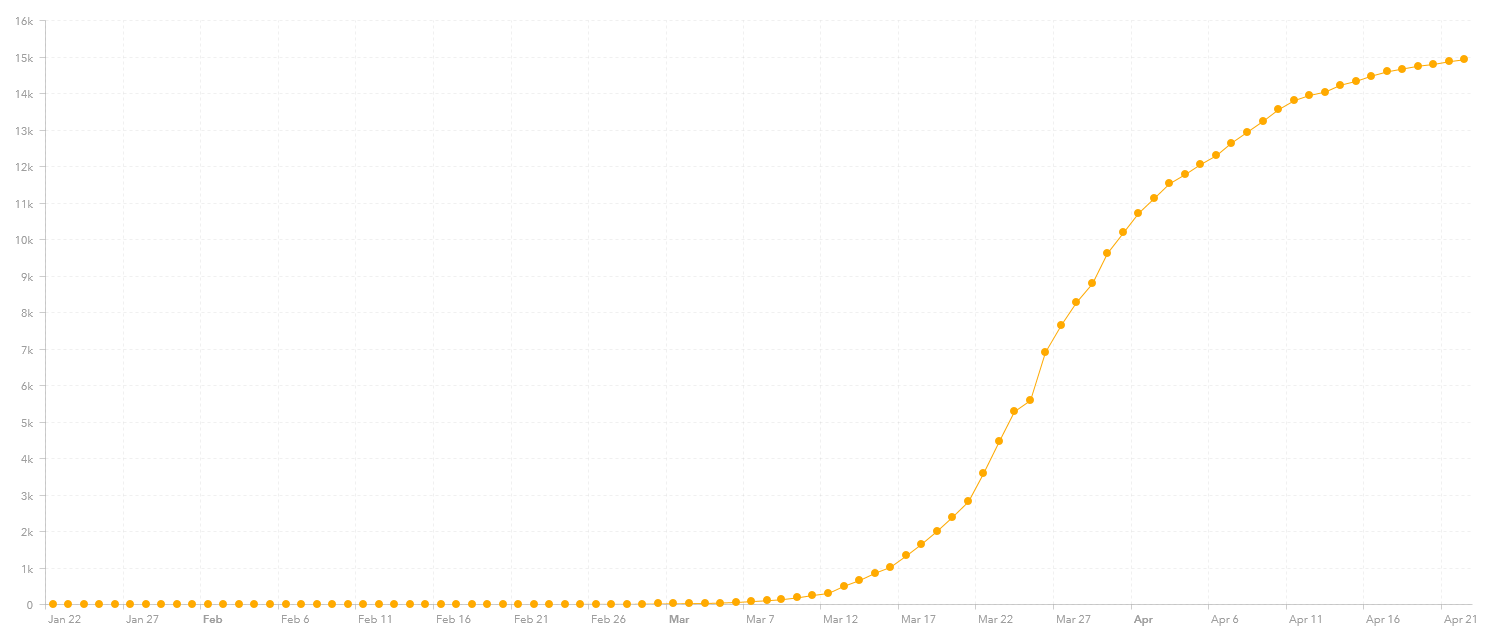
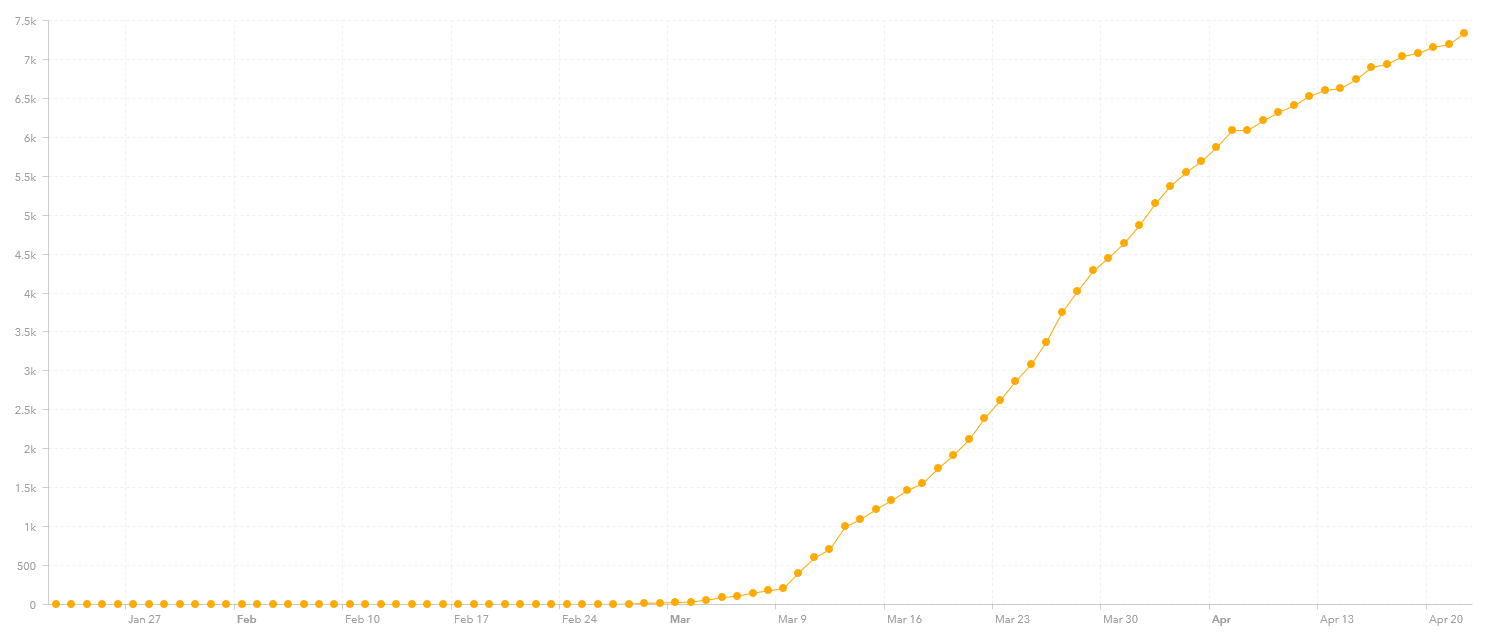
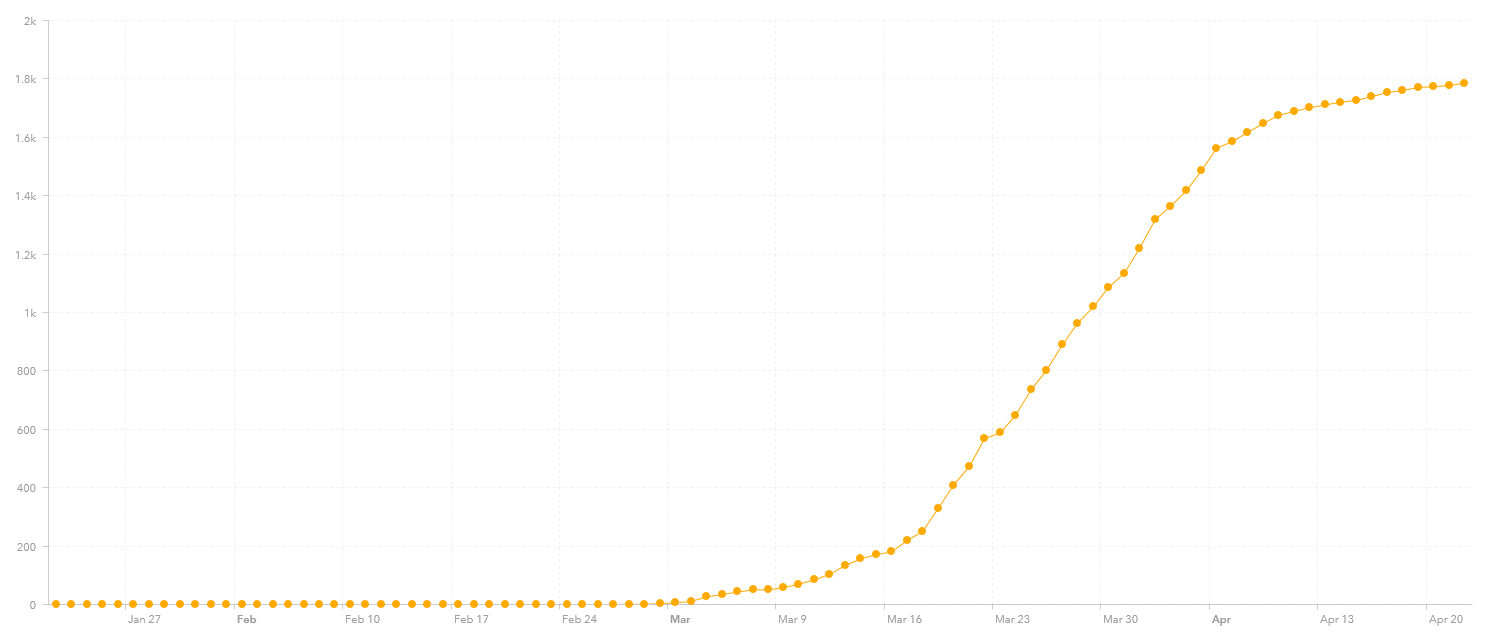
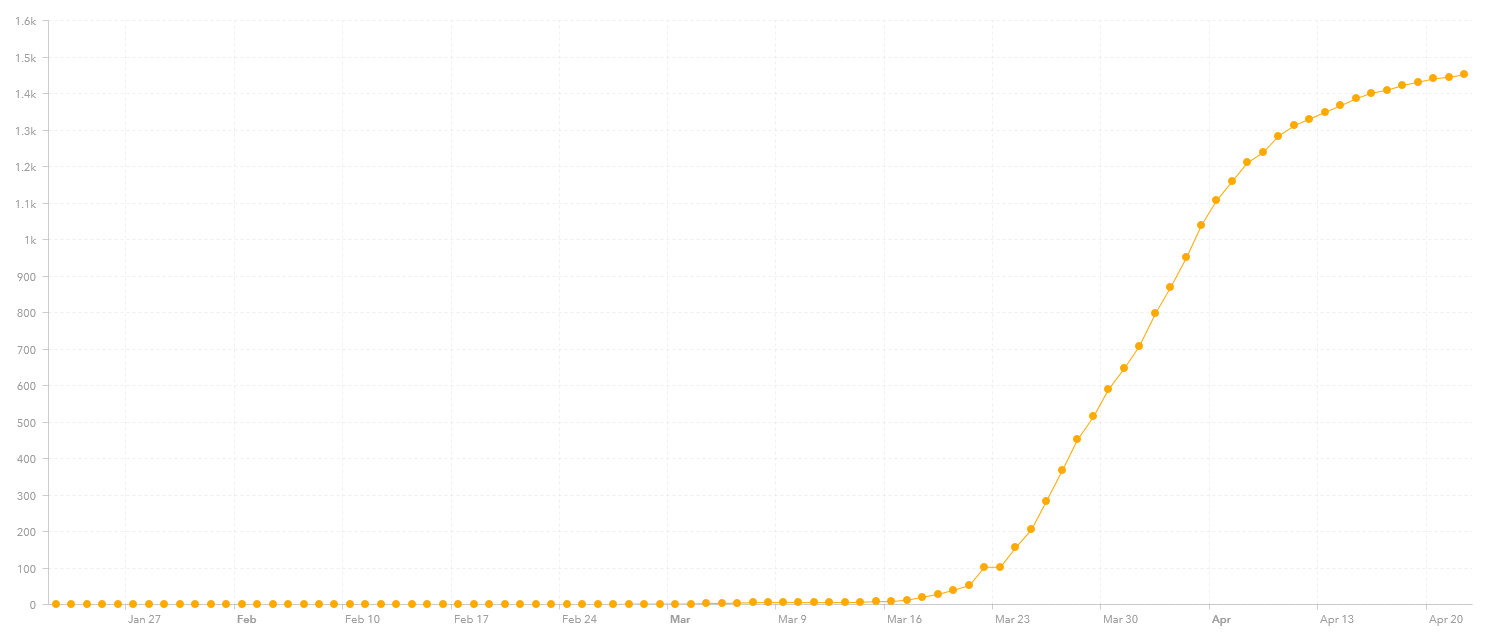
Finally, let me add the Austria (15,002 reported cases), Norway (7,338 reported cases), Australia (6,547 reported cases and only 85 new cases since last week), the Czech Republic (7,136 reported cases), Iceland (1,785 reported cases and only 58 new cases since last week) and New Zealand (1,451 reported cases and only 50 new cases since last week) to this collection of graphs as it appears that they are now reaching their inflection point and some have started leveling off:

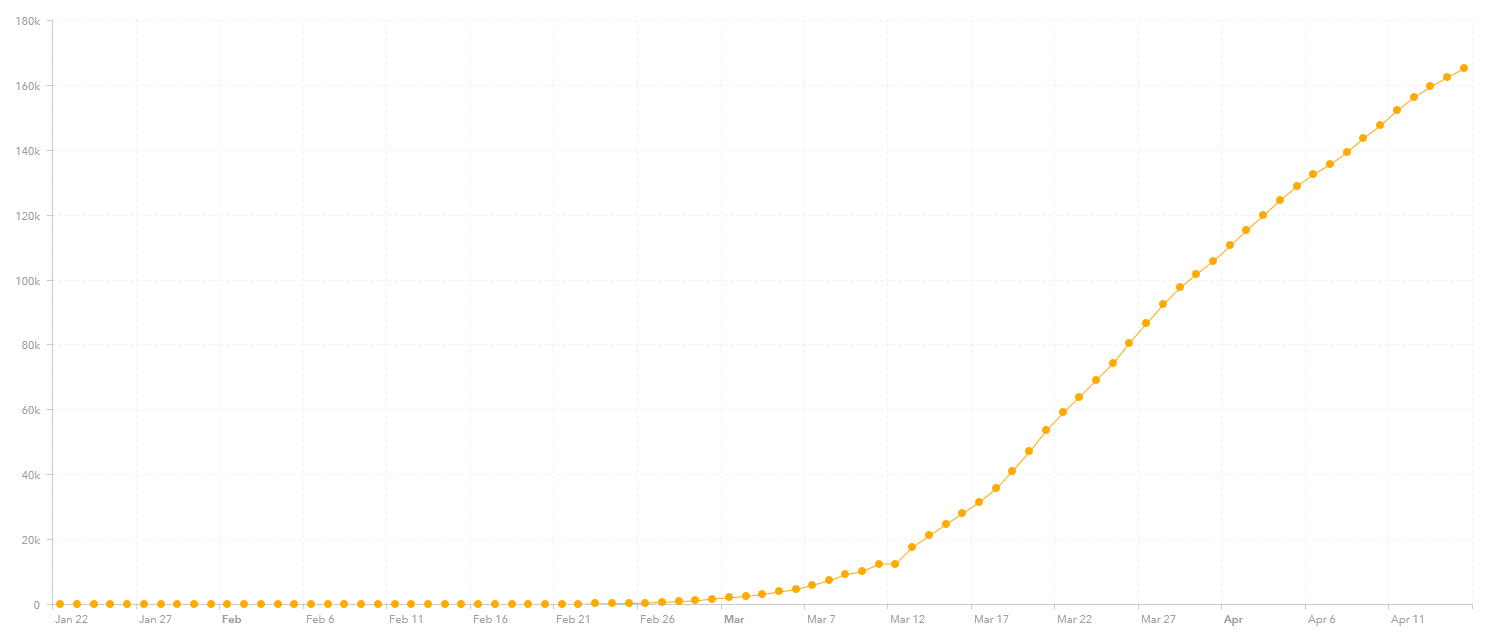
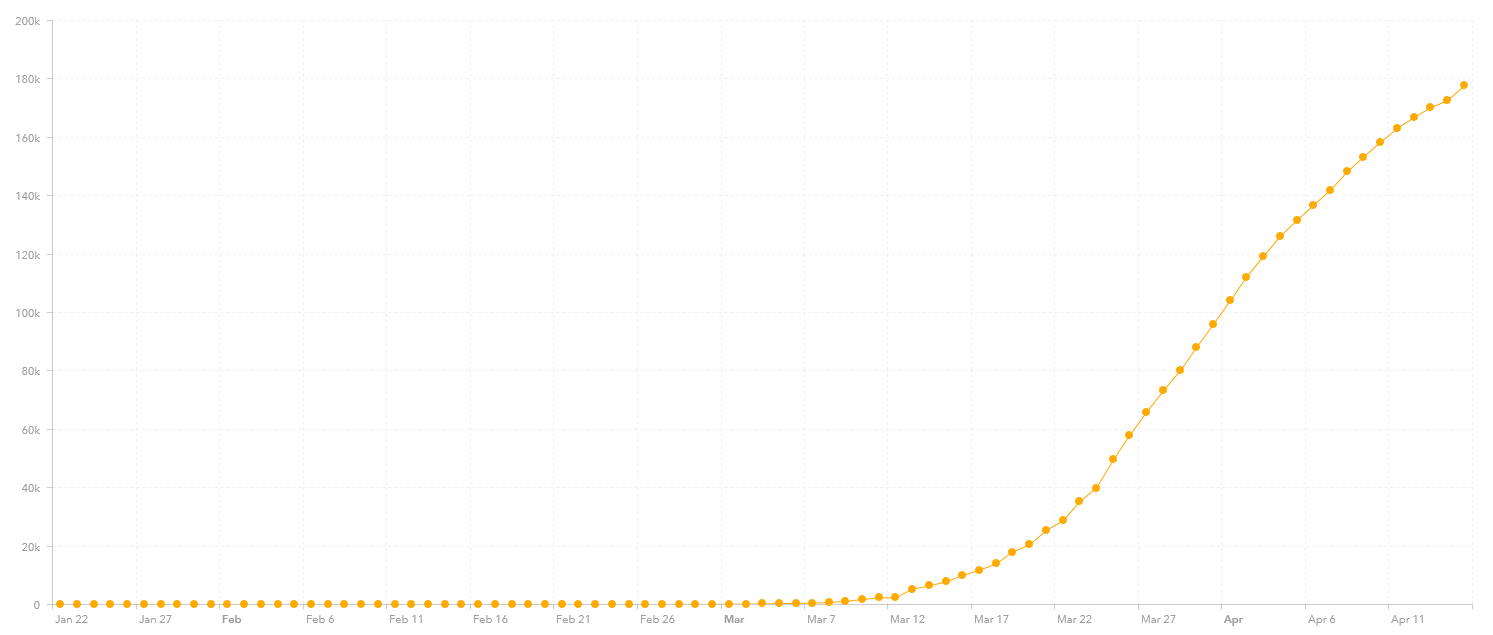
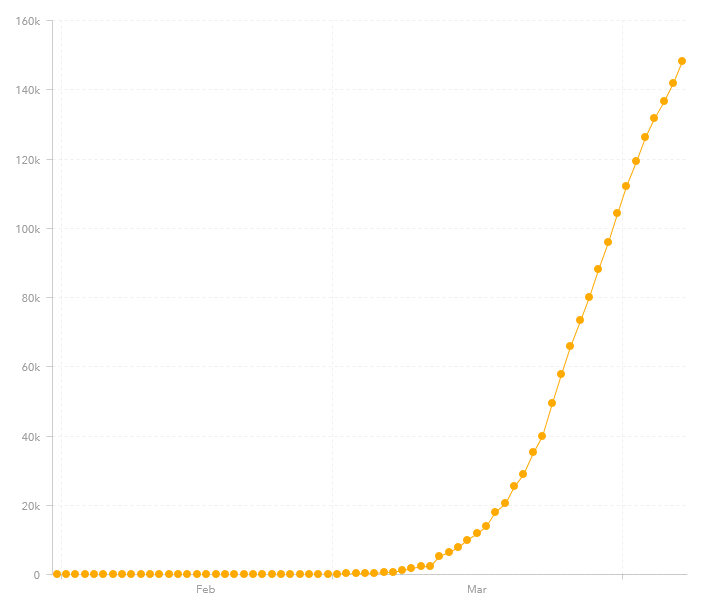
Finally, there is Germany, which has the fifth highest number of reported cases (at 150,773). They also appear to be bringing this under control.

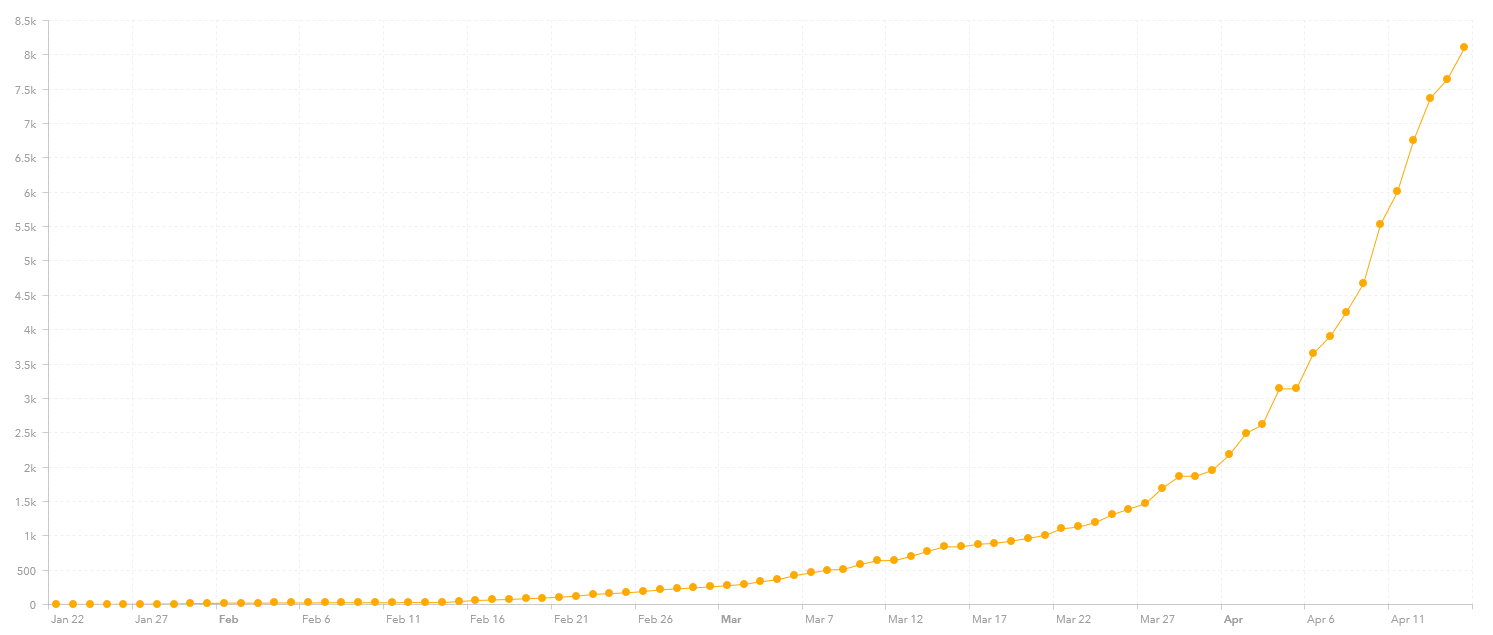
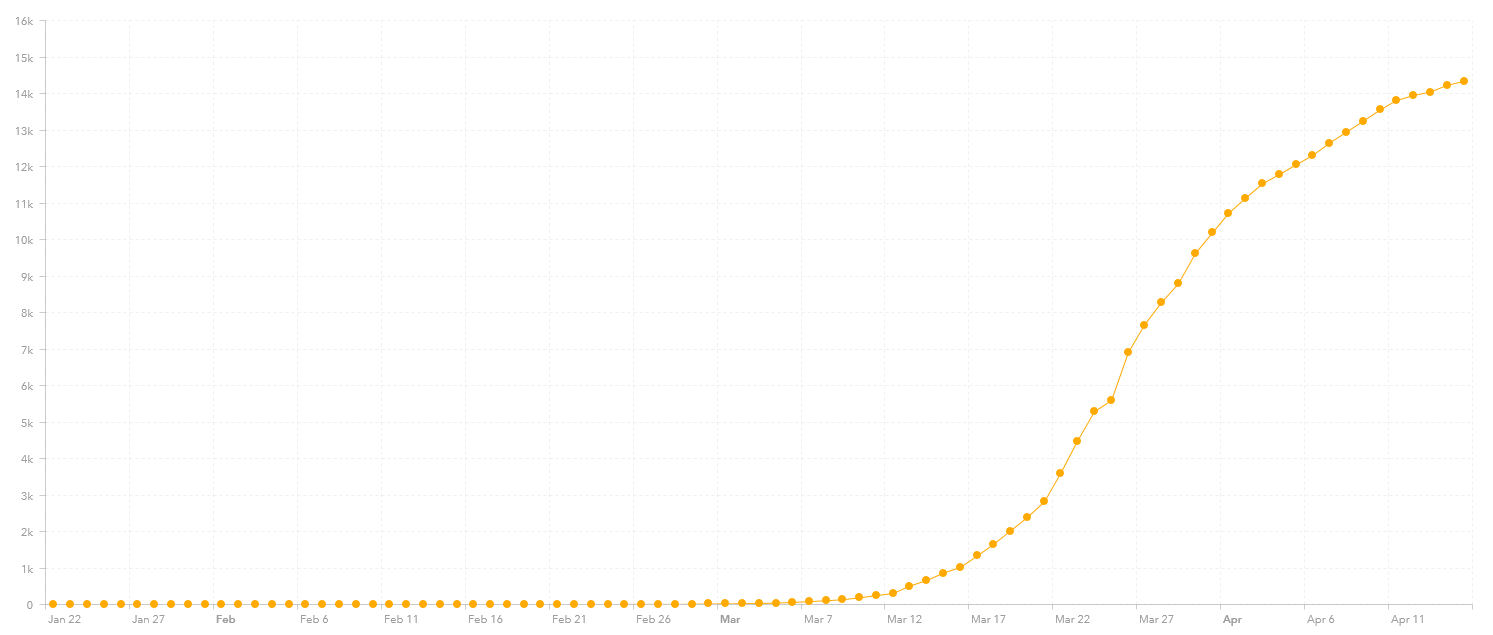
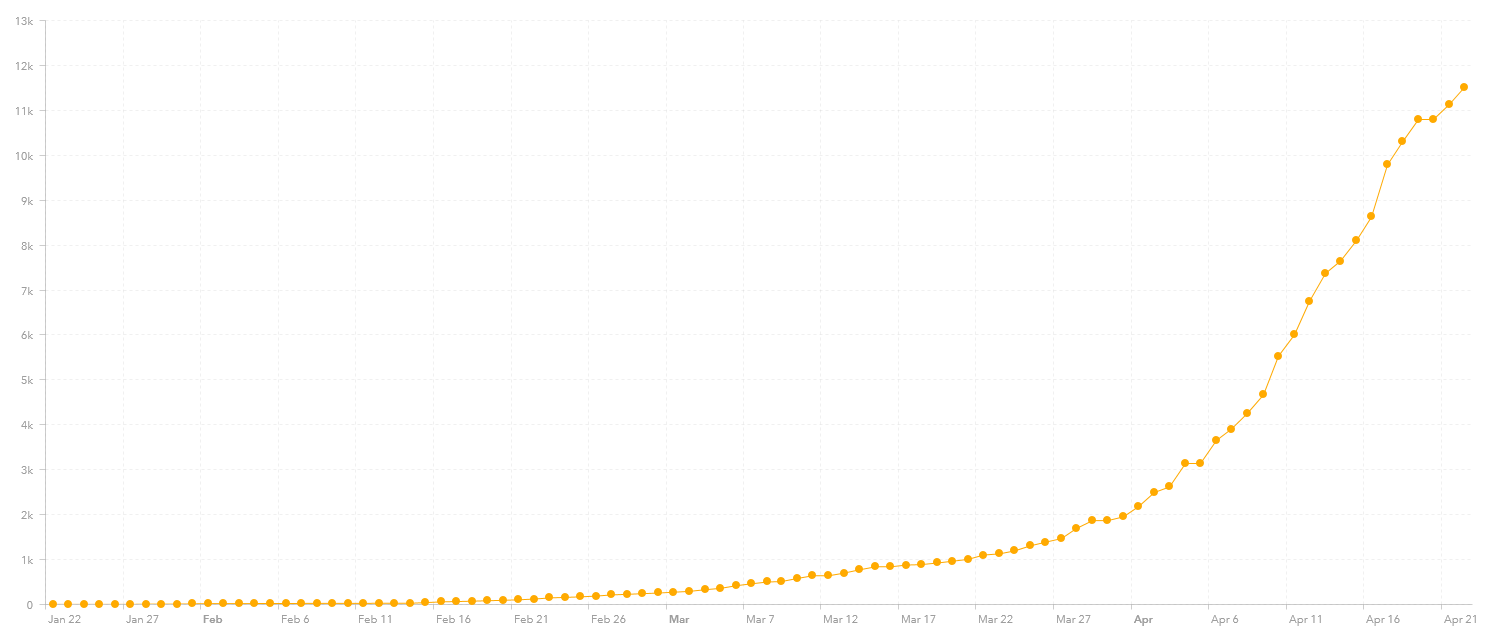
And then there is Singapore. Last week it had 3,614 reported cases. Now it has 11,178 reported cases. It appears that they have lost control of the situation again.

Coronavirus in the DC area – update 3

As I live and work in Northern Virginia, just a few miles outside of Washington, DC, the local situation is of interest to me, as I suspect it is to a few other readers. I will be maintaining these updates on Wednesdays for a while. Again, all the data is from the Johns Hopkin’s website (which I gather is also maintained in the DC area), as of 8:39:28 AM: Johns Hopkins CSSE

The DC area is rather sprawling, with over 5 million people scattered across DC, Virginia and Maryland. Let me list the presence of virus by location. I list the number of cases from the post three weeks ago, two weeks ago, last week’s post followed by the number of cases this week. Population is the 2018 estimate from Wikipedia:

……………………….….Population…..Week 3…Week 2…Week 1….Week 0…Deaths

Washington D.C…………..702,445……..507…….1,211……2,058… 3,098……..112

Arlington, VA…………..…..237,521…….104……….237………401……..625..…….22

Alexandria VA………….…160,530……….30…..…..126……..247……..462…………8

Fairfax County, VA……..1,150,795……..244……….532……1,207……2,077………37

Falls Church, VA……..…….14,772……………………………..….2………..24

Fairfax City, VA……..………24,574……………………………..…1…………22

Loudoun County, VA………406,850………87….……209…..…344……..468.………8

Prince Williams C., VA….…468,011…..….94….……236……..508………867……….1

Manassas…………………….41,641………………………………49………110

Manassas Park………….…..17,307………………………………13…………31

Stafford Country, VA………149,960…..….24….….….49…….…95………164

Fredericksburg, VA…….…..29,144…………1……….….8………14………..17

Montgomery C., MD….…1,052,567……..447…..……871..…1,883…….2,768..…116

Prince Georges C., MD….909,308……….403……..1,020……2,356…….3,734……118

Total……….…….…….…5,365,425….…1,941……..4,499……9,178……14,467……422


The number of cases appeared to be doubling at every locale each week for the last three weeks. This week, it only went up by half (actually 58%). So, this is a more positive trend. There were 23 deaths recorded three weeks ago, 76 two weeks ago, 222 last week and 422 this week.

The Mortality Rate for the area is 2.92%. The population known to be infected is 0.27%. or one confirmed case for every 371 people. As I suspect the real morality rate is 1% or lower, then probably about 1% of the area is infected.

From my observations, most people are doing a reasonable job of self isolating. Probably easier to do in this more spread out suburban area than in some cities. They do say that this area will become one of the next hotspots, but because it is spread out and primarily suburban, I don’t think it will be anything like New York. The fact that the rate of spread is already declining is a positive sign.

The Washington DC statistic area according to some also includes Warren, Clarke, Fauquier, and Spotsylvania Counties in Virginia, Jefferson County in West Virginia, Frederick, Howard, Charles and Calvert Counties in Maryland. I rarely go to these places. Of interest to me is Albemarle County, VA with 66 confirmed cases (50 last week) and Charlottesville, VA which has 41 confirmed cases (36 last week) and 1 death. Montgomery County, VA has 48 cases (33 last week). These two areas are the home of UVA and Virginia Tech, two large universities located in a more rural environment.

Coronavius Mortality Rates update 15

This is my last update of this post for a while. My first post on Mortality Rates was on 27 February. At that time there was 4,051 cases of Coronavirus outside of China and only 66 deaths outside of China. It is here:

Mortality Rates of the Coronavirus by Country

I am looking at shifting away from Coronavirus posts and focusing more time on defense affairs and analysis of military history.

The number of cases continue to increase,  as sadly are the number of deaths, and so is the mortality rate. In countries that previously had low mortality rates, like Germany, they have now risen to above 1% and keep rising. Germany is now at 3.31%. Now there still some people arguing that the actual mortality rate from Coronavirus is around 0.5%. There was an article recently that looked at antibody testing of Coronavirus, and discovered that 15% of the population in one German town had the virus, even though only 2% were reported as having the virus. The article is here: https://spectator.us/covid-antibody-test-german-town-shows-15-percent-infection-rate/

Now….this was a random sample of 1,000 residents, so it could just be wrong (90% confidence does mean that the data is wrong 10% of the time). And of course, it is one small town in one nation.  It does produce an infection mortality rate of 0.37%.

China continues to report very few new cases. I gather they are starting to relax their restrictions. What will happen now? If the virus is truly defeated and contained, then this should not be an issue. China has had 83,853 cases of which 77,799 recovered and 4,636 have died. If these figures are correct, this means that there are only 1,418 active cases left in China. In contrast, the United States has staggering 788,110 cases with only 73,533 recovered and a depressing 42,458 deaths. We are now 32% of the world’s reported cases and 25% of the world’s reported deaths. We are 4% of the world’s population.


Country……….Cases…..…Deaths….…Rate

World Wide……2,499,723….171,718…..…6.87%

United States…….788,110……42,458…..…5.39%

Spain………..……204,178……21,282……10.42%

Italy………..….…..181,228……24,114..….13.31%

France………….…156,493……20,265……12.95%

Germany…….……147,103….…4,869…..….3.31%

United Kingdom….125,856……16,509…….13.12%

Turkey…….……..…90,980….….2,140……..2.35%

Iran………………….84,802……..5,297…..…6.25%

China.………………83,853……..4,636.…….5.54%

Russia…….……..…52,763…….…456….….0.86%

Belgium….………….40,956……..5,998……14.64%

Brazil…………………40,814….….2,588…..…6.34%

Canada………………37,933……..1,753……..4.62%

Netherlands.……..…34,317……..3,916……11.41%

Switzerland…………28,063……..1,436……..5.12%

Portugal.…..…….….21,379…….….762.….…3.56%

India…………………18,985……..…603.……..3.18%

Peru………….………16,325……..…445.……..2.73%

Ireland………….……15,652……..…687.……..4.39%

Sweden…..…….……15,322………1,765…….11.52%

Austria………………14,873…………491………3.30%

Israel…….……….…13,883…….…..181………1.31%

Saudi Arabia……….11,631…………109……….0.94%

Japan……………….11,135…..……..263.….…..2.36%

S. Korea……….…..10,683…………237…..…..2.22%


A few other entities of interest to this author that have less than a ten thousand cases so far:

Pakistan…………….…9,216……..…192……….2.08%

Singapore…..…………9,125…………11……..…0.12%

Mexico…………………8,772…..……712……..…8.12%

Denmark..….…………7,891………..370…….…4.69%

Norway……………..…7,191..………182…….…2.53%

Indonesia….……..……7,135…….….616………..8.63%

Czechia…………………6,914…..…….196…….…2.83%

Australia………..……..6,547..……..….67….……1.02%

Ukraine…………………6,125…..…….161……..…2.63%

Egypt…………..….…..3,333…….……250…..……7.50%

Hungary……………….2,098……..….213……….10.15%

Bahrain……….……….1,952………….…7…….…..0.36%

Iceland…………..……1,778……………10…………0.56%

Iraq…..…………….…..1,574..…..…….82…..…..…5.21%

New Zealand…………1,445…………..13…………0.90%

Hong Kong….….…….1,029……….…4………..…0.39%

Afghanistan……………1,092….…..…..36………….3.30%

Andorra……….…….……717.…..……..37……..….5.16%

Lebanon……..…….….…677..…………21……..….3.10%

San Marino………………476……..……40………….8.40%

Palestine…..……………..461…..……..…4………….0.87%

Taiwan………………..…425………….…6….………1.41%

Vietnam….………..….…268………….…0………….0%

North Korea..………….…..0……..…..…0…….….…0%

Syria……….………….……..0……..……..0……….…0%

Yemen………………………..1……..……..0…..…..…0%

Libya……….………..……….0………..…..0………..…0%

Diamond Princess…….….712……………11……..….1.54%


There has been a ceasefire in Yemen because of the Coronavirus.


Data is from Johns Hopkins CSSE 4/21/20 as of 9:38.33 AM EST. It is here: Johns Hopkins CSSE

A few more observations:

  1. The actual mortality rate is a big issue if one is going to do any estimate of potential impact (population * percent infected * mortality rate and modified by improvements in care and developments of vaccines). I have been thinking about post about this at some point…but…
    1. Do I do an estimate based upon a rate of 0.5%, 1%, 1.5% or 2%? Makes a big difference.
    2. Needless to say, the figure of 0.5% would be better. If one does estimates based upon a 1% mortality rate, the numbers are kind of scary.
  2. Countries with high mortality rate obviously have a lot more cases than they are reporting.

U.S.S. Theodore Roosevelt correction

Testing on the USS Theodore Roosevelt

I stated in the previous post on this subject that “They probably picked up the virus around 9 March while making a port call in Da Nang, Vietnam.” According to this article, this may not be the case: https://news.yahoo.com/navy-believes-delivery-flights-not-205814720.html

According to this article, they might have picked up the virus due to delivery flights made to the carrier, not from Vietnam. The navy officials say they have been unable to make a definitive link between the Vietnam port call and the cases that have occurred on the ship. The Carrier onboard deliveries (COD) flights would have originated from the Philippines or Japan.

Some National Coronavirus Graphs – update 2

Updating my posts for the last two weeks. This basically addresses the question of when is the virus mitigated, or even better when it is contained, and eventually when should restrictions be relaxed. So we look at South Korea compared to the three worst plagued countries in the world. We then look at three other countries in East Asia that were near China and had to deal with the virus sooner than most. We then look at a few other countries that appear to getting the virus under control. I think there is considerable value here in comparing results across several countries. All these are simple graphs pulled from the Johns Hopkins CSSE website as of 10:36:00 AM: Johns Hopkins CSSE

Here is the graph for the number of cases in South Korea (10,613 reported cases):

In comparison, here are the graphs for the United States (640,014 reported cases), Spain (182,816 reported cases) and Italy (165,155 reported cases). It looks like Spain and Italy are reaching their deflection point:

In contrast here are the graphs for three other East Asian nations, Japan, Taiwan and Vietnam. Note that they have fewer reported cases, 8,626, 395, 268 respectively:

And here is China (83,402 reported cases), although there is still some concern about the accuracy of their statistics:

Finally, let me add the Austria (14,451 reported cases), Norway (6,798 reported cases), Australia (6,462 reported cases), the Czech Republic (6,303 reported cases), Singapore (3,614 reported cases), Iceland (1,727 reported cases) and New Zealand (1,401 reported cases) to this collection of graphs as it appears that they are now reaching their inflection point and some have started leveling off:

There are other people publishing similar graphs. For example: https://www.cnn.com/2020/04/16/world/coronavirus-response-lessons-learned-intl/index.html


Coronavirus in the DC area – update 2

As I live and work in Northern Virginia, just a few miles outside of Washington, DC, the local situation is of interest to me, as I suspect it is to a few other readers. Again, all the data is from the Johns Hopkin’s website (which I gather is also maintained in the DC area), as of 7:25:19 AM: Johns Hopkins CSSE

The DC area is rather sprawling, with over 5 million people scattered across DC, Virginia and Maryland. Let me list the presence of virus by location. I list the number of cases from the post two weeks ago, last week’s post followed by the number of cases this week. Population is the 2018 estimate from Wikipedia:

……………………………………………Previous..Last……..New

………………………..….Population….Week……Week…..Cases……….Deaths

Washington D.C…………..702,445……..507…….1,211……2,058………..67

Arlington, VA…………..…..237,521…….104…….….237…..….401………….2

Alexandria VA………….…160,530……….30…..…..126………..247………….1

Fairfax County, VA……..1,150,795……..244………532….…1,207………..20

Falls Church, VA……..…….14,772……………………………………….2

Fairfax City, VA……..………24,574………………………………………1

Loudoun County, VA………406,850………87….…..209…..…344……………5

Prince Williams C., VA….…468,011…..….94….…..236……..508……………1

Manassas…………………….41,641……………………………………49

Manassas Park………….…..17,307……………………………………13

Stafford Country, VA………149,960…..….24….…….49…………95

Fredericksburg, VA…….…..29,144…..……1………….8…………14

Montgomery C., MD……1,052,567……..447…..…..871……1,883………..54

Prince Georges C., MD….909,308……..403……..1,020…….2,356……….72

Total……….…….……5,365,425..…1,941…….4,499…..9,178……..222


The number of cases appears to be doubling at every locale each week. This is not a good trend. Do not know if that is because of more spreading or better testing. There were 23 deaths recorded the week before last, last week it was 76, now it is 222.

The Mortality Rate for the area is 2.42% up from 1.69% last week and 1.18% the previous week. The population known to be infect is 0.17%. or one confirmed case for every 585 people. From my observations, most people are doing a reasonable job of self isolating. Probably easier to do in this more spread out suburban area than in some cities. They do say that this area will become one of the next hotspots, but because it is spread out and primarily suburban, I don’t think it will be anything like New York. Still, right now, the number of cases are doubling each week.

The Washington DC statistic area according to some also includes Warren, Clarke, Fauquier, and Spotsylvania Counties in Virginia, Jefferson County in West Virginia, Frederick, Howard, Charles and Calvert Counties in Maryland. I rarely go to these places. But of interest to me is Albemarle County, VA with 50 confirmed cases and Charlottesville, VA which has 36 confirmed cases and 1 death. Montgomery County, VA has 33 cases.

Reality sets in for Russia

Sorry, but another coronavirus post. This is a follow-up to our post a month ago:

What about the Coronavirus and Russia?

Needless to way, with over 21,000 cases now reported in Russia and over 170 deaths (which are probably under-reported), Russia is very much part of the pandemic now. Chart of number of cases as of 4/14/20:

A couple of related articles:

Putin’ Bleak COVID-19 Admission: “We Don’t Have Much to Brag About”

Putin says Russia may need the army to help battle coronavirus

Testing on the USS Theodore Roosevelt

150322-N-ZF573-140 ATLANTIC OCEAN (March 22, 2015) Aircraft from Carrier Air Wing 1 fly in formation over the Nimitz-class aircraft carrier USS Theodore Roosevelt (CVN 71) during an airpower demonstration March 22, 2015. Theodore Roosevelt, homeported in Norfolk, is conducting naval operations in the U.S. 6th Fleet area of operations in support of U.S. national security interests in Europe. (U.S. Navy photo by Mass Communication Specialist 2nd Class Chris Brown/Released)

There were 4,800 crew on the ship. Of those, 92 percent were tested, with 550 positive and 3,673 negative as of 11 April. On 12 April it was reported that 585 crew members had tested positive. So far there has been one death (April 13).

This would be an infection rate of around 12% to 15% and a mortality rate of 0.17%, so far.

They probably picked up the virus around 9 March while making a port call in Da Nang, Vietnam. The first sailor tested positive on 22 March, and 3 sailors tested positive by 24 March. On 30 March Captain Brett Crozier sent out the email that got him fired. On 31 March, over 100 sailors had been tested positive.

See:

https://www.yahoo.com/news/more-10-us-carriers-crew-test-positive-virus-014817533.html

https://www.politico.com/news/2020/04/13/sailor-uss-roosevelt-dies-coronavirus-183164

https://en.wikipedia.org/wiki/2020_coronavirus_pandemic_on_USS_Theodore_Roosevelt_(CVN-71)

Coronavirus Mortality Rates update 14

My plan for now is to keep updating this post every Tuesday. This may be my second to last update as these do take some time. It is the especially annoying with the slow creaky internet that has developed from everyone “working” at home. My time may be better spent on defense affairs and analysis of military history.

The number of cases continue to increase dramatically, as sadly are the number of deaths, and of significance, so is the mortality rate. In countries that previously had low mortality rates, like Germany, they have now risen to above 1% and keep rising. Germany is now at 2.47%. Now there still some people arguing that the actual mortality rate from Coronavirus is around 0.5%. There was an article recently that looked at antibody testing of Coronavirus, and discovered that 15% of the population in one German town had the virus, even though only 2% were reported as having the virus. The article is here: https://spectator.us/covid-antibody-test-german-town-shows-15-percent-infection-rate/

Now….this was a random sample of 1,000  residents, so it could just be wrong (90% confidence does mean that the date is wrong 10% of the time). And of course, it is one small town in one nation.  It does produce an infection mortality rate of 0.37%.

China continues to report very few new cases. I gather they are starting to relax their restrictions. What will happen now? If the virus is truly defeated and contained, then this should not be an issue. This was not the experience they had in Hong Kong. China has had 83,306 cases of which 78,195 recovered and 3,345 deaths. This is 588 more cases and 10 more deaths than last week. In contrast, the United States has 582,634 cases with only 44,319 recovered and a depressing 23,654 deaths. We are now 30% of the world’s reported cases.


Country……….Cases…..…Deaths….…Rate

World Wide……1,942,360….121,726…..…6.27%

United States…….582,634……23,654…..…4.06%

Spain………..……172,541……18,056……10.46%

Italy………..….…..159,516……20,465..….12.83%

France………….…137,877……14,967……10.86%

Germany…….……130,383……3,220…..….2.47%

United Kingdom……94,823…..12,107…….12.77%

China.………………83,306……..3,335.…….4.00%

Iran…………………74,877……..4,683………6.25%

Turkey…….……..…61,049……..1,296……..2.12%

Belgium….………….31,119……..4,157……13.36%

Netherlands.…….…27,580……..2,945……10.68%

Switzerland…………25,913……..1,162……..4.48%

Canada………………25,680……….823……..3.20%

Brazil…………………23,955….….1,361….…5.68%

Russia…….……..…21,102…….…170….….0.81%

Portugal.…..…….….17,448…….…567.….…3.25%

Austria……………..14,159………..384………2.71%

Israel…….……….…11,868………..117………0.98%

Sweden…..…….…..11,445………1,033………9.03%

Ireland………….……10,647……..…365.……..3.43%

S. Korea……….…..10,564…………222….…..2.10%

India…………………10,541……..…358.…..….3.40%


A few other entities of interest to this author that have less than a ten thousand cases so far:


Japan…………………7,645…..…..143.….…..1.87%

Denmark..….…………6,691……….299…….…4.47%

Norway…………….…6,691..………139…….…2.08%

Australia………..……..6,494..……….61….……0.94%

Pakistan…………….…5,837……..….96……….1.64%

Saudi Arabia………….5,369………….73………….1.36%

Mexico…………………5,014…..…..332……..…6.62%

Indonesia….……..…….4,839……….459……..….9.49%

Ukraine……………..…3,372…..…….98……..…2.91%

Singapore…..…………3,252…………10……..…0.31%

Egypt…………..….…..2,190…..…..164…..……7.49%

Iceland…………..……1,711…….……8……..…0.47%

Bahrain……….……….1,522……….…7…….…..0.46%

Hungary……………….1,512……….122……..…8.07%

Iraq…..………………..1,378..……….78…..……5.66%

New Zealand…………1,366……….…9……..…0.66%

Hong Kong….….…….1,012……….…4……..…0.39%

Afghanistan…………..…714….…..…23………….3.22%

Andorra……….…….……646.…..……29……..….4.49%

Lebanon……..…….….…641..…..……21……..….3.28%

Taiwan………………..…393……….…6….………1.53%

San Marino…………….…371…….….32………….8.63%

Palestine…..……………..308…..…..…2……..….0.65%

Vietnam….………..….…266……….…0……..….0%

North Korea..…………..0……..…..…0…..….…0%

Syria……….……..……..0……..……..0…..….…0%

Yemen…………….……..0……..……..0….…..…0%

Libya……….…………….0………..…..0….…..…0%

Diamond Princess….712……………11……..….1.54%


There has been a ceasefire in Yemen because of the Coronavirus.


Data is from Johns Hopkins CSSE 4/14/20 as of 10:41.26 AM EST. It is here: Johns Hopkins CSSE

A few more observations:

  1. The actual mortality rate is a big issue if one is going to do any estimate of potential impact (population * percent infected * mortality rate and modified by improvements in care and developments of vaccines). I have been thinking about post about this at some point…but…
    1. Do I do an estimate based upon a rate of 0.5%, 1%, 1.5% or 2%? Makes a big difference.
    2. Needless to say, the figure of 0.5% would be better. If one does estimates based upon a 1% mortality rate, the numbers are kind of scary.
  2. Countries with high mortality rate obviously have a lot more cases than they are reporting.

Some National Coronavirus Graphs – update 1

Just an update on my post last week on this subject:

Here is the graph for the number of cases in South Korea (as of 9:36;11 AM)

In comparison, here is the United States, Spain and Italy:

In contrast here are three other East Asian nations, Japan, Taiwan and Vietnam:


And here is China, although there is still some concern about the accuracy of their statistics:

Finally, let me add the Austrian graph to this as it appears that they are now reaching their inflection point and may start leveling off:

The daily increase for Austria is here: