Mystics & Statistics

A blog on quantitative historical analysis hosted by The Dupuy Institute

Richthofen and Dessloch

Dessloch in 1944

In June 1943 Otto Dessloch took over command of the Fourth Air Fleet from Wolfram von Richthofen. Richthofen went off to command the Second Air Fleet in Italy. Although it was supposed to be temporary command, Dessloch remained in command of the Fourth Air Fleet until the middle of 1944.

Dessloch later became infamous for having conducted a retaliatory bombing of Paris in September 1944, after the allies had taken it over. He passed away in Munich in 1977.

Now, I have two dates as to when he took command of the Fourth Air Fleet, either 11 June or 13 June. Right now, I don’t have any solid confirmation for either date, although Wikipedia uses the 11 June date. Does anyone has some clear documentation that establishes what date he took command?

Coronavirus in the DC area – update 8

As I live and work in Northern Virginia, just a few miles outside of Washington, DC, the local situation is of interest to me, as I suspect it is to a few other readers. I will be maintaining these updates on Wednesdays for a while. Again, all the data is from the Johns Hopkin’s website (which I gather is also maintained in the DC area), as of 11:32:33 AM: Johns Hopkins CSSE

The DC area is rather sprawling, with over 5 million people scattered across DC, Virginia and Maryland. Let me list the presence of virus by location. I list the number of cases from last week followed by the number of cases this week and then the current number of reported deaths. Population is the 2018 estimate from Wikipedia:

……………………….….Population…last week…this week.…Deaths

Washington D.C…………..702,445…..7,551………8,406…..….445

Arlington, VA…………..…..237,521…..1,728………1,988………109

Alexandria VA………….…160,530……1,577………1,824………..42

Fairfax County, VA……..1,150,795……8,163…….10,069………364

Falls Church, VA……..…….14,772………..44………….53………….8

Fairfax City, VA……..………24,574…….…47……..……59…………4

Loudoun County, VA………406,850……1,579………2,274………..53

Prince Williams C., VA….…468,011……4,054……..5,074……..…99

Manassas…………………….41,641…..…699…………966………..10

Manassas Park………….…..17,307………207…………280…….…..6

Stafford Country, VA………149,960………514…………657…….….4

Fredericksburg, VA…….…..29,144…….…101…………136…….….0

Montgomery C., MD….…1,052,567….…9,052……..10,467……..572

Prince Georges C., MD….909,308…….12,446………14,100…….520

Total……….…….…….…5,365,425……47,762………56,353…..2,236


The number of cases was doubling at every locale each week for the first three weeks I was tracking this. The rate of decreased, but primarily because the denominator got large. So it went to 58% increase, then 50%, then 39%, then 27% and last week only increased by 24%. This week the increase was only 18% but the actual number of cases went up 8,591. It has been in the that range for a while (9,301 new cases last week, 8,200 new cases the week before that and 8,547 new cases three weeks ago). This is still not under control.

The Mortality Rate for the area is 3.97%, which is high. It either means lots of vulnerable people, or the number of cases of infection are being significantly underreported. The population known to be infected is 1.05%. or one confirmed case for every 95 people. It may be that over 2% of the area has been infected.

The governor of Virginia (who is actually a medical doctor) extended the shut-down in Northern Virginia until 29 May. Certainly still needed and suspect he will need to extend it further. He gave a list of locales that were under that order, and it included every place mentioned above except Fredericksburg.

The Washington DC statistic area according to some also includes Warren, Clarke, Fauquier, and Spotsylvania Counties in Virginia, Jefferson County in West Virginia, Frederick, Howard, Charles and Calvert Counties in Maryland. I rarely go to these places and they were not listed in the Governor of Virginia’s order extending the lock-down in Northern Virginia. Of interest to me is Albemarle County, VA with 168 confirmed cases (142 last week) and 8 deaths, and Charlottesville, VA which has 97 confirmed cases (72 last week) and 3 deaths. Montgomery County, VA is unchanged with 70 cases this week (66 last week) and 1 death. Of course, who know what will happen if you bring in tens of thousands of students in the fall. These two areas are the home of UVA and Virginia Tech, two large universities located in a more rural environment. They are in the part of Virginia where restrictions have been relaxed.

Coronavirus in the DC area – update 7

As I live and work in Northern Virginia, just a few miles outside of Washington, DC, the local situation is of interest to me, as I suspect it is to a few other readers. I will be maintaining these updates on Wednesdays for a while. Again, all the data is from the Johns Hopkin’s website (which I gather is also maintained in the DC area), as of 3:32:46 PM: Johns Hopkins CSSE

The DC area is rather sprawling, with over 5 million people scattered across DC, Virginia and Maryland. Let me list the presence of virus by location. I list the number of cases from last week followed by the number of cases this week and then the current number of reported deaths. Population is the 2018 estimate from Wikipedia:

……………………….….Population…last week…this week.…Deaths

Washington D.C…………..702,445…..6,584………7,551……….407

Arlington, VA…………..…..237,521…..1,416………1,728…….….81

Alexandria VA………….…160,530……1,240………1,577…….…34

Fairfax County, VA……..1,150,795……6,470……….8,163……..302

Falls Church, VA……..…….14,772………..37…………..44……..….5

Fairfax City, VA……..………24,574……..…40……….…47…………3

Loudoun County, VA………406,850…..1,210………1,579…..…..49

Prince Williams C., VA….…468,011…..3,078………4,054…….…79

Manassas…………………….41,641…..…430…………699…….….6

Manassas Park………….…..17,307…..…139……….…207………..3

Stafford Country, VA………149,960………396………….514……….4

Fredericksburg, VA…….…..29,144…………66………….101……….0

Montgomery C., MD….…1,052,567……..7,283………9,052…….515

Prince Georges C., MD….909,308….…10,072……..12,446…….453

Total……….…….…….…5,365,425…….38,461……..47,762….1,941


The number of cases was doubling at every locale each week for the first three weeks I was tracking this. Four weeks ago it only went up by a little more than half (actually 58%), three week ago went up by half (actually 50%), two weeks ago it went up less than half (actually 39%) and last week it went up only 27%. The week not much progress. the number of cases went up 24%. The actual number of cases went up 9,301, compared to 8,200 new cases last week and 8,547 new cases the week before that. This really is not under control.

The Mortality Rate for the area is 4.06%, which is high. It either means lots of vulnerable people, or the number of cases of infection are being significantly underreported. The population known to be infected is 0.89%. or one confirmed case for every 112 people. It may be that over 2% of the area has been infected.

Last week the governor of Virginia (who is actually a medical doctor) extended the shut-down in Northern Virginia until 29 May. Certainly still needed and suspect he will need to extend it further. He gave a list of locales that were under that order, and it included every place mentioned above except Fredericksburg.

The Washington DC statistic area according to some also includes Warren, Clarke, Fauquier, and Spotsylvania Counties in Virginia, Jefferson County in West Virginia, Frederick, Howard, Charles and Calvert Counties in Maryland. I rarely go to these places and they were not listed in the Governor of Virginia’s order extending the lock-down in Northern Virginia. Of interest to me is Albemarle County, VA with 142 confirmed cases (124 last week) and 4 deaths, and Charlottesville, VA which has 72 confirmed cases (68 last week) and 2 deaths. Montgomery County, VA is unchanged with 66 cases this week (66 last week) and 1 death. Of course, who know what will happen if you bring in tens of thousands of students in the fall. These two areas are the home of UVA and Virginia Tech, two large universities located in a more rural environment.

Coronavirus in the DC area – update 6

As I live and work in Northern Virginia, just a few miles outside of Washington, DC, the local situation is of interest to me, as I suspect it is to a few other readers. I will be maintaining these updates on Wednesdays for a while. Again, all the data is from the Johns Hopkin’s website (which I gather is also maintained in the DC area), as of 10:32:27 AM: Johns Hopkins CSSE

The DC area is rather sprawling, with over 5 million people scattered across DC, Virginia and Maryland. Let me list the presence of virus by location. I list the number of cases from last week followed by the number of cases this week and then the current number of reported deaths. Population is the 2018 estimate from Wikipedia:

……………………….….Population…last week…this week…Deaths

Washington D.C…………..702,445…..5,322….…6,584……….350

Arlington, VA…………..…..237,521…..1,169……1,416…………66

Alexandria VA………….…160,530………983……1,240…………30

Fairfax County, VA……..1,150,795……4,834……6,470……….253

Falls Church, VA……..…….14,772…..…..36…….….37……….….4

Fairfax City, VA……..………24,574………..33….……40……….…3

Loudoun County, VA………406,850….…998…..1,210………….35

Prince Williams C., VA….…468,011…..2,223…..3,078……….…58

Manassas…………………….41,641……..289….…430…………….3

Manassas Park………….…..17,307…..…..96…..…139……………3

Stafford Country, VA………149,960…..…308……..396…………….4

Fredericksburg, VA…….…..29,144……..….45………..66…………..0

Montgomery C., MD….…1,052,567…..…5,790……7,283………422

Prince Georges C., MD….909,308….……8,135….10,072………389

Total……….…….…….…5,365,425….…30,261…..38,461……1,620


The number of cases was doubling at every locale each week for the first three weeks I was tracking this. Thee weeks ago it only went up by a little more than half (actually 58%). Two week ago went up by half (actually 50%) and last week is went up less than half (actually 39%). This week it has gone up only 27%, although this is still over 8,000 new cases. This is not anywhere near zero. So, a positive downward trend, although painfully slow.

The Mortality Rate for the area is 4.21%, which is high. It either means lots of vulnerable people, or the number of cases of infection are being significantly underreported. The population known to be infected is 0.72%. or one confirmed case for every 140 people. It may be that over 2% of the area has been infected.

This week the governor of Virginia (who is actually a medical doctor) extended the shut-down in Northern Virginia until 29 May. Certainly needed. He gave a list of locales that were under that order, and it included every place mentioned above except Fredericksburg. Does this mean I can drive down to Fredericksburg and have a beer?

The Washington DC statistic area according to some also includes Warren, Clarke, Fauquier, and Spotsylvania Counties in Virginia, Jefferson County in West Virginia, Frederick, Howard, Charles and Calvert Counties in Maryland. I rarely go to these places and they were not listed in the Governor of Virginia’s order extending the lock-down in Northern Virginia. Of interest to me is Albemarle County, VA with 124 confirmed cases (110 last week) and 4 deaths, and Charlottesville, VA which has 68 confirmed cases (64 last week) and 2 deaths. Montgomery County, VA has 66 cases (61 last week) and 1 death. These two areas are the home of UVA and Virginia Tech, two large universities located in a more rural environment.

My articles on other blogs

Col. General Wolfram Baron von Richthofen, 1942 (Bundesarchive Bild 101I-452-0985-36)

While there are 783 blog posts that I have made to the Mystics and Statistics blog, I do have seven other articles written on other sites, all in 2015 and 2016.

History News Network

  1. How Military Historians Are Using Quantitative Analysis — And You Can Too
  2. Did the Pentagon Learn from Vietnam?
  3. Did I Just Write the Largest History Book Ever?
  4. Are Russians Really Long-Suffering?
  5. What Are Historians Supposed to Make of Quotes Reported by the Discredited Historian and Holocaust Denier David Irving?

While I was writing this blog post a week ago, I noticed a message from nine months ago on the History New Network to this last article. It was from Dr. Andrew Arthy of Australia. Turns out he has a copy of the Wolfram von Richthofen’s notes from a discussion he had with Generaloberst Jeschonnek on 25 May 1943. So finally got confirmation that this was indeed a valid quote from David Iriving.

Small Wars Journal

  1. Airpower: Just Part of the Counterinsurgency Equation

Aberdeen Book Store

  1. Did I Just Write the Largest History Book Ever?

This is the complete article. The article with the History News Network was abbreviated.

Von Richthofen and David Irving

A few years ago I wrote an article on the History News Network on my decision to quote from David Irving’s work in my book on Kursk. The article is here: https://historynewsnetwork.org/article/163814

This primarily concerned the conference on 4 May 1943 preceding the Battle of Kursk. This conference is described in some depth by Guderian in his book. Guderian’s account has often been accepted uncritically by some writers. The account provided by David Irving, quoted from Wolfram von Richthofen (the cousin of the famous Red Baron), gives a very different picture of the conference. I do not know which account is more correct, but decided to present them both in my book.

Nine months ago, Dr. Andrew Arthy in Australia commented on that article that he had copies of the notes make by Wolfram von Richthofen. I noticed the comment last week, so looked him up, emailed him and he willingly provided a copy of the memo. It came from Freiburg: BA-MA N 671/10. The image above is the copy he sent me.

Jay Karamales (who is not a native German speaker) provided me with the following translation of it:

1.) Operation Citadel: General Model said he wasn’t strong enough and would likely get stuck or would need a lot of time. The Führer was of the opinion that the attack must smash through in the shortest possible time under all circumstances. Colonel General Guderian held out the prospect that within six weeks he would be able to supply sufficient armored forces that this would be guaranteed. The Führer therefore decided to postpone it for six weeks. To confirm this decision from all directions, discussion with FM von Kluge and FM von Manstein. Initially, they agreed to a postponement; however, when they heard that the Führer had already made the decision along these lines, they promoted [preached, publicized] an immediate start to the attack, apparently so as not to be burdened [encumbered? In legalese “belasten” means incriminated] by the postponement themselves.

Chief of the General Staff has doubts as to whether Guderian’s promises can be kept, above all because a larger number of Tiger deliveries are expected, but it appears that their chassis construction is not in order.

The Chief of Luftflotte 4 takes the position that postponement was wrong under all circumstances. The Russians can (and do) deploy more defense systems in six weeks than we can attack weapons. The attack will go slowly if we wait to start it in mid-June. [If we launch it] At the beginning of May we might not get to Kursk in the scheduled time of 48 hours, but certainly within 4 days. The Russian had defensive structures only on the fronts and not as deep as now. The Russian forces were still in the process of freshening up and realigning, while the Russian is now strong and ready. Our own troops (army corps and divisions) had total confidence and absolute success. This has definitely been undermined by all the back and forth and the waiting [delays]. The postponement gives the Russian the opportunity to take the initiative, even if this is not likely. In any case, it is impossible to predict how the postponement of the operation and its probably much slower progress will affect the plan [intentions] in the northern part of the Eastern Front.

David Irving’s translation (and he does his own translation), from his book Hitler’s War, reads:

[On 27 April] General Model declared he was not strong enough and would probably get bogged down or take too long. The Fuehrer took the view that the attack must be punched through without fail in shortest time possible. [Early in May.] General Guderian offered to furnish enough tank units within six weeks to guarantee this. The Fuehrer thus decided on a postponement of six weeks. To get the blessing of all sides on this decision, he called a conference [on 4 May] with Field Marshals von Kluge and von Manstein. At first they agreed on a postponement; but when they heard that the Fuehrer had already made his mind up to that effect, they spoke out for an immediate opening of the attack—apparently in order to avoid the odium of being blamed for the postponement themselves.


Annoying Disclaimer (that I probably should not need to make): The fact that I have referenced David Irving’s work in an area where he correctly quoted someone does not mean that I agree with or in any way support other claims or work that he has done.

P.S. Dr. Andrew Arthy is currently working on: https://airwarpublications.com/air-war-courland-writing-begun/

P.P.S. Another translation of the same passage is provided in Christer Bergstrom’s newly released Black Cross, Red Star, Volume 5 book, page 181. It reads:

They initially agreed to a postponement; however, when they heard that the Fuhrer had already made a decision in this sense, they propagated an immediate commencement of the attack, apparently so as not to be burdened by the shift themselves.”

Some National Coronavirus Graphs – update 4

This updated post addresses the question of when is the virus mitigated, or even better when it is contained, and eventually when should restrictions be relaxed. So we look at South Korea compared to the seven worst plagued countries in the world (see post from yesterday on the “big seven”). We then look at three other countries in East Asia that were near China and had to deal with the virus sooner than most. We then look at a few other countries that appear to getting the virus under control. I think there is considerable value here in comparing results across several countries. All these are simple graphs pulled from the Johns Hopkins CSSE website as of 12:32:33 AM: Johns Hopkins CSSE

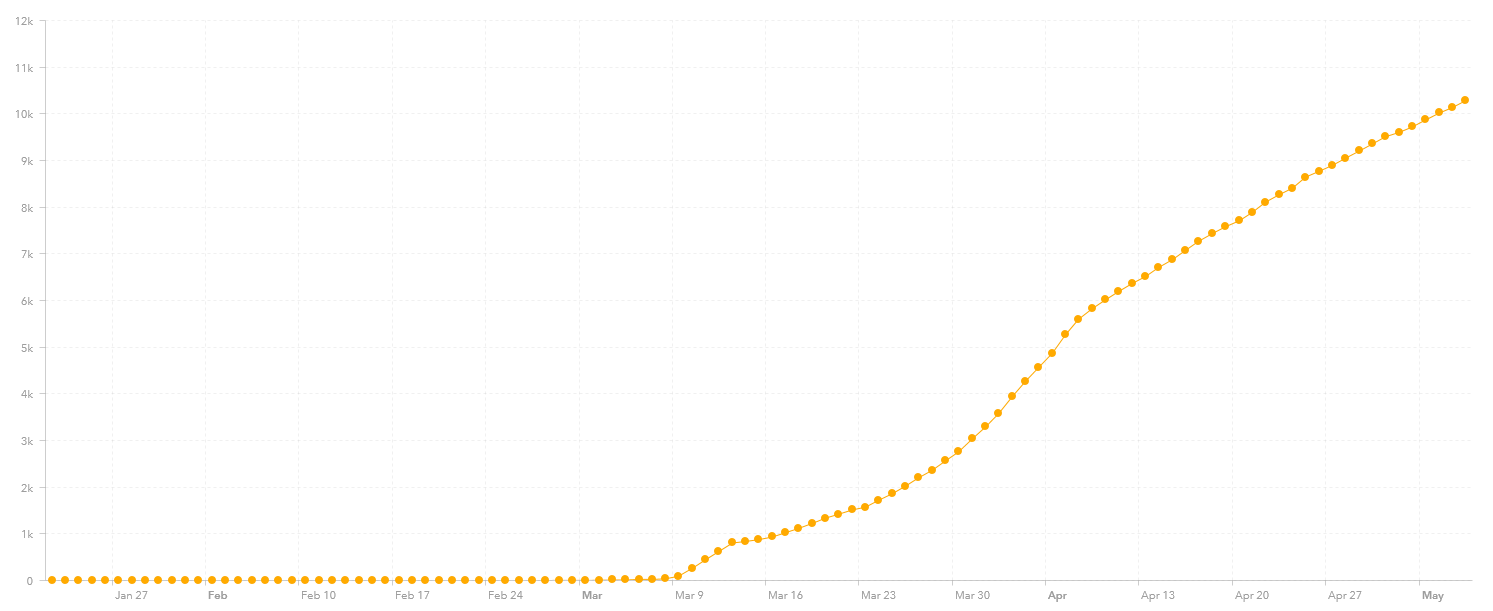
Here is the graph for the number of cases in South Korea, population 52 million. They have 10,822 reported cases, only 120 more cases than reported around this same time two weeks ago. This is clearly what controlling the virus looks like. They have had a total of 256 deaths, for a mortality rate of 2.37%

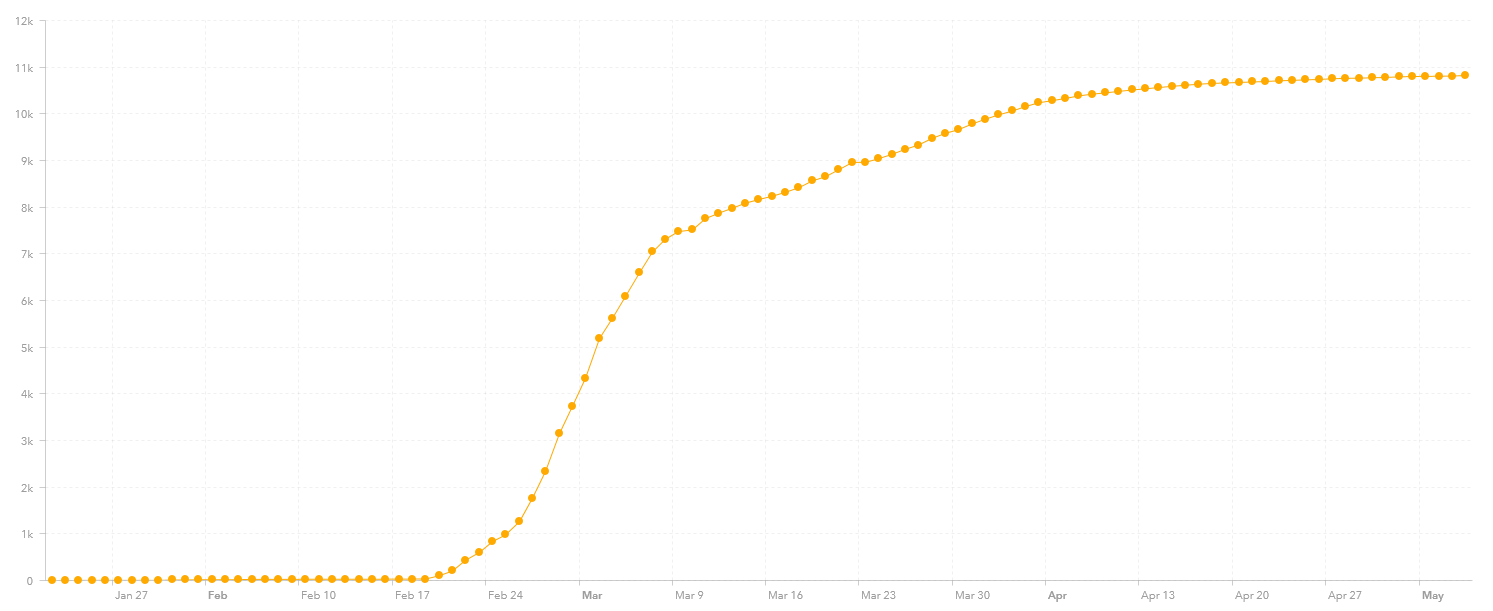
This is good. This looks like a country that now has the situation under control. Note how long it took (time is on the x-axis).

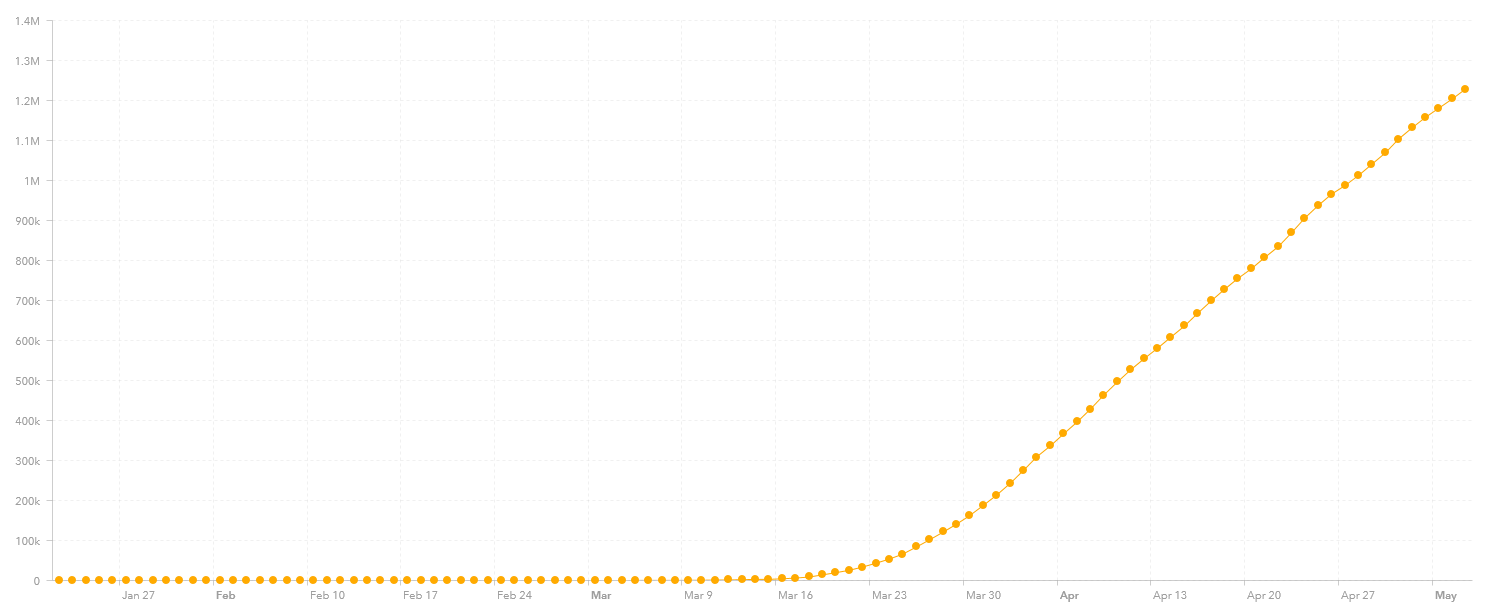
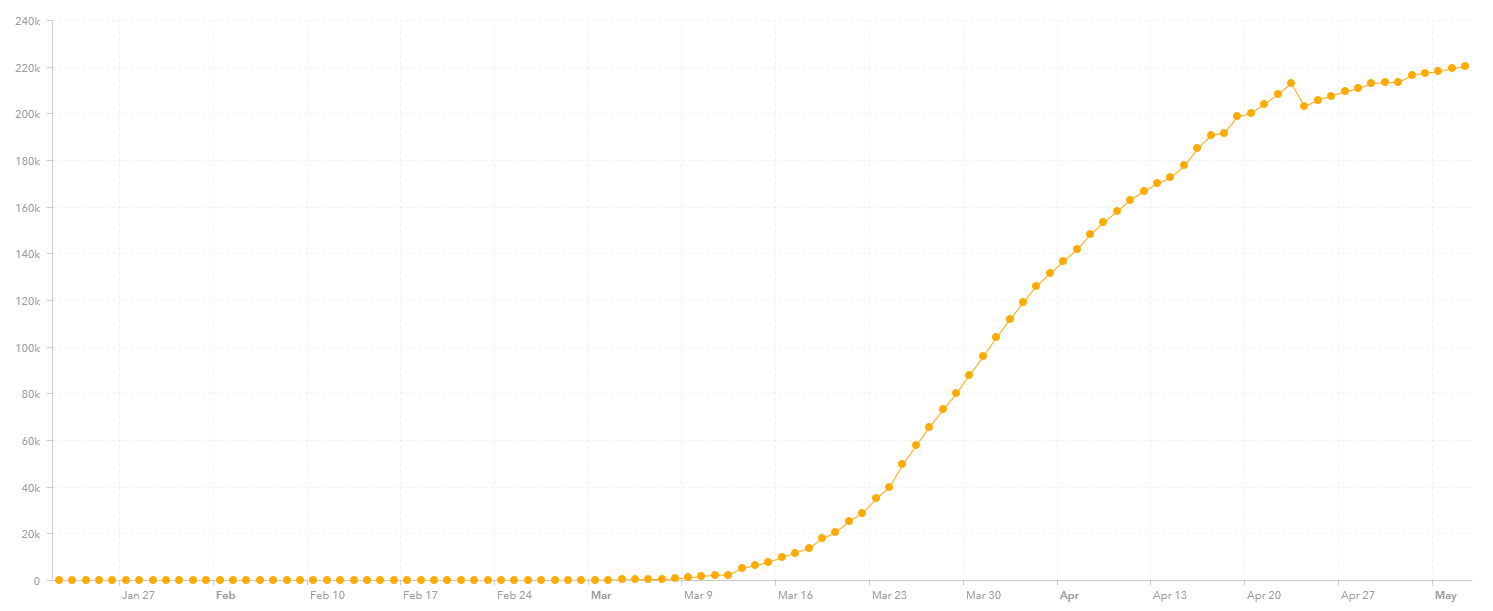
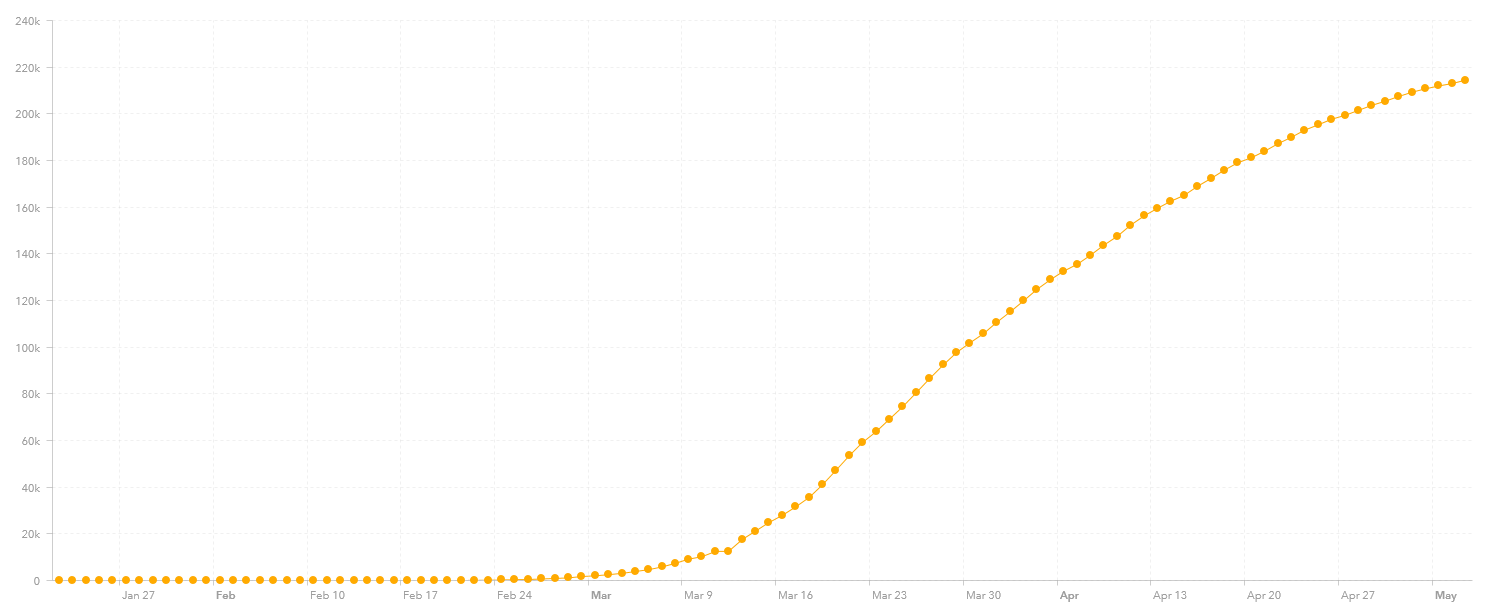
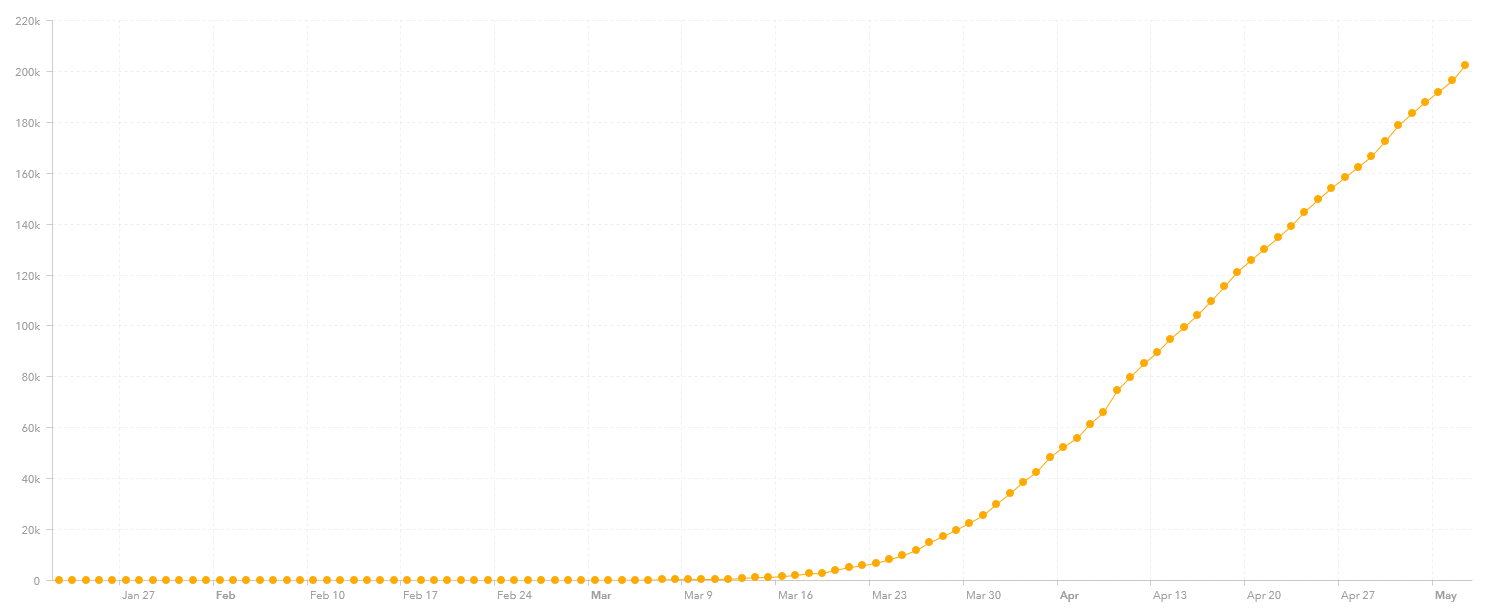
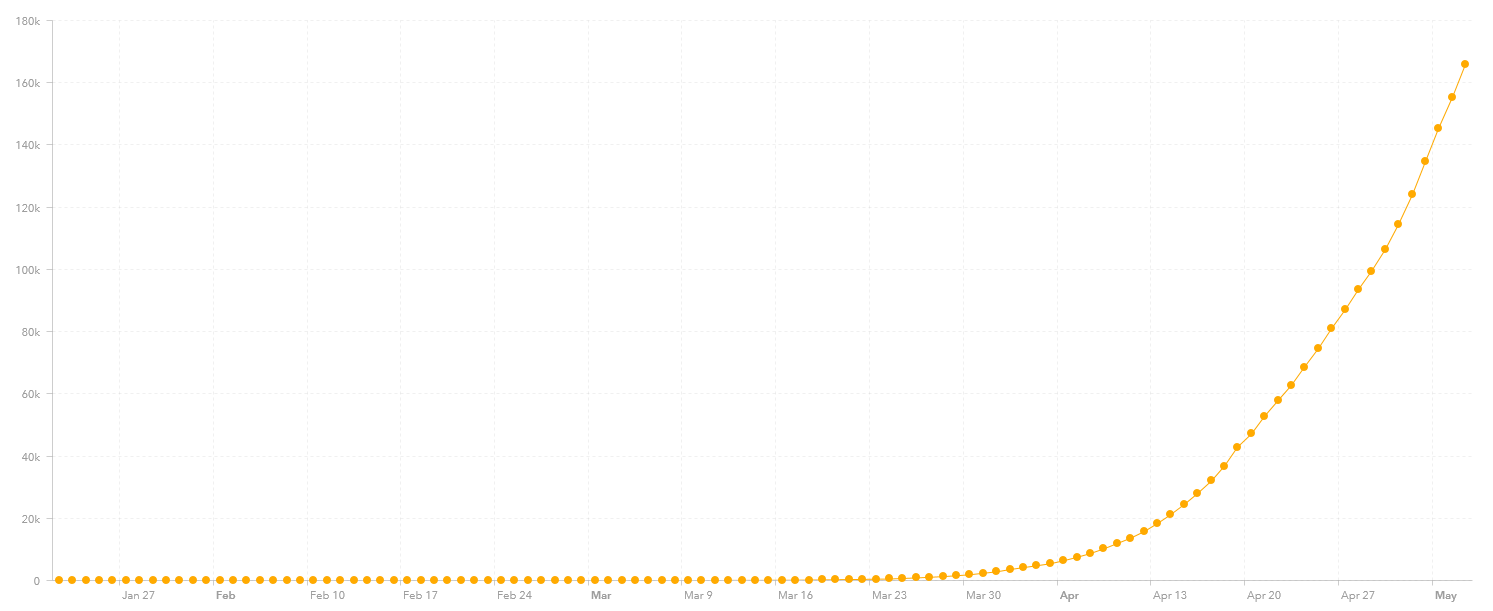
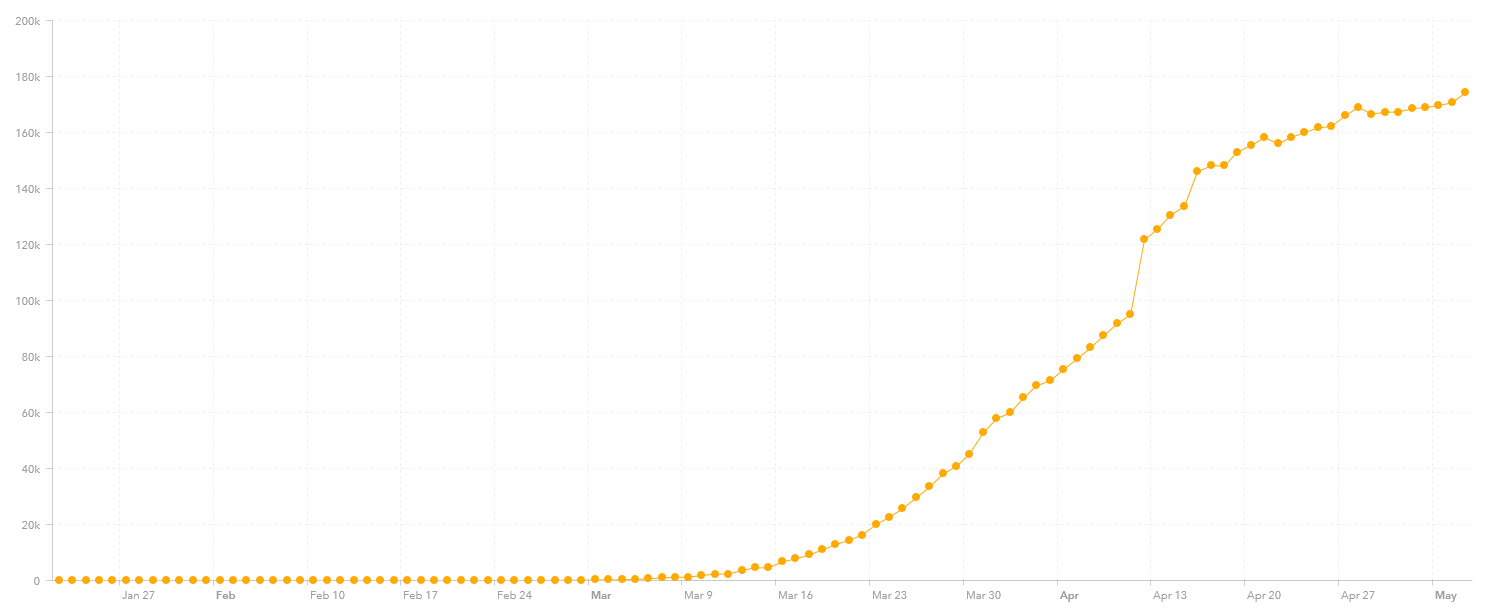
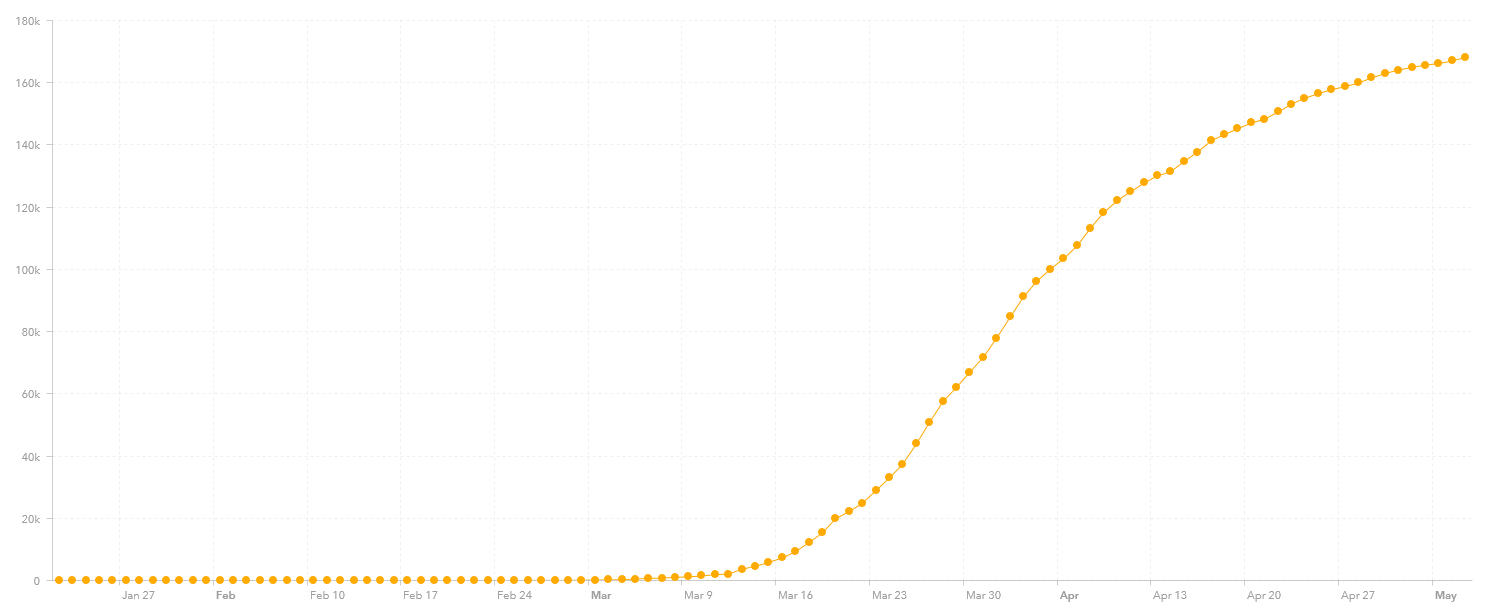
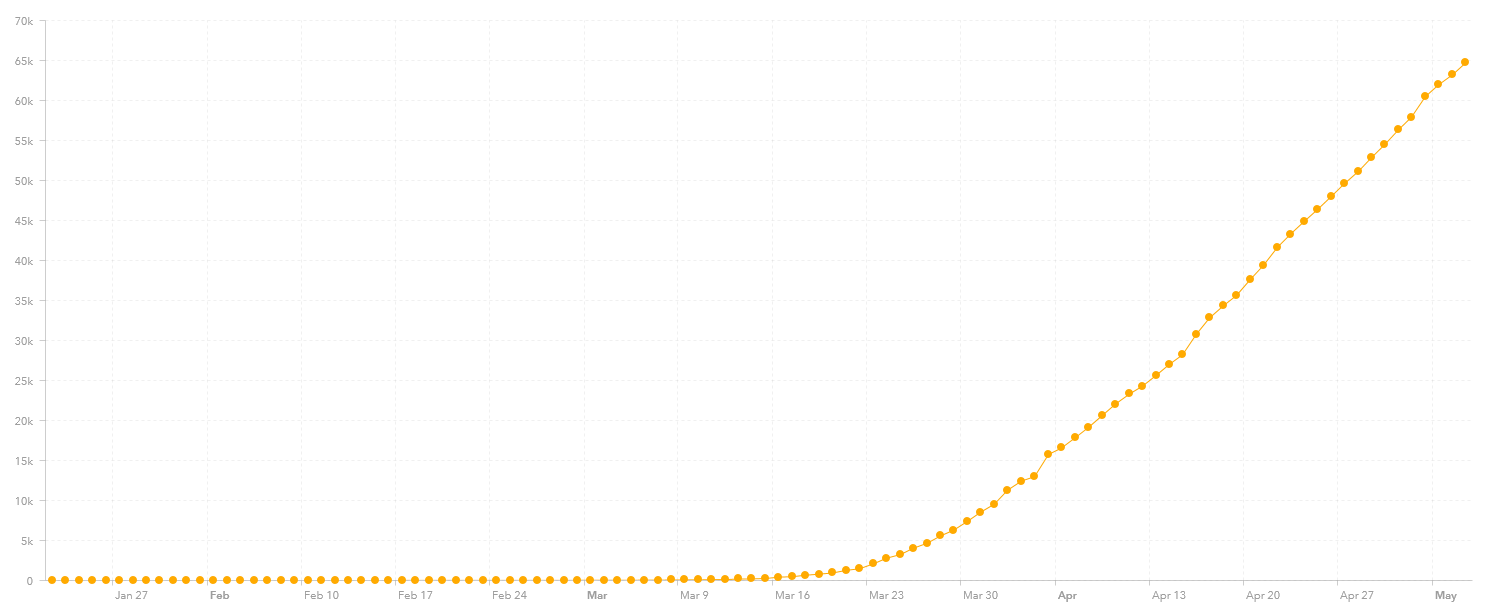
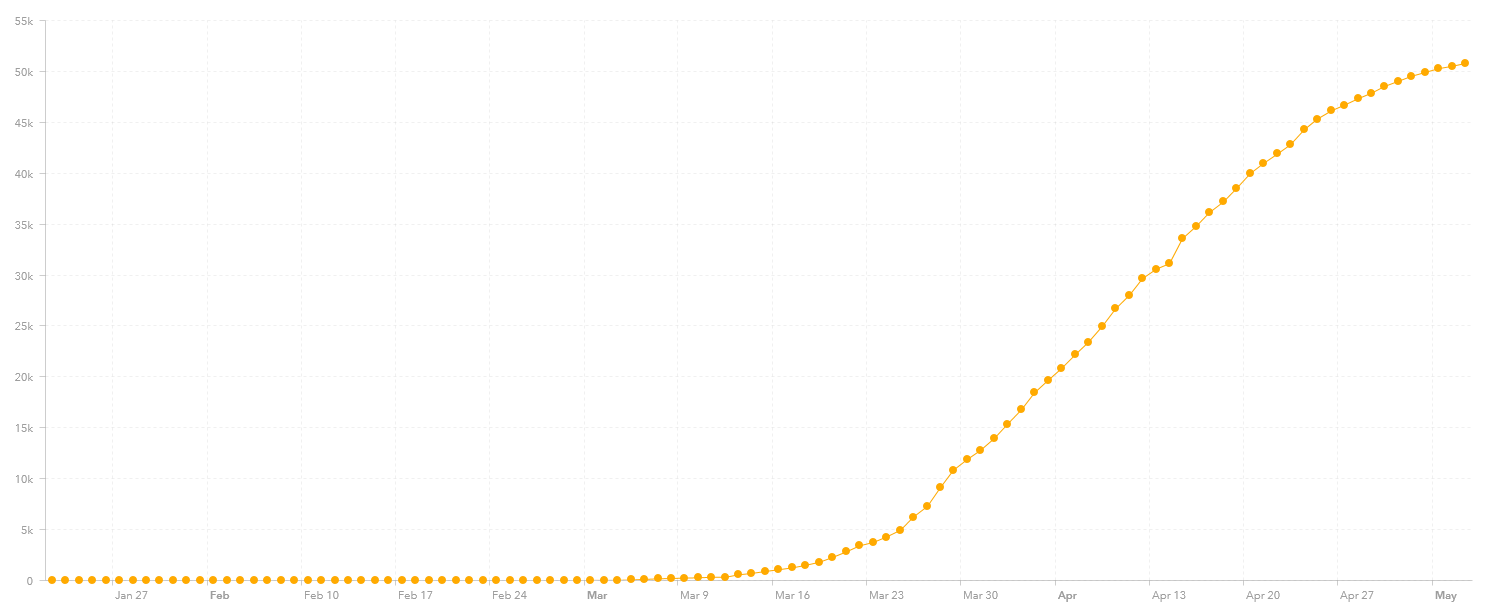
In comparison, are the United States (1,263,052 reported cases), Spain (221,447 reported cases), Italy (217,185 reported cases), United Kingdom (212,626 reported cases), Russia (187,859 reported cases), France (174,918 reported cases) and Germany (169,430 reported cases). It looks like Spain, Italy, France and Germany are reaching their deflection point. The United States, United Kingdom and Russia clearly have not. The graphs from yesterday are in this post:

Coronavirus and the big seven

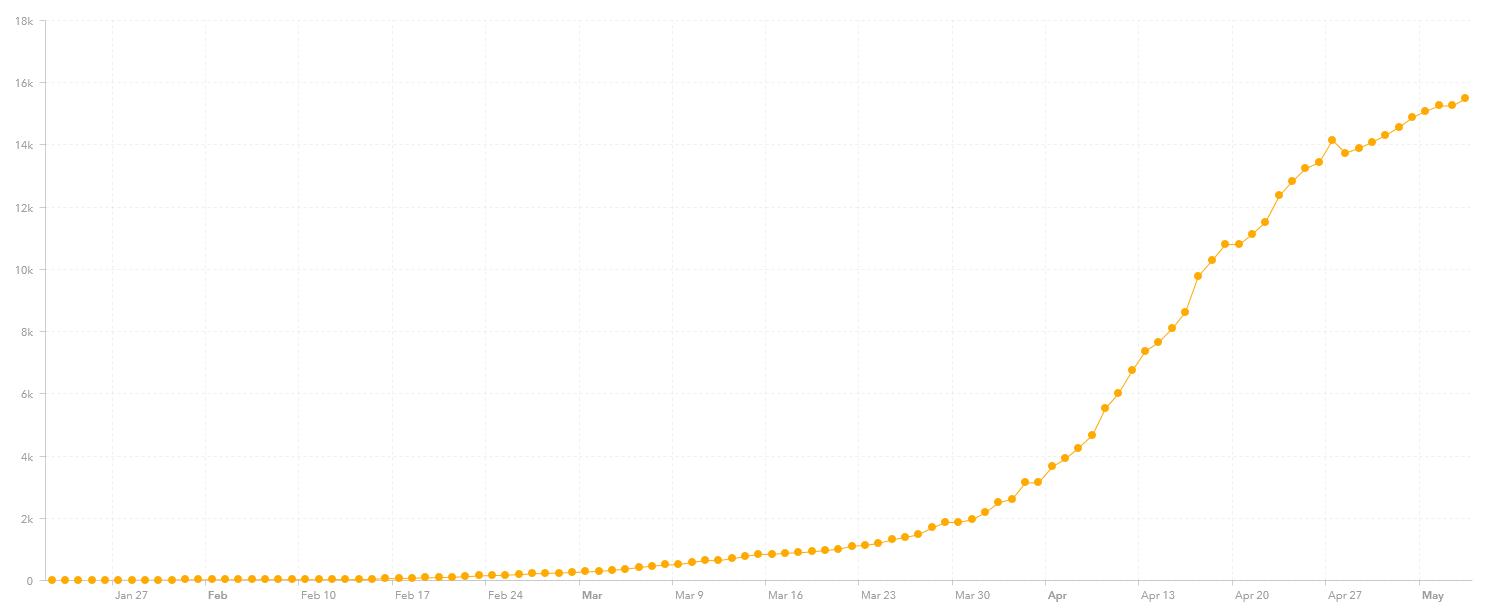
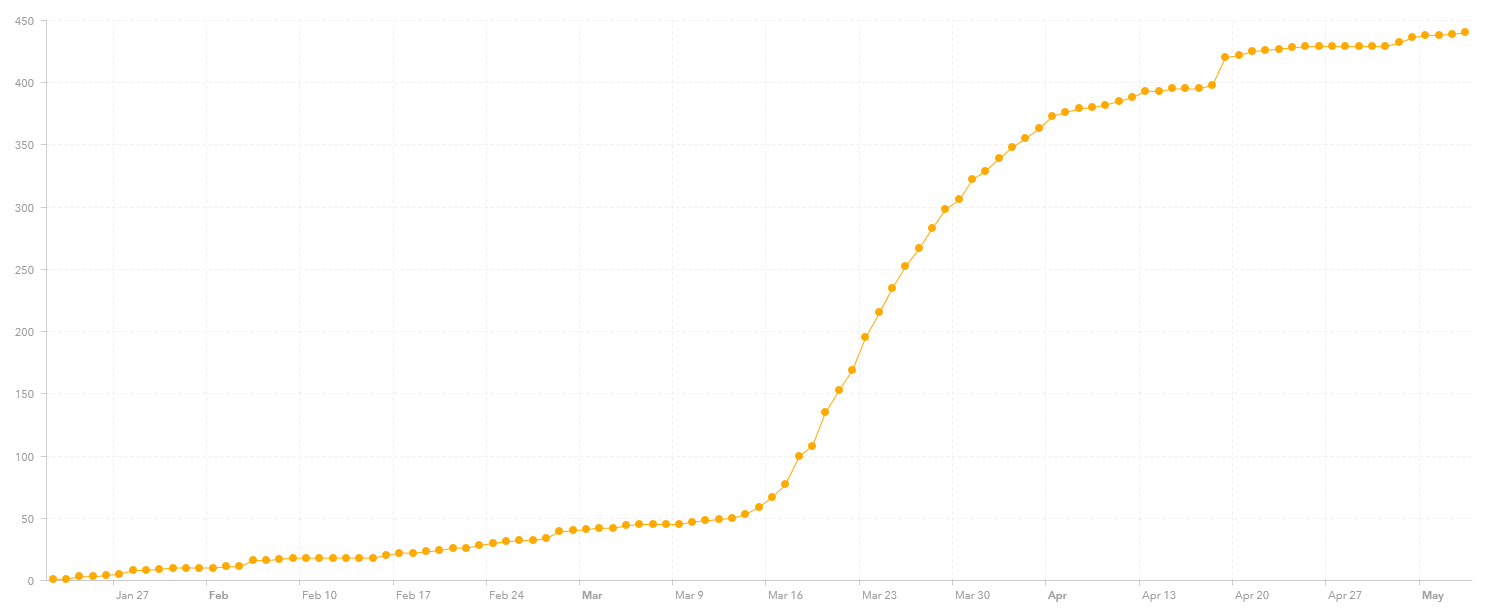
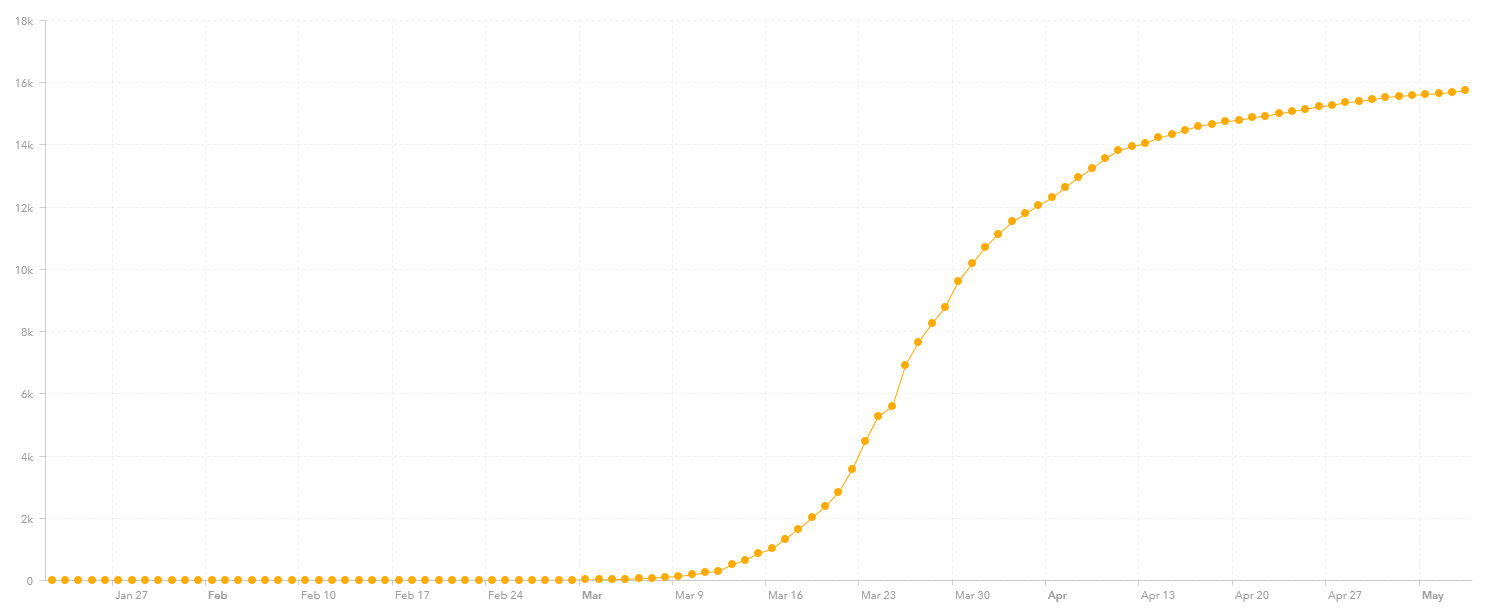
In contrast here are the graphs for three other East Asian nations, Japan (15,477 cases and 577 deaths), Taiwan (440 cases and 6 deaths) and Vietnam (288 cases and no reported deaths). Not sure why Japan does not have the virus under control like South Korea does. This would be worth looking into.

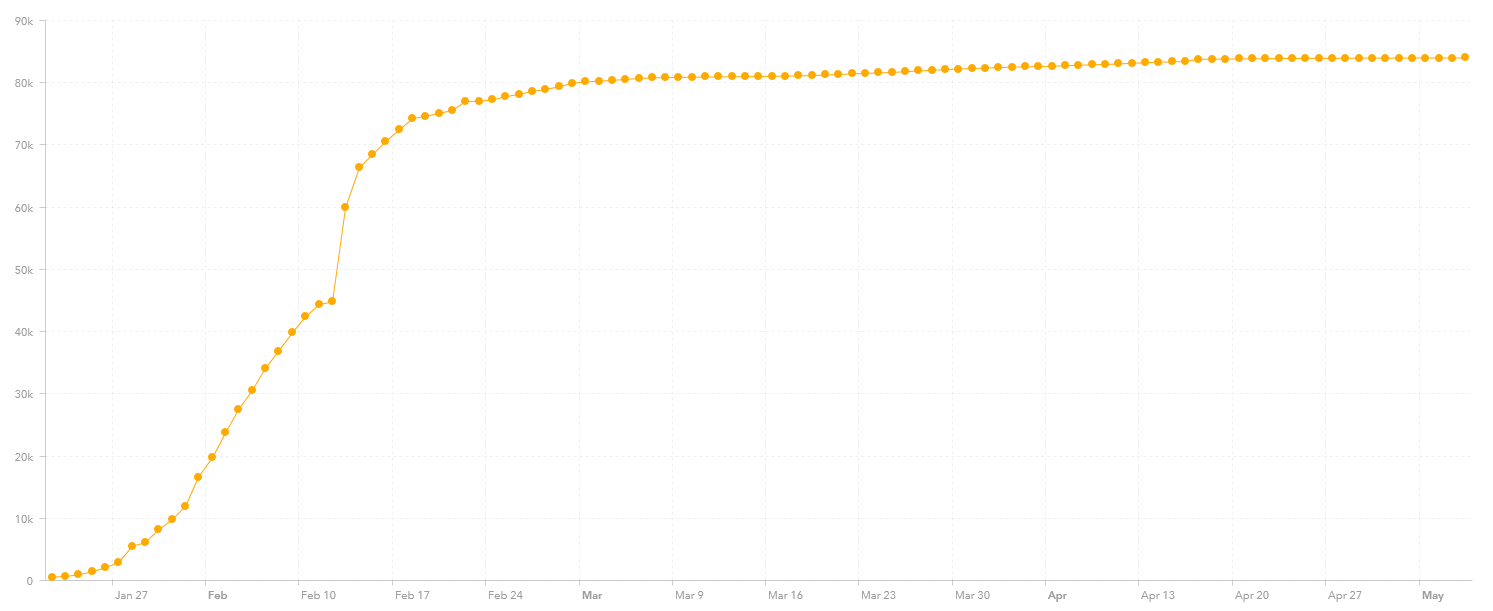
And here is China (83,976 reported cases and 4,637 reported deaths), although there is still some concern about the accuracy of their statistics:

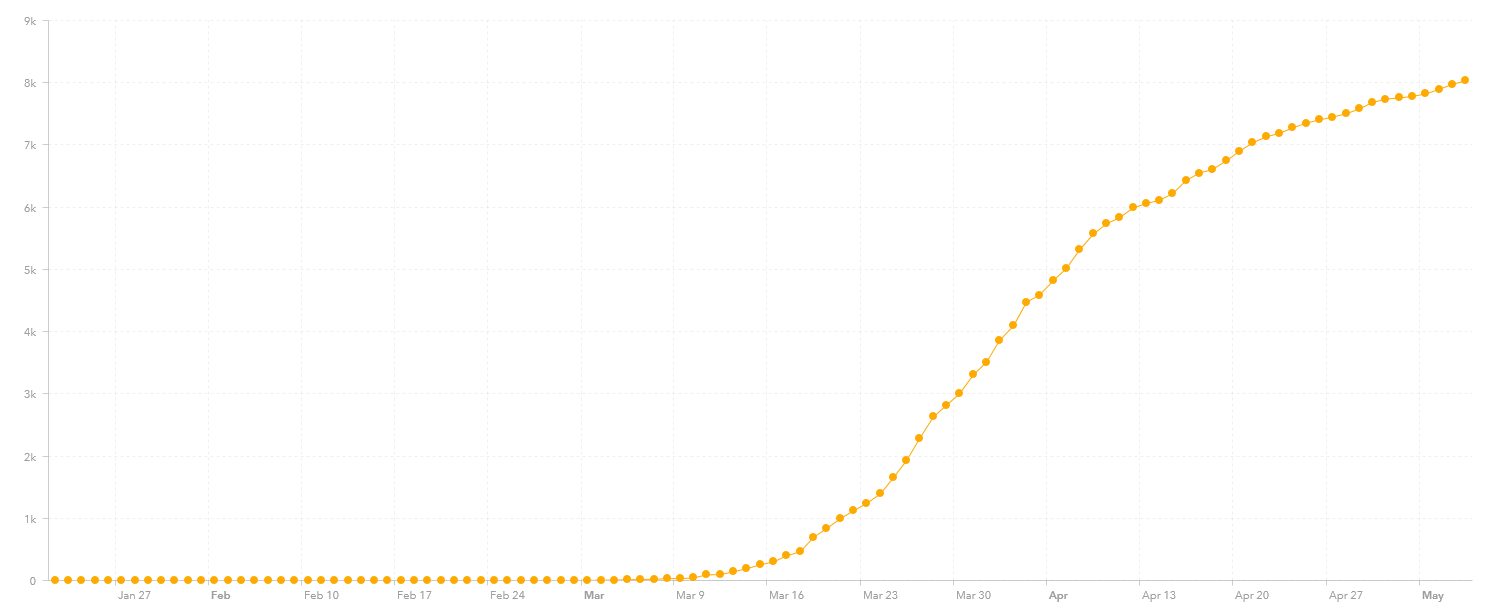
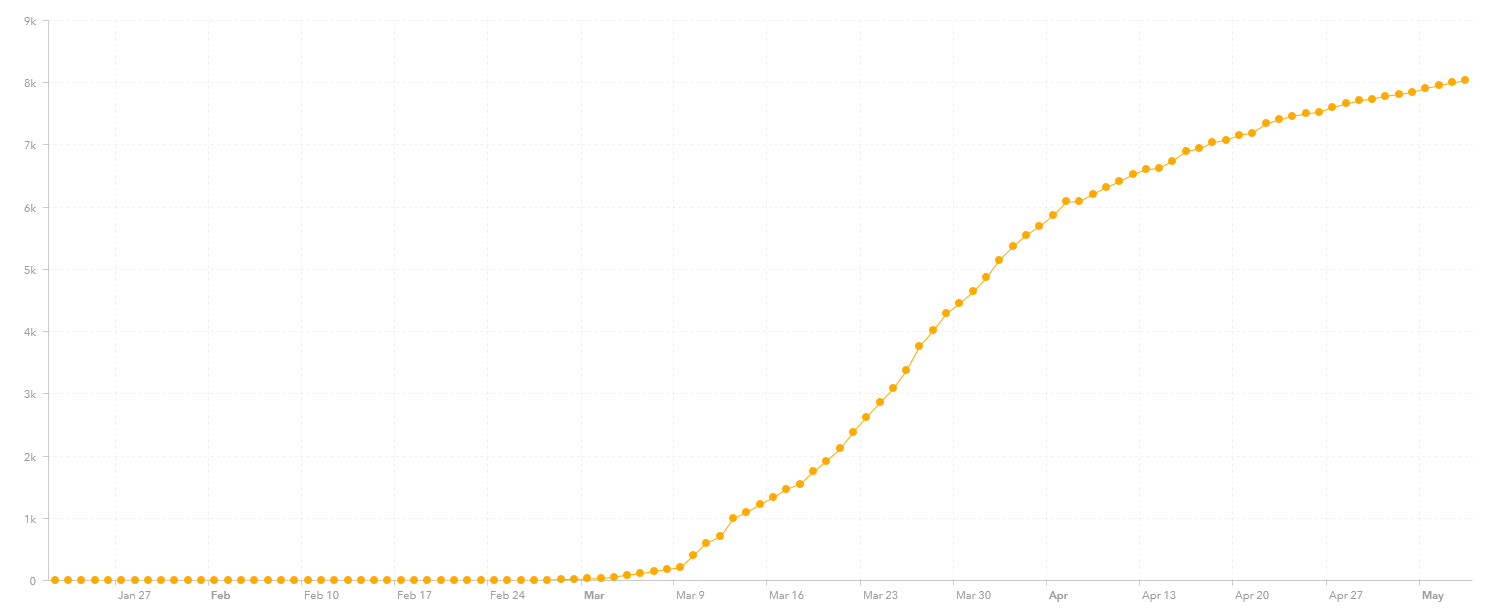
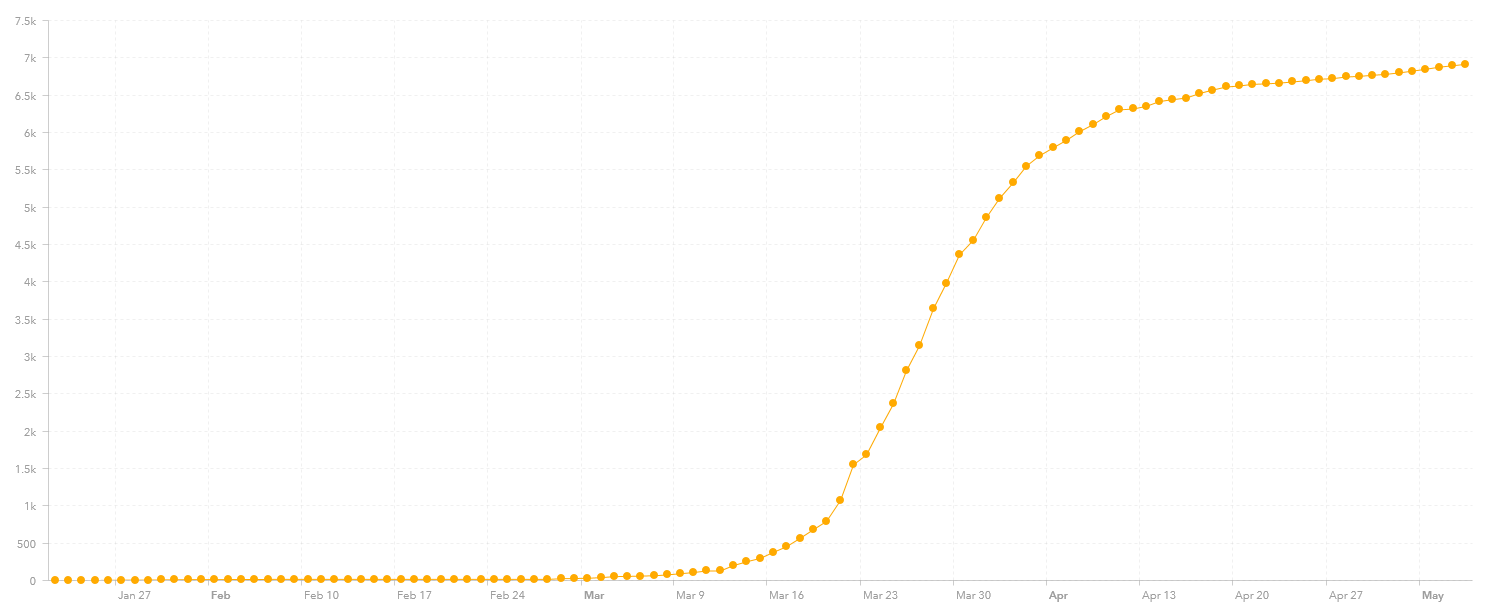
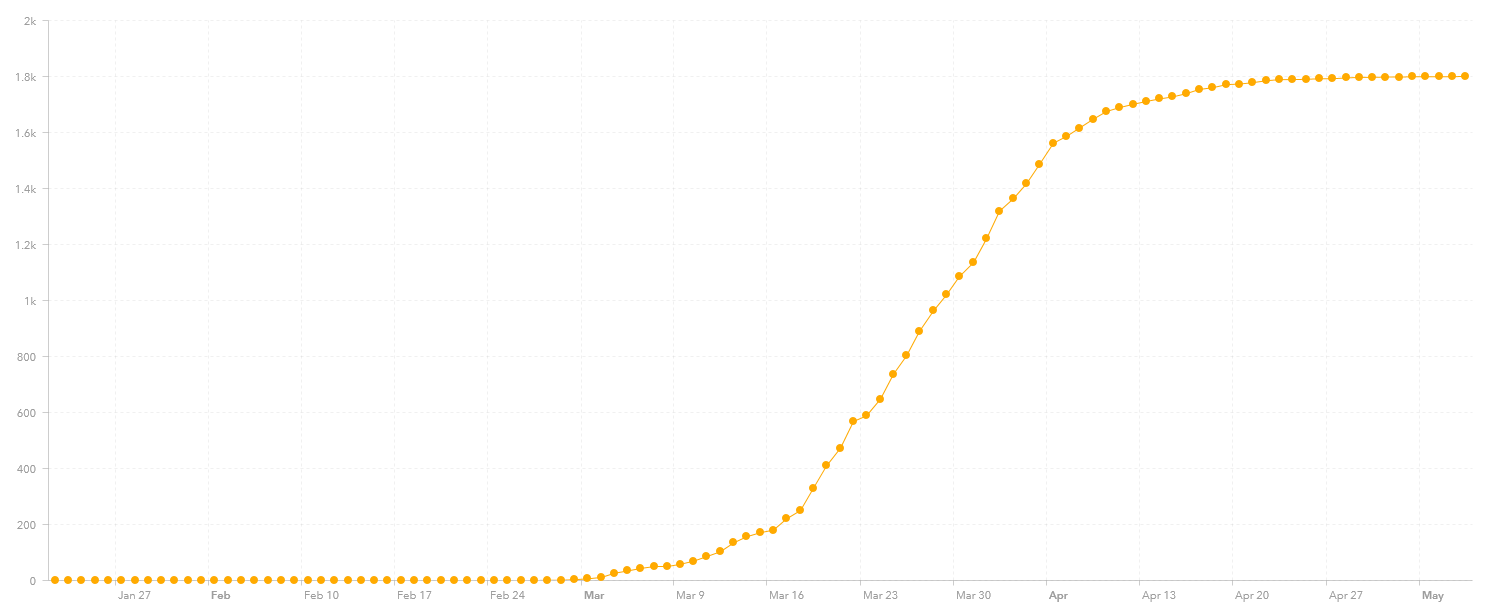
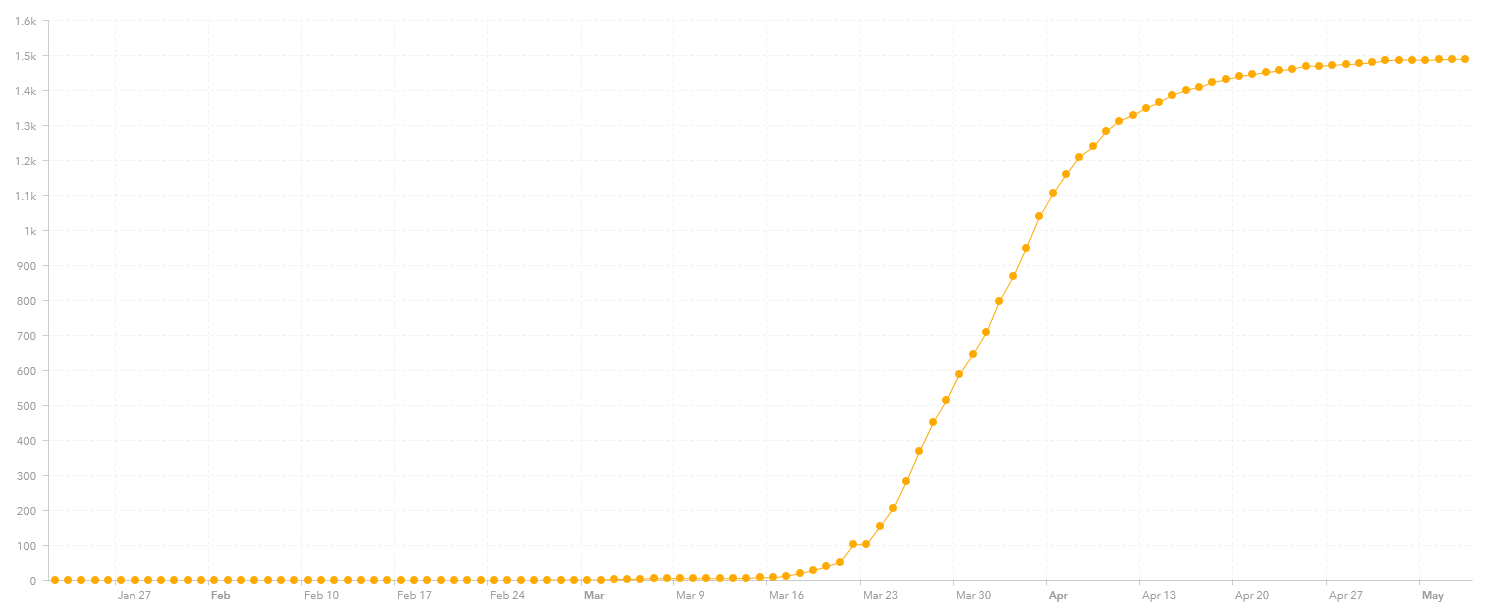
Finally, let me add to this collection of graphs Austria (15,774 reported cases and 614 deaths), Denmark (10,416 reported case and 522 deaths), Czech Republic (8,065 reported cases and 271 deaths), Norway (8,055 reported cases and 218 deaths), Australia (6,914 reported cases and 97 reported deaths), Iceland (1,801 reported cases, only 16 new cases in the last two week), and New Zealand (1,490 reported cases, only 39 new cases since last week, and 21 deaths). It appears that they are now reaching their inflection point and some have started leveling off. I gather New Zealand is now reporting no new cases.


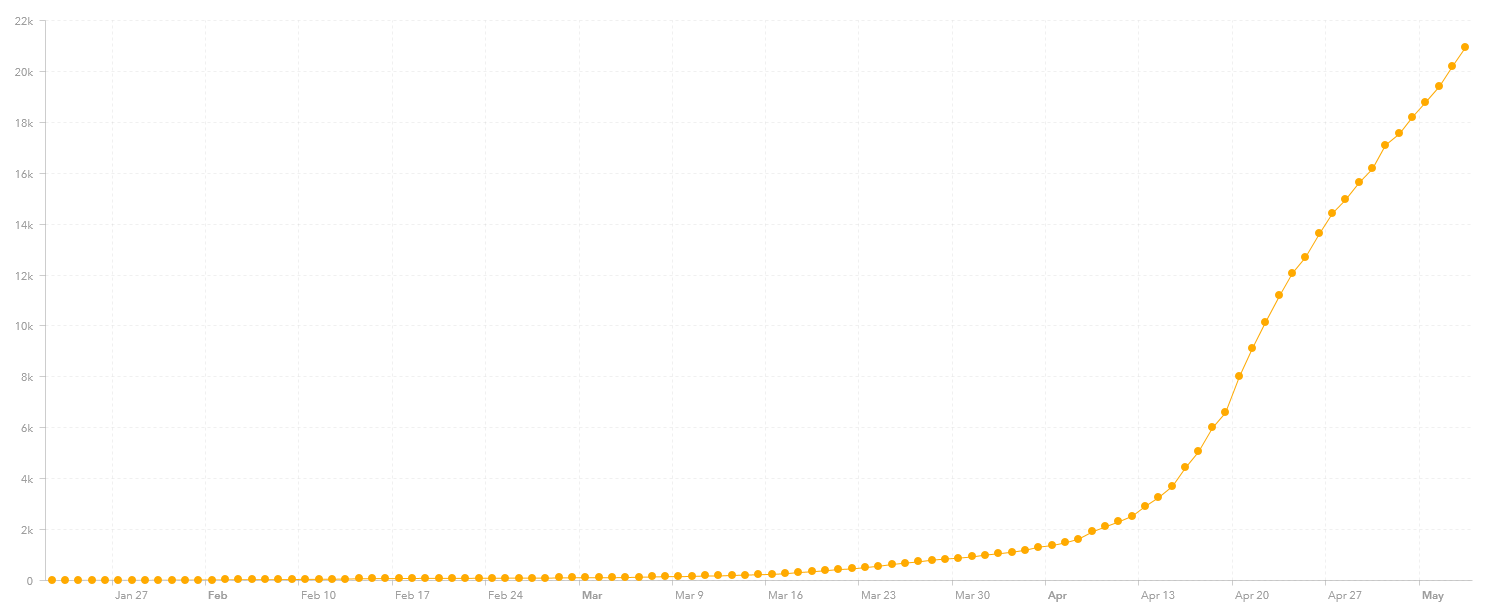
And then there is Singapore. Three weeks ago it had 3,614 reported cases. Two weeks ago it had 11,178 reported cases. Now it has 21,707 reported cases and 20 reported deaths. It appears that they have lost control of the situation again.

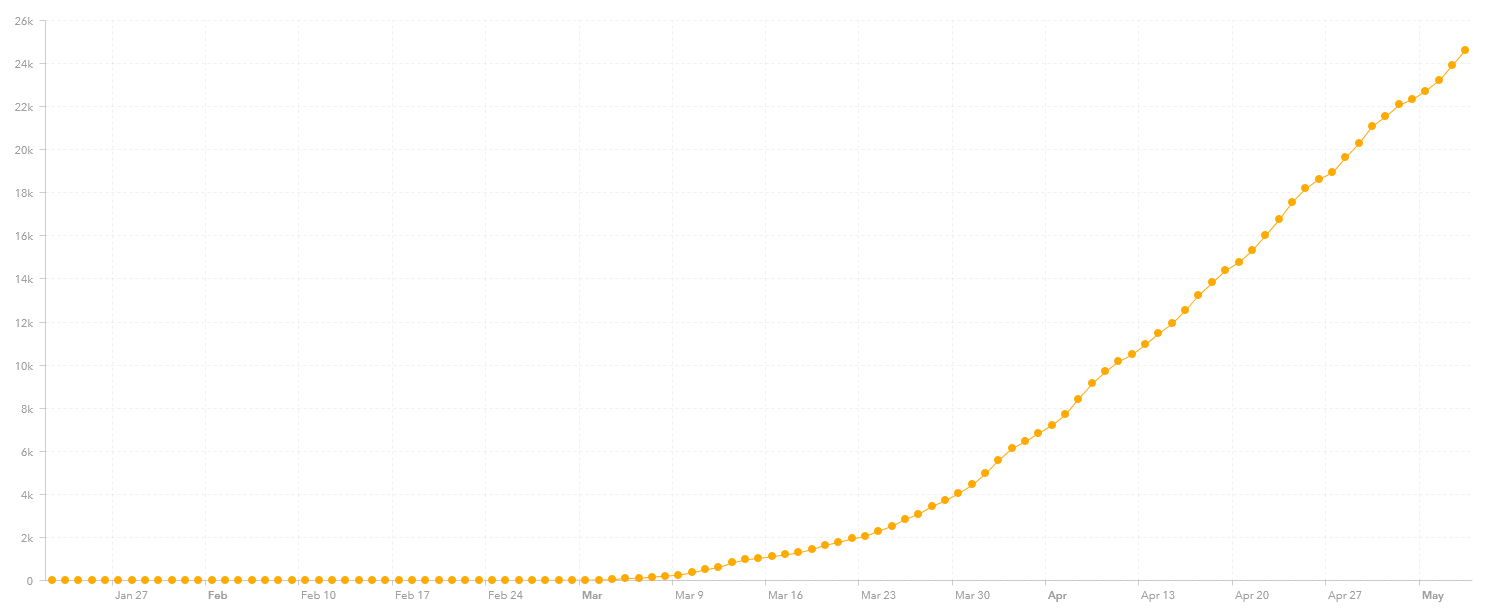
And then there is Sweden, which I gather did not do any lockdown procedures. They have 25,265 reported cases and 3,175 deaths. Compare their graph and their stats to their neighbors Denmark and Norway.


Coronavirus and the big seven

Not quite done blogging about the Coronavirus yet, as it is not quite done with us…yet.

The seven countries with the highest number of reported cases is the United States and six European Countries. These account for five of the ten richest countries in the world. They are shown below in order of number of cases (as of 9:33:26):

First is the United States (population 330 million) with 1,229K cases and over 73K deaths. This graph is of the number of cases over time, as are the rest.

Next is Spain (47 million) with 220K cases and 26K deaths.

Third on the list is Italy (60 million) with 214K cases and almost 30K deaths.

Fourth on the list is the United Kingdom (68 million) with 202K cases and over 30K deaths. The UK has clearly boggled their response worse than any other country on this listing, with the highest numbers of cases per capita and deaths per capita. This is from an island nation that had warning after Italy and Spain were struck with the virus.

Fifth is Russia (147 million) with 177K cases but only 1,625 deaths. This last figure is may be questionable. Right now their mortality rate is 0.92%.

Sixth is France (67 million) with 174K cases and 26K deaths.

Then there is Germany (83 million) with 168K cases and only 7,277 deaths. This is a morality rate of 4.33%, which is still high. Germany has certainly does the best job of all these countries in containing the virus. This is a country that is densely populated and mostly land borders. Their death figures are probably underreported due to their definitions of what constitutes a death due to coronavirus as opposed to other causes.

Also of note, are three other “western” countries: Canada, Netherlands and Belgium:

Canada (38 million) has 65K cases and only 4,366 deaths. Compared to the United States, it has 13% of the population, 5% of the cases and 6% of the deaths. Basically per capita, it infection and mortality rate is half compared to the United. U.S. mortality rate is 5.97%, strongly indicated that there are a lot more cases out there than we have not tested for. Canada’s mortality rate 6.75%, which means that they appear to have the same problem.

There is Belgium (11.5 million) with 51K cases and 8,415 deaths. This is more deaths than reported for Germany and the highest number of deaths per capita among these ten countries. Part of the reason may be again reporting, with Belgium claiming to be very “honest” in their reporting. In the end, people are going to have to look at “excess deaths” since the beginning of this year to get a proper feel of what the real comparative death counts are.

Finally, there is the Netherlands (17.5 million) has 42K case and 5,305 deaths.

It does appear like Spain, Italy, France, Germany, Belgium and Holland are bringing the virus under control. Clearly the United States, United Kingdom, Russia and Canada have not.


Coronavirus in the DC area – update 5

As I live and work in Northern Virginia, just a few miles outside of Washington, DC, the local situation is of interest to me, as I suspect it is to a few other readers. I will be maintaining these updates on Wednesdays for a while. Again, all the data is from the Johns Hopkin’s website (which I gather is also maintained in the DC area), as of 11:32:28 AM: Johns Hopkins CSSE

The DC area is rather sprawling, with over 5 million people scattered across DC, Virginia and Maryland. Let me list the presence of virus by location. I list the number of cases from last week followed by the number of cases this week and then the current number of reported deaths. Population is the 2018 estimate from Wikipedia:

……………………….….Population…last week…this week…Deaths

Washington D.C…………..702,445…..4,106……5,322….…..264

Arlington, VA…………..…..237,521….…912……1,169………..49

Alexandria VA………….…160,530………653………983…….…26

Fairfax County, VA……..1,150,795……3,448……4,834………201

Falls Church, VA……..…….14,772……….26………..36………….4

Fairfax City, VA……..………24,574……….27……….33…………2

Loudoun County, VA………406,850……..727………998……….24

Prince Williams C., VA….…468,011……1,449……2,223………33

Manassas…………………….41,641……..175………289……….1

Manassas Park………….…..17,307………..53……….96…….….2

Stafford Country, VA………149,960………221………308………..2

Fredericksburg, VA…….…..29,144……..….27……….45………..0

Montgomery C., MD….…1,052,567….…4,152……5,790..….333

Prince Georges C., MD….909,308………5,738……8,135…….311

Total……….…….…….…5,365,425……21,714…..30,261….1,252


The number of cases was doubling at every locale each week for the first three weeks I was tracking this. Week before last it only went by a little more than half (actually 58%). Last week it went up by half (actually 50%) and this week is went up less than half (actually 39%). So, a positive downward trend. although painfully slow.

The Mortality Rate for the area is 4.14%, which is high. It either means lots of vulnerable people, or the number of cases of infection are being significantly underreported. The population known to be infected is 0.56%. or one confirmed case for every 177 people. It may be that around 2% of the area has been infected.

From my observations, most people are doing a reasonable job of self isolating. Probably easier to do in this more spread out suburban area than in some cities. They do say that this area will become one of the next hotspots, but because it is spread out and primarily suburban, I don’t think it will be anything like New York. The fact that the rate of spread has been declining for three weeks is a positive sign.

The Washington DC statistic area according to some also includes Warren, Clarke, Fauquier, and Spotsylvania Counties in Virginia, Jefferson County in West Virginia, Frederick, Howard, Charles and Calvert Counties in Maryland. I rarely go to these places. Of interest to me is Albemarle County, VA with 110 confirmed cases (81 last week) and 4 deaths, and Charlottesville, VA which has 64 confirmed cases (51 last week) and 2 deaths. Montgomery County, VA has 61 cases (54 last week) and 1 death. These two areas are the home of UVA and Virginia Tech, two large universities located in a more rural environment.

Coronavirus in the DC area – update 4

As I live and work in Northern Virginia, just a few miles outside of Washington, DC, the local situation is of interest to me, as I suspect it is to a few other readers. I will be maintaining these updates on Wednesdays for a while. Again, all the data is from the Johns Hopkin’s website (which I gather is also maintained in the DC area), as of 10:32:29 AM: Johns Hopkins CSSE

The DC area is rather sprawling, with over 5 million people scattered across DC, Virginia and Maryland. Let me list the presence of virus by location. I list the number of cases from last week followed by the number of cases this week and then the current number of reported deaths. Population is the 2018 estimate from Wikipedia:

……………………….….Population…last week…this week…Deaths

Washington D.C…………..702,445…,.3,098…..….4,106………..205

Arlington, VA…………..…..237,521…,….625….…..…912………….32

Alexandria VA………….…160,530…,…..462.……..…653…………20

Fairfax County, VA……..1,150,795……2,077……….3,448………124

Falls Church, VA……..…….14,772………..24…………….26………….2

Fairfax City, VA……..………24,574………..22…………….27…………2

Loudoun County, VA………406,850……..468.…………727…….…14

Prince Williams C., VA….…468,011…..…867………1,449…….…20

Manassas…………………….41,641……..110………….175………….2

Manassas Park………….…..17,307………..31…………..53………….1

Stafford Country, VA………149,960…..….164…………221………….2

Fredericksburg, VA…….…..29,144…….……17………….27…………..0

Montgomery C., MD….…1,052,567……..2,768…..…4,152……….242

Prince Georges C., MD….909,308…..….3,734……..5,738……….224

Total……….…….…….…5,365,425……14,467……21,714…..….890


The number of cases was doubling at every locale each week for the previous three weeks. Last week it only went up by half (actually 58%). This week is went up by half (actually 50%). So, this is a more positive trend.

The Mortality Rate for the area is 4.10%, which is high. It either means lots of vulnerable people, or the number of cases of infection are being significantly underreported. The population known to be infected is 0.40%. or one confirmed case for every 247 people. Probably over 1% of the area has been infected.

From my observations, most people are doing a reasonable job of self isolating. Probably easier to do in this more spread out suburban area than in some cities. They do say that this area will become one of the next hotspots, but because it is spread out and primarily suburban, I don’t think it will be anything like New York. The fact that the rate of spread has been declining for two weeks is a positive sign.

The Washington DC statistic area according to some also includes Warren, Clarke, Fauquier, and Spotsylvania Counties in Virginia, Jefferson County in West Virginia, Frederick, Howard, Charles and Calvert Counties in Maryland. I rarely go to these places. Of interest to me is Albemarle County, VA with 81 confirmed cases (66 last week) and 4 deaths, and Charlottesville, VA which has 51 confirmed cases (41 last week) and 2 deaths. Montgomery County, VA has 54 cases (48 last week) and 1 death. These two areas are the home of UVA and Virginia Tech, two large universities located in a more rural environment.