Mystics & Statistics

A blog on quantitative historical analysis hosted by The Dupuy Institute

Some Selected Mortality Rates by Country for the Coronavirus

The virus has been going on for a while, and a number of countries have been hard hit but are now successful in containing it, some contained it early on and were never hard hit, some have been less successful, and some really have not contained the virus. Let us look at some mortality rates from a few selected countries:

UK (44K/67M): 0.07% or 1 out of every 1,523 people

Spain (28K/47M): 0.06%

Italy (35K/60M): 0.06%

France (30K/67M): 0.04%

USA (129K/330M): 0.04% or 1 out of every 2,558 people

Canada (8.7K/38M): 0.02%

Germany (9K/83M): 0.01%
Japan (1K/136M): 0.0007%

.

These include seven of the ten richest countries in the world.

A few others of note:

Belgium (9.8K/11.5M): 0.08% or 1 out of every 1,173 people
Holland (6.1K/17.5M): 0.03%

.

Australia (0.1K/26 M): 0.0004%
New Zealand (0.02K/5M): 0.0004%

.

Sweden (5.4K/10.3M): 0.05% or 1 out of every 1,907 people
Denmark (0.6K/5.8M): 0.01%
Norway (0.25K/5.4M): 0.005%
Finland (0.3K/5.5 M): 0.005%


This is all based upon Johns Hopkins CSSE reports. Deaths are rounded to the nearest thousand. Population data is from estimates for either late 2019 or mid-2020 (courtesy of Wikipedia) and rounded to the nearest million. For some countries, there are questions about the accuracy of their statistics, although I don’t think the data from any of these countries are in much doubt. All of these countries are wealthy, developed economies with democratic governance and a free press. I do think there is a difference of interpretation between cause of deaths between say Germany and Belgium, which may be part of the difference between their rates. This will need to be addressed by a study on “excess mortality.”

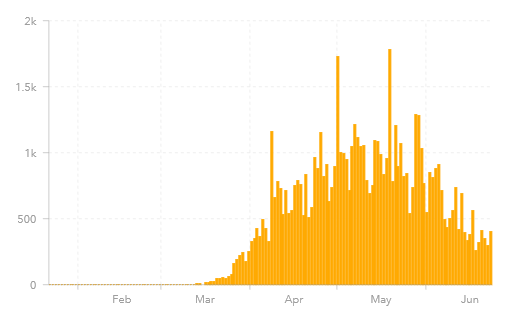
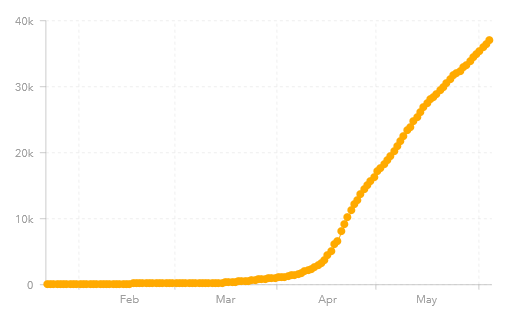
The mortality rates of most of these countries are not going to increase by much more because they have mostly brought the virus under control. This is not the case for Sweden and the United States.

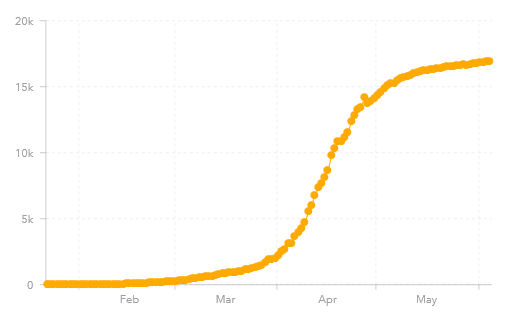
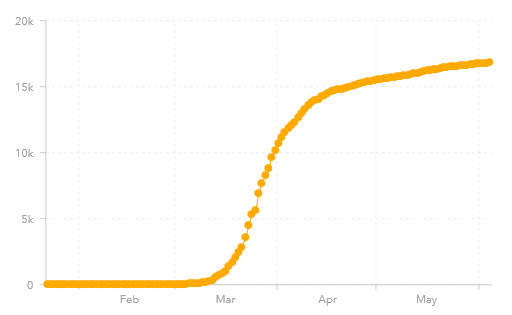
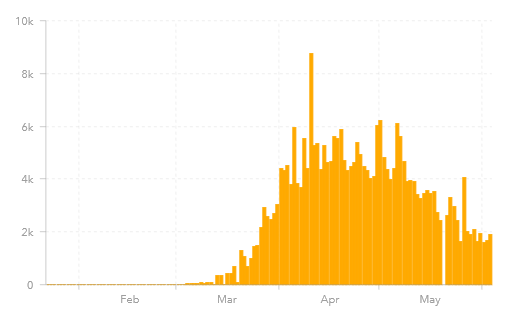
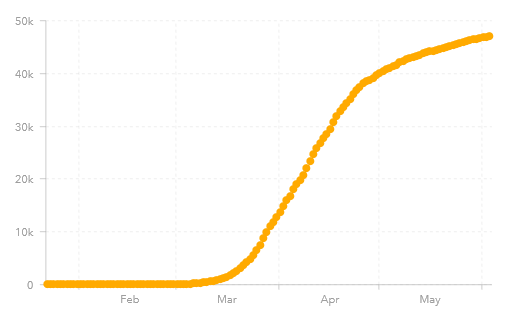
The graph of the daily cases for the U.S. is:

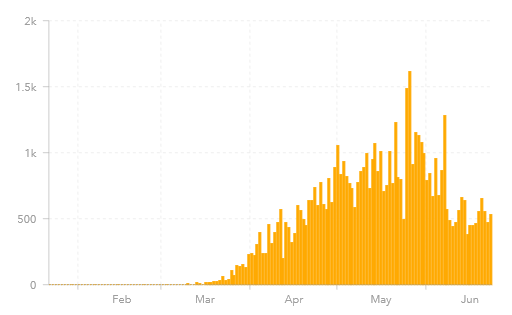
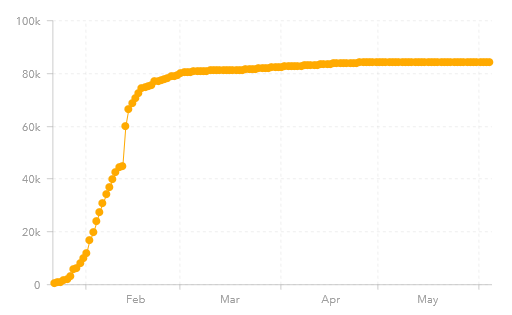
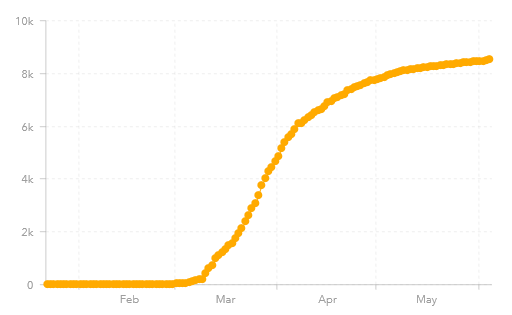
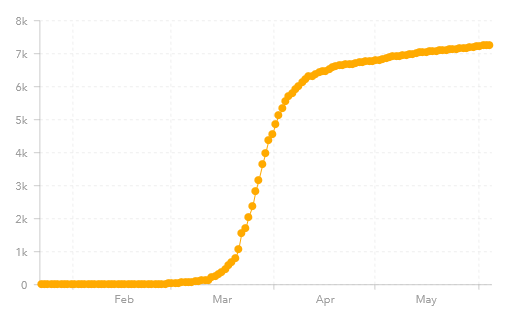
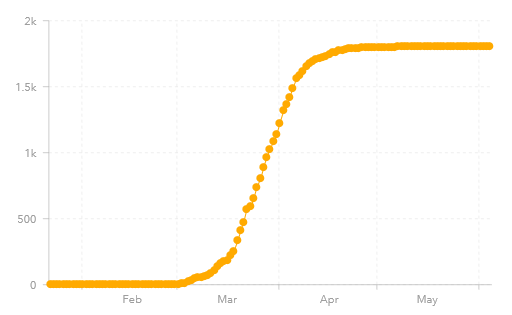
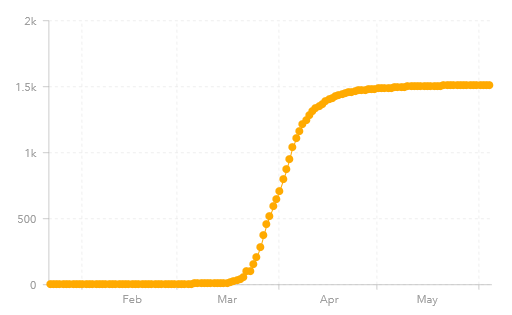
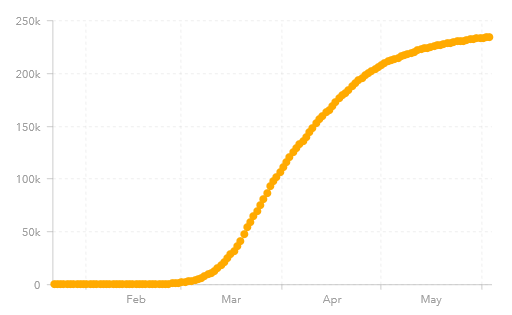
In contrast, Italy is:


Coronavirus in the DC area – update 13

Another weekly update of this coronavirus post. The last four weeks have been encouraging as the number of cases has declined from around 8,000 to 9,500 new cases a week to near 5,400 new cases four weeks ago to near 3,200 cases three weeks ago and down near 2,600 new cases two weeks ago. Over this last week there were 2,406 new cases. This decline occurred during the protests. All the data is from the Johns Hopkin’s website as of 7:33:53 PM: Johns Hopkins CSSE

The DC area is rather sprawling, with over 5 million people scattered across DC, Virginia and Maryland. Let me list the presence of virus by location. I list the number of cases from last week followed by the number of cases this week and then the current number of reported deaths. Population is the 2018 estimate from Wikipedia:

……………………..….Population…last week…this week.…Deaths
Washington D.C…….…..702,445……10,128……10,365……..553
Arlington, VA……………..237,521……..2,438……..2,484…….132
Alexandria VA……………160,530………2.258….…2,325………57
Fairfax County, VA…….1,150,795…….13,588…..13,864.……488
Falls Church, VA…………..14,772…..….….57…….…52…………8
Fairfax City, VA……..…..…24,574.…………69………..70…….….7
Loudoun County, VA….…406,850.……..3,683…….4,047…..…87
Prince Williams C., VA…..468,011.…… .7,038…….7,331…….144
Manassas…………………..41,641….….1,370…….1,414……..18
Manassas Park………….…17,307…….….416…….…430………6
Stafford Country, VA……..149,960…………949………990………5
Fredericksburg, VA…………29,144……..…235………249………0
Montgomery C., MD…….1,052,567…….14,283…..14,803……739
Prince Georges C., MD……909,308……18,151..…18,645……686
Total……….…….………..5,365,425.……74,663…..77,069…2,930

The number of new cases dropped to 5,384 four weeks ago down to 3,216 new cases three weeks ago, down to 2,617 new cases two weeks ago and was 2,406 new cases this last week (measured from my previous Wednesday posting to this Wednesday posting). It was 9,301 new cases seven weeks ago, 8,591 new cases six weeks ago, 7,094 new cases five weeks ago and 5,384 new cases four weeks ago. Keep in mind a number of states are currently running 4,000 to 6,000 new cases a day! This is a 3% increase since last week.

The Mortality Rate for the area is 3.80%, which is high. It either means lots of vulnerable people, or the number of cases of infection are being significantly underreported. The population known to be infected is 1.44% or one confirmed case for every 70 people. It may be that over 2% of the area has been infected.

The Washington DC statistical area according to some also includes Warren, Clarke, Fauquier, and Spotsylvania Counties in Virginia, Jefferson County in West Virginia, Frederick, Howard, Charles and Calvert Counties in Maryland. I rarely go to these places and they were not listed in the Governor of Virginia’s order extending the lock-down in Northern Virginia.

Of interest to me is Albemarle County, VA with 407 confirmed cases (359 last week) and 9 deaths, and Charlottesville, VA which has 216 confirmed cases (182 last week) and 4 deaths. Montgomery County, VA is 147 cases this week (116 last week) and 2 deaths. Of course, who knows what will happen if you bring in tens of thousands of students in the fall. These two areas are the home of UVA and Virginia Tech, two large universities located in a more rural environment. Dare County, North Carolina, a beach area, has 59 cases (31 last week) and 1 death.

Did Eddie Rickenbacker use a Ghost Writer for his Autobiography?

I was recently reading Rickenbacker: An Autobiography by top American World War I ace Eddie Rickenbacker.

Before Rickenbacker became an ace, he was a successful race car driver, having driven at Indianapolis from 1911-1916. He won a number of races on the circuit (but not Indy) and had a reputation as “fast Eddie.” His book describes his first major win of 1914 at Sioux City Iowa on pages 58-61, except the account appears to have been garbled.

To start with it says it was 1913 (there was no race in 1913), then it recounts they were at the race with Duesenbergs (which would have been 1914), then they describe that his teammates were Tom Alley and Ralph Mulford. Tom Alley was his teammate in 1914 with the Duesenberg team while Ralph Mulford was his teammate in 1915 with the Maxwell team. It then describes the race, including his encounter with and the fatal crash of “T. C. Cox.” This crash occurred in the 1915 race and the driver killed was Charles C. Cox.

He then wins the race in a Duesenberg, which would have been in 1914. He won the race in 1915 in a Maxwell. He does have his mechanic Eddie O’Donnell knocked out by a chunk of the dirt track during the race. Eddie O’Donnell was his mechanic in 1914, and was a driver in the 1915 for the Duesenberg team and placed second. He then has Tom Alley, his teammate in 1914, coming in 3rd (Tom Alley came in 5th in 1914, but came in 3rd in 1915, still in a Duesenberg but was not longer his teammate).

It does appear that the writer garbled the two accounts of his win in 1914 and his subsequent win there in 1915. I gather this account was supposed to be the 1914 race. Perhaps Eddie Rickenbacker confused the two races he won, but as he was involved in a fatal crash in 1915, I find it hard to believe that he would.

It is a very well written 443-page book for a guy who did not complete 7th grade. I do wonder if he had to hire a ghostwriter or if his editor took a heavy hand to the early chapters. In the front of the book he does thank Booton Herndon for his editorial assistance. There is no indication that a ghost writer was used.

Some links to the Indy Car results:
1. 1914 Sioux City: https://www.racing-reference.info/race/1914_Sioux_City_Race/UO
2. 1915 Sioux City: https://www.racing-reference.info/race/1915_Sioux_City_Race/UO

Coronavirus in the DC area – update 12

One more weekly update of this coronavirus post. The last four weeks have been encouraging as the number of cases has declined from around 8,000 to 9,500 new cases a week to around 7,000 new cases four weeks ago to near 5,000 cases three weeks ago and down near 3,000 new cases two weeks ago., Over this last week there were 2,617 new cases. So far, it does not look like a real negative impact from all the protests. All the data is from the Johns Hopkin’s website as of 10:33:35 AM: Johns Hopkins CSSE

The DC area is rather sprawling, with over 5 million people scattered across DC, Virginia and Maryland. Let me list the presence of virus by location. I list the number of cases from last week followed by the number of cases this week and then the current number of reported deaths. Population is the 2018 estimate from Wikipedia:

……………………..….Population…last week…this week.…Deaths
Washington D.C…….…..702,445…….9,847……10,128……..541
Arlington, VA……………..237,521…….2,372….….2,438……..126
Alexandria VA……………160,530…….2,175..……2.258…….…50
Fairfax County, VA…….1,150,795……13,153…..13,588………450
Falls Church, VA…………..14,772…………58…….….57…….….7
Fairfax City, VA……..…..…24,574.….……..68…………69…….….7
Loudoun County, VA….…406,850.…….3,458….…3,683………84
Prince Williams C., VA…..468,011.…… 6,654…….7,038…..…136
Manassas…………………..41,641….….1,320……1,370……….16
Manassas Park………….…17,307……….390……….416…………5
Stafford Country, VA……..149,960………..906….…..949…………5
Fredericksburg, VA…………29,144……….215…..….235…………0
Montgomery C., MD…….1,052,567……13,819…..14,283…….728
Prince Georges C., MD……909,308…..17,611…..18,151..……662
Total……….…….………..5,365,425.…..72,046..…74,663……2,817

The number of new cases the previous week dropped to 5,384 two weeks, down to 3,216 new cases last week and 2,617 new cases this week. It was 9,301 new cases five weeks ago, 8,591 new cases four weeks ago, 7,094 new cases three weeks ago and 5,384 new cases two weeks ago. We shall see if it holds. This is a 4% increase since last week. The number of deaths increased this last week by less than a hundred.

The Mortality Rate for the area is 3.77%, which is high. It either means lots of vulnerable people, or the number of cases of infection are being significantly underreported. The population known to be infected is 1.39% or one confirmed case for every 72 people. It may be that over 2% of the area has been infected.

The Washington DC statistical area according to some also includes Warren, Clarke, Fauquier, and Spotsylvania Counties in Virginia, Jefferson County in West Virginia, Frederick, Howard, Charles and Calvert Counties in Maryland. I rarely go to these places and they were not listed in the Governor of Virginia’s order extending the lock-down in Northern Virginia.

Of interest to me is Albemarle County, VA with 359 confirmed cases (293 last week) and 8 deaths, and Charlottesville, VA which has 182 confirmed cases (161 last week) and 3 deaths. Montgomery County, VA is 116 cases this week (97 last week) and 2 deaths. Of course, who knows what will happen if you bring in tens of thousands of students in the fall. These two areas are the home of UVA and Virginia Tech, two large universities located in a more rural environment. Dare County, North Carolina, a beach area, has 31 cases (25 last week) and 1 death.

Below are the case charts by day for DC, Maryland and Virginia (for the entire state in the case of Maryland and Virginia). They all show a positive pattern:

Coronavirus in the DC area – update 11

Just doing my weekly update of this coronavirus post. The last three weeks have been encouraging as the number of cases has declined from around 8,000 to 9,000 new cases a week to around 7,000 new cases three weeks ago to near 5,000 cases two weeks ago and down near 3,000 new cases over this last week. So far, it does not look like a real negative impact from all the protests. All the data is from the Johns Hopkin’s website as of 11:33:26 AM:  Johns Hopkins CSSE

The DC area is rather sprawling, with over 5 million people scattered across DC, Virginia and Maryland. Let me list the presence of virus by location. I list the number of cases from last week followed by the number of cases this week and then the current number of reported deaths. Population is the 2018 estimate from Wikipedia:

……………………..….Population…last week…this week.…Deaths
Washington D.C…….…..702,445…….9,474……9,847……..523
Arlington, VA……………..237,521……2,280…….2,372….….124
Alexandria VA……………160,530……2,125……..2,175..….…48
Fairfax County, VA…….1,150,795…..12,746…..13,153…..….429
Falls Church, VA…………..14,772………..56….…….58……..….7
Fairfax City, VA……..…..…24,574.….…….69………..68….…….7
Loudoun County, VA….…406,850.…….3,180……3,458………80
Prince Williams C., VA…..468,011.…… 6,376……6,654…..…127
Manassas…………………..41,641….….1,262……1,320……….14
Manassas Park………….…17,307……….360…..….390…..…….6
Stafford Country, VA……..149,960……….831..……906………….5
Fredericksburg, VA…………29,144………194………215….……..0
Montgomery C., MD…….1,052,567…..13,124….13,819…..….672
Prince Georges C., MD……909,308…..16,753….17,611….…..648
Total……….…….………..5,365,425.…..68,830….72,046..….2,690

The number of new cases the previous week dropped to 5,384 and this week down to 3,216 new cases. It was 9,301 new cases four weeks ago, 8,591 new cases three weeks ago, 7,094 new cases two weeks ago and 5,384 new cases last week. We shall see if it holds. This is a 5% increase since last week. The number of deaths increased this last week by less than a hundred.

The Mortality Rate for the area is 3.73%, which is high. It either means lots of vulnerable people, or the number of cases of infection are being significantly underreported. The population known to be infected is 1.34%. or one confirmed case for every 74 people. It may be that over 2% of the area has been infected.

The Washington DC statistical area according to some also includes Warren, Clarke, Fauquier, and Spotsylvania Counties in Virginia, Jefferson County in West Virginia, Frederick, Howard, Charles and Calvert Counties in Maryland. I rarely go to these places and they were not listed in the Governor of Virginia’s order extending the lock-down in Northern Virginia.

Of interest to me is Albemarle County, VA with 293 confirmed cases (260 last week) and 8 deaths, and Charlottesville, VA which has 161 confirmed cases (142 last week) and 3 deaths. Montgomery County, VA is 97 cases this week (96 last week) and 2 deaths. Of course, who knows what will happen if you bring in tens of thousands of students in the fall. These two areas are the home of UVA and Virginia Tech, two large universities located in a more rural environment. Dare County, North Carolina, a beach area, has 25 cases (25 last week) and 1 death.

Below are the case charts by day for DC, Maryland and Virginia (for the entire state in the case of Maryland and Virginia). They all show a positive pattern:

Coronavirus in the DC area – update 10

Still maintain weekly updates of this coronavirus post. The last two weeks have been encouraging as the number of cases has declined from around 8,000 to 9,000 new cases a week to around 7,000 new cases two weeks ago to near 5,000 cases this last week. Wondering, with all the protests, if that decline will continue. All the data is from the Johns Hopkin’s website as of 11:33:09 AM: Johns Hopkins CSSE

The DC area is rather sprawling, with over 5 million people scattered across DC, Virginia and Maryland. Let me list the presence of virus by location. I list the number of cases from last week followed by the number of cases this week and then the current number of reported deaths. Population is the 2018 estimate from Wikipedia:

……………………..….Population…last week…this week.…Deaths
Washington D.C…….…..702,445……9,016….…9,474………..495
Arlington, VA……………..237,521……2,142….…2,280……….121
Alexandria VA……………160,530…….2,016….…2,125……..…47
Fairfax County, VA…….1,150,795…..11,596…..12,746……….422
Falls Church, VA…………..14,772………..55…..……56………….8
Fairfax City, VA……..…..…24,574………..67………. 69……….…6
Loudoun County, VA….…406,850…….2,659….…3,180…………67
Prince Williams C., VA…..468,011…….5,837…… 6,376…….…118
Manassas…………………..41,641…….1,154……1,262…..…….12
Manassas Park………….…17,307……….332….…..360………….6
Stafford Country, VA……..149,960……….738………831………….5
Fredericksburg, VA…………29,144……….172……..194…………..0
Montgomery C., MD…….1,052,567……11,924….13,124……….672
Prince Georges C., MD……909,308……15,738….16,753………613
Total……….…….………..5,365,425……63,446….68,830…….2,592

This is real progress, as the number of new cases dropped to 5,384. It was 8,200 new cases four weeks ago, 9,301 new cases three weeks ago, 8,591 new cases two weeks ago and 7,094 new cases last week. We shall see if it holds. This is a 8% increase since last week.

The Mortality Rate for the area is 3.77%, which is high. It either means lots of vulnerable people, or the number of cases of infection are being significantly underreported. The population known to be infected is 1.28%. or one confirmed case for every 78 people. It may be that over 2% of the area has been infected.

The Washington DC statistical area according to some also includes Warren, Clarke, Fauquier, and Spotsylvania Counties in Virginia, Jefferson County in West Virginia, Frederick, Howard, Charles and Calvert Counties in Maryland. I rarely go to these places and they were not listed in the Governor of Virginia’s order extending the lock-down in Northern Virginia.

Of interest to me is Albemarle County, VA with 260 confirmed cases (204 last week) and 8 deaths, and Charlottesville, VA which has 142 confirmed cases (128 last week) and 3 deaths. Montgomery County, VA is 96 cases this week (80 last week) and 1 death. Of course, who knows what will happen if you bring in tens of thousands of students in the fall. These two areas are the home of UVA and Virginia Tech, two large universities located in a more rural environment. Dare County, North Carolina, a beach area, has 25 cases (22 last week) and 1 death.

Surviving Prokhorovka: German Armoured Longevity on the Eastern Front in 1943-1944

This is a link to a long article by Dr. Ben Wheatley called ‘Surviving Prokhorovka: German Armoured Longevity on the Eastern Front in 1943-1944.”: https://www.tandfonline.com/doi/full/10.1080/16161262.2020.1750841

I have not read it yet and probably will not for a while. I have some other deadlines I am working to. This is a subject we have discussed before on this blog.

Some National Coronavirus Graphs – update 5

This updated post addresses the question of when is the virus mitigated, or even better when it is contained, and eventually when should restrictions be relaxed. So we look at South Korea compared to the nine worst plagued countries in the world (see post from yesterday on the “big nine”). We then look at three other countries in East Asia that were near China and had to deal with the virus sooner than most. We then look at a few other countries that appear to getting the virus under control. I think there is considerable value here in comparing results across several countries. All these are simple graphs pulled from the Johns Hopkins CSSE website as of 09:33:07 AM:  Johns Hopkins CSSE

Here is the graph for the number of cases in South Korea, population 52 million. They have 11,668 reported cases. This is clearly what controlling the virus looks like. They have had a total of 273 deaths, for a mortality rate of 2.34%

This is good. This looks like a country that now has the situation under control. Note how long it took (time is on the x-axis).

In comparison, are the United States (1,874,411 reported cases), Brazil (614,941 reported cases) , Russia (449,256 reported cases), United Kingdom (283,080 reported cases), Spain (240,660 reported cases), Italy (234,013 reported cases), India (229,594 reported cases), France (189,569 reported cases) and Germany (184,924 reported cases). It looks like Spain, Italy, France and Germany are bringing the virus under control. The United States, Brazil, Russia and India clearly have not. The graphs from yesterday are in this post:

Coronavirus and the Big Nine

In contrast here are the graphs for three other East Asian nations, Japan (16,949 cases and 913 deaths), Taiwan (443 cases and 7 deaths) and Vietnam (328 cases and still no reported deaths). It took Japan longer to bring the virus under control that South Korea, but it appears like they have done. This is a country with a population of 126 million people.

And here is China, the original source of the virus. They have 84,174 reported cases and 4,638 reported deaths, although there is still some concern about the accuracy of their statistics:

Finally, let me add to this collection of graphs Austria (16,843 reported cases and 672 deaths), Denmark (12,075 reported case and 586 deaths), Czech Republic (9,494 reported cases and 326 deaths), Norway (8,504 reported cases and 238 deaths), Australia (7,251 reported cases and 102 reported deaths), Iceland (1,806 reported cases and 10 deaths), and New Zealand (1,504 reported cases and 22 deaths). It appears that they have all bringing or have actually brought the virus under control.

And then there is Singapore. Seven weeks ago it had 3,614 reported cases. Six weeks ago it had 11,178 reported cases. Four weeks ago it had 21,707 reported cases and 20 reported deaths and as of now it was 37,183 reported cases and 24 deaths. It appears that they still do not have control of the situation.

And finally there is Sweden, which I gather did not do any lockdown procedures. They have 41,883 reported cases and 4,562 deaths. Compare their graph and their stats to their neighbors Denmark and Norway.

Coronavirus and the Big Nine

I am trying to get out of the business of blogging about the coronavirus and move onto other subjects…but, it is kind of hard to ignore.

The nine countries with the highest number of reported cases is the United States, six European Countries, Brazil and India. These account for seven of the ten richest countries in the world. They are shown below, mostly in order of the number of cases (as of 9:32:58 AM EST): Johns Hopkins CSSE

First is the United States (population 330 million) with 1,853K cases and over 107K deaths. The United States now has the highest number of reported cases per capita of any of the “big nine.” This graph is of the number of cases over time, as are the rest.

Next is Brazil (population of 210 million) with 584K cases and over 32K deaths.

Third on the list is Russia (147 million) with 441K cases but only 5,376 deaths. There is some suspicion that the mortality figure is under-reported. That figure gives them a mortality rate of 1.22%. Right now the restrictions in Moscow are very limited (far more so than anyplace in the U.S.).

Fourth is the United Kingdom (68 million) with 281K cases and almost 40K deaths. The UK still has the highest number of deaths per capita of any of the “big nine,” but it does appear that they are bringing the number of cases down now. Still, this was an island nation that had warning after Italy and Spain were struck with the virus.

And:

These four counties have two things in common, first their graphs are pretty much showing a straight line to hell, and second, in my opinion, they all have poorly handled the response to the Coronavirus. They certainly have when compared to the four countries below, all European. They all appear to have brought the virus under control.

Fifth on the list of cases is Spain (47 million) with 240K cases and 27K deaths.

Sixth on the list is Italy (60 million) with almost 234K cases and over 33K deaths. This was the first country in Europe to be seriously hit by the virus.

Eighth is France (67 million) with almost 189K cases and 29K deaths.

Ninth on the list is Germany (83 million) with over 184K cases and only 8,627 deaths. This is a morality rate of 4.68%, which is still high. Germany has certainly does the best job of all these countries in containing the virus. This is a country that is densely populated and mostly land borders. Their death figures may be unreported compared to other countries (for example Belgium) due to definitions of what constitutes a death due to coronavirus as opposed to other causes.

Also on the “big nine” list is India, now seventh on the list and unfortunately is going to rise much higher. They have a population of 1,363 million, with almost 218K cases but only 6,104 reported deaths. This is a mortality rate of 2.80%


There are three other “western” countries of interest to me: Canada, Netherlands and Belgium:

Canada (38 million) has over 94K cases and only 7,579 deaths. Compared to the United States, it has 13% of the population, 5% of the cases and 7% of the deaths. Basically per capita, it infection and mortality rate is half compared to the United. U.S. mortality rate is 5.79%, strongly indicated that there are a lot more cases out there than we have not tested for. Canada’s mortality rate 8.00%, which means that they appear to have the same problem.

There is Belgium (11.5 million) with almost 59K cases and 9,548 deaths. This is more deaths than reported for Germany and the highest number of deaths per capita among these twelve countries. Part of the reason may be again reporting, with Belgium claiming to be very “honest” in their reporting. In the end, people are going to have to look at “excess deaths” since the beginning of this year to get a proper feel of what the real comparative death counts are.

Finally, there is the Netherlands (17.5 million) has 47K cases and 6,009 deaths.

It does appear like Spain, Italy, France, Germany, Belgium and Holland are bringing the virus under control. Clearly the United States, Brazil, Russia, India and Canada have not. Hopefully, the United Kingdom is finally starting to.

Coronavirus in the DC area – update 9

Still trying to keep this as a weekly update, although I have been a little busy lately.

As I live and work in Northern Virginia, just a few miles outside of Washington, DC, the local situation is of interest to me, as I suspect it is to a few other readers. I will be maintaining these updates on Wednesdays for a while. Again, all the data is from the Johns Hopkin’s website (which I gather is also maintained in the DC area), as of 2:33:17 PM: Johns Hopkins CSSE

The DC area is rather sprawling, with over 5 million people scattered across DC, Virginia and Maryland. Let me list the presence of virus by location. I list the number of cases from last week followed by the number of cases this week and then the current number of reported deaths. Population is the 2018 estimate from Wikipedia:

……………………….….Population…last week…this week.…Deaths

Washington D.C…………..702,445……8,406…..….9,016………..473

Arlington, VA…………..…..237,521……1,988………2,142……….120

Alexandria VA………….…160,530…….1,824………2,016…………46

Fairfax County, VA……..1,150,795……10,069…….11,596……….396

Falls Church, VA……..…….14,772…………53…………..55………….8

Fairfax City, VA……..………24,574…….…..59…………..67…………6

Loudoun County, VA………406,850…….2,274………2,659………..67

Prince Williams C., VA….…468,011…….5,074……….5,837…..…109

Manassas…………………….41,641…..…..966………1,154………..12

Manassas Park………….…..17,307……….280………….332………….6

Stafford Country, VA………149,960………..657…………738………….5

Fredericksburg, VA…….…..29,144…….…..136………….172……..….0

Montgomery C., MD….…1,052,567……..10,467………11,924……..633

Prince Georges C., MD….909,308……….14,100……..15,738……..565

Total……….…….…….…5,365,425………56,353……..63,446…..2,446


Well, this is real progress, as the number of new cases dropped to 7,093. It was 8,547 new cases four weeks ago, 8,200 new cases three weeks ago, 9,301 new cases two weeks ago and 8,591 new cases last week. We shall see if it holds. This is a 13% increase since last week.

The Mortality Rate for the area is 3.86%, which is high. It either means lots of vulnerable people, or the number of cases of infection are being significantly underreported. The population known to be infected is 1.18%. or one confirmed case for every 85 people. It may be that over 2% of the area has been infected.

The Washington DC statistical area according to some also includes Warren, Clarke, Fauquier, and Spotsylvania Counties in Virginia, Jefferson County in West Virginia, Frederick, Howard, Charles and Calvert Counties in Maryland. I rarely go to these places and they were not listed in the Governor of Virginia’s order extending the lock-down in Northern Virginia. Of interest to me is Albemarle County, VA with 204 confirmed cases (168 last week) and 8 deaths, and Charlottesville, VA which has 128 confirmed cases (97 last week) and 3 deaths. Montgomery County, VA is 80 cases this week (70 last week) and 1 death.  Of course, who know what will happen if you bring in tens of thousands of students in the fall. These two areas are the home of UVA and Virginia Tech, two large universities located in a more rural environment. Dare County, North Carolina was 22 cases (22 last week) and 3 deaths.