Mystics & Statistics

A blog on quantitative historical analysis hosted by The Dupuy Institute

Is the United States on the Verge of Becoming a Single Party Democracy?


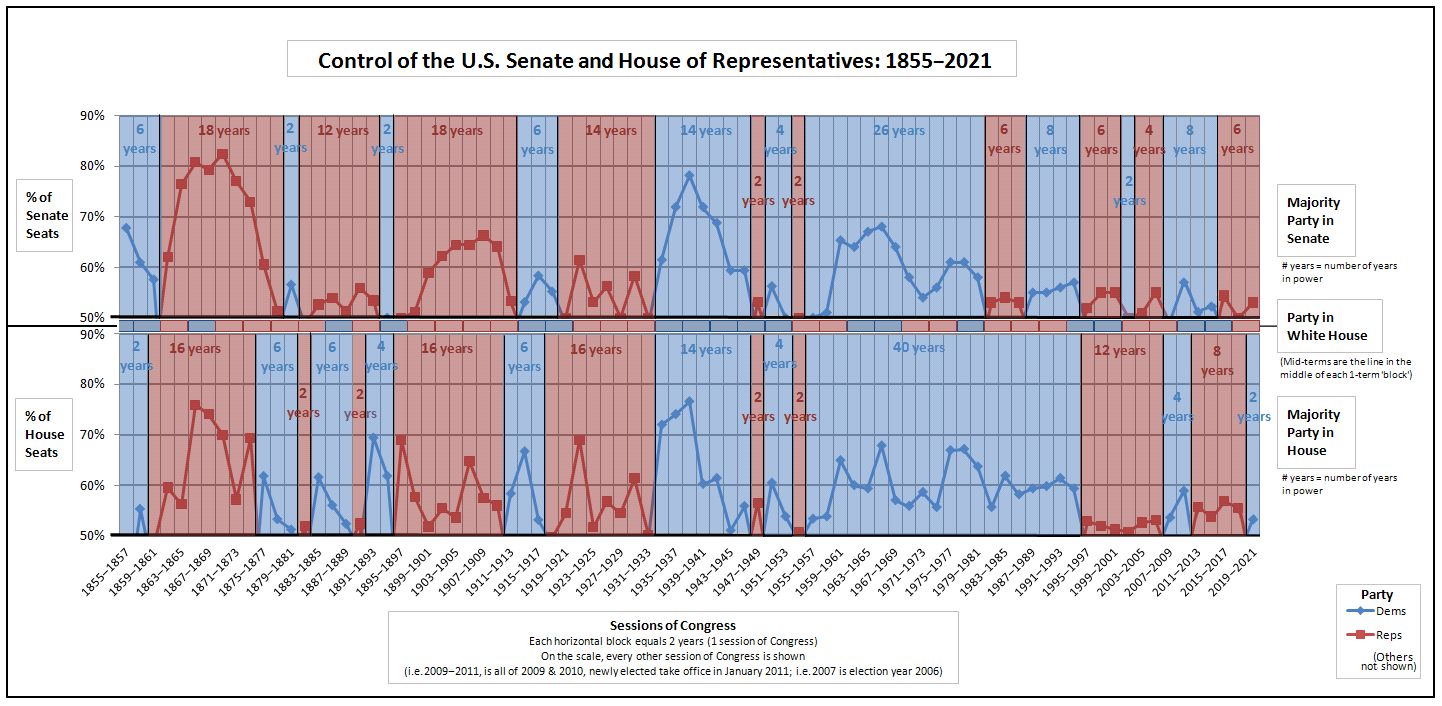
The above chart shows who controlled the House of Representatives, the Senate and the Presidency from 1855 to 2021. As can be seen, there are two periods where one party dominated. From 1859 to 1933 the Republican Party dominated. The Republican Party was formed in 1854 and first took the Presidency in 1861 under Abraham Lincoln. During that period, the House of Representatives was under Republican control for 52 out of the 74 years. The Senate was under Republican control for 62 out of 74 years. The Presidency was under Republican control for 52 out of 74 years. Republican control ended with the Great Depression. The Republicans had control of all three (House, Senate, and Presidency) for 40 of those 74 years. The Democrats had control of all three of these for six of those years.

Then the Democrats took control for the better part of 48 years (1933-1981). They controlled the House of Representatives for 44 out of 48 years, the Senate also for 44 out of 48 years and the Presidency for only 32 out of 48 years. There was only one brief period of two years where the Republicans had control of all three and for 30 of the 48 years, the Democrats had control of all three.

We have then had a period of contested control from 1981 to 2021. This 40 year period started with Reagan’s election, although the Democrats retained control of the House. The Republicans controlled all three for only six years during that time while the Democrats controlled all three for only four years of that time. The rest of that time, for 30 out of these last 40 years, control of the government was contested, with House being under Democratic control for 20 of the last 40 years, the Senate being under Democratic control for 18 of the last 40 years, and the Presidency being under Democratic control for 16 of the last 40 years. This is part of the reason why partisanship has been such an issue. 

So, the question is: are we now entering another period of extended control of the national government by a single party? In 1861 the Republicans took control of the Senate and Presidency, having already taken the House in 1859. The next shift happened in 1933 when the Democrats took the House, Senate and Presidency, ending Republican control of all three for 14 years. The shift in 1980 (when Reagan was elected) only took the Senate and Presidency, with the Democrats holding the House for another 14 years and reclaiming the Senate after six years. Now we see Democrats taking House, Senate and Presidency again. Is this the signal for the change, and does changing U.S. demographics ensure that this change sticks (subject of my next posts)?

I will address this further in follow-up “a-political” postings (as I really hate to get into political debates on this blog…they are best done over a beer).


P.S. I did start preparing the first draft of this post before the events of 5 and 6 January (the Georgia senate elections and the certification of the electoral college votes).

Coronavirus in the DC area – weekly update 40

Colorized picture from California, 1918. Source: reddit

Sorry for the late posting today, but was a little distracted by events in DC. They were not always socially distancing.

Weekly update number 40 on the coronavirus in the DC area. Decided to maintain my very current and relevant picture.

This week the D.C area (pop. 5.4 million) increased by 16,305 new cases. Last week it was 16,418 new cases, the week before 12,087 cases, as the week before that there were 15,323 new cases. Nine weeks ago there were only 4,256 new cases. We are still at least six months way from having a vaccine available for everyone.

Almost all of Europe is still struggling with controlling the spread of the disease. Italy (pop. 60.3 million), the original epicenter of the European outbreak, is still struggling with 15K new cases reported for yesterday.  It remains high in the UK (61K yesterday), France (21K), Spain (24K), Germany (18K) and Russia (24K). The U.S., which has never gotten the virus under control, had 230K new cases yesterday. This is in contrast to places like China (64 cases), Japan (4,946), South Korea (839), Taiwan (2), Vietnam (7), Singapore (28), Australia (19) and New Zealand (4 on 1/04). 

The number of reported cases in the DC area was hovering around 8,000 to 9,500 a week for several months, then declined to a low of 2,406 cases twenty-seven weeks ago. It has since increased. All the data is from the Johns Hopkin’s website as of 9:22 PM: Johns Hopkins CSSE

……………………..….Population…last week…this week…Deaths
Washington D.C…….…..702,445…….28,758…..30,482……806
Arlington, VA……………..237,521..……8,786…….9,420……184
Alexandria VA……………160,530…..…7,231……..7,676……..89
Fairfax County, VA…….1,150,795.…..43,434…..46,776…….691
Falls Church, VA…………..14,772.….…..174……….194……….6
Fairfax City, VA……..…..…24,574..….…..304………311………10
Loudoun County, VA….…406,850….…13,996….14,973….…161
Prince Williams C., VA…..468,011…….25,247….27,297….…263
Manassas…………………..41,641..…….2,867…..3,025…..….29
Manassas Park………….…17,307….……926….….972……..…8
Stafford Country, VA……..149,960….….5,099……5,684…..….26
Fredericksburg, VA…………29,144……..1,021……1,106……….11
Montgomery C., MD…….1,052,567…..45,791…..48,864…..1,157
Prince Georges C., MD.…..909,308…..54,127….57,286…..1,111
Total……….…….….……..5,365,425…237,761..254,066…..4,552

This is a 7% increase since last week. The Mortality Rate for the area is 1.79%. This last week, there were 125 new fatalities reported out of 16,305 new cases. This is a mortality rate of 0.77%. The population known to have been infected is 4.74% or one confirmed case for every 21 people. The actual rate of infection has been higher, perhaps as much as 4 times higher.

Virginia has a number of large universities (23,000 – 36,000 students) located in more rural areas, often tied to a small town. This includes James Madison (JMU) at Harrisonburg, University of Virginia (UVA) at Charlottesville and Virginia Tech (VT) at Blacksburg. Most of them were emptied out due to Thanksgiving and the upcoming Christmas holidays. Many of the students are now home until mid-to-late January.

Harrisonburg, VA is reporting 4,593 cases (4,343 last week) and 46 deaths, while Rockingham County, where the town resides, is reporting 4,313 cases (3,842 last week) and 48 deaths. This is where James Madison University is located.

Charlottesville, VA has 2,303 confirmed cases (2,182 last week) and 34 deaths, while Albemarle County, VA, where the town resides, has 3,009 confirmed cases (2,756 last week) and 33 deaths. This is where UVA is located. UVA had a covid tracker which is worth looking at: https://returntogrounds.virginia.edu/covid-tracker. This is definitely worth looking at, as you can see how they were able to bring the virus under control with a student body of 25,000.  

Further south, Montgomery County, VA has 5,398 cases this week (5,138 last week) and 43 deaths. This is where Virginia Tech is located.

Keep in mind all these increases in this towns is occurring while the universities are not in session. It is currently growing faster than it was when they were.

Virginia (pop. 8.5 million) had 4,377 cases yesterday. Last week it was 4,122. For a long time, it pretty much ran 1,000 cases a day, neither going up or going down.

Dare County, North Carolina, a beach area in the outer banks, has 1,167 cases (996 last week) and 5 deaths. With summer over, not sure why this continues to grow. It is growing a lot faster than during the summer.


Disputed Elections – week 21

Well, it kind of looks like this is over for now. There has been Christmas, New Years and no new significant large protests. I gather there are still flash mobs and small protests, but nothing like the tens of thousands in the street that there was. Two days ago the archbishop of Minsk resigned his post. He has been critical of Lukashenko and has been blocked from re-entering Belarus. Meanwhile Lukashenko is busy planning for a referendum on his constitutional changes. No date as to when that would be.

So, it appears that Lukashenko remains in power for now. The opposition is still out there and there are still small protests (including in St. Petersburg, Russia). Suspect this will simmer for a while. Who knows if there will be a spark that re-ignites the protests in mass or if Lukashenko has safely preserved his rule until the next election (which I gather is in 5 years) or his new constitution is adopted. This is his sixth term as president. He is 64. The main opposition candidate, Sviatlana Tsikhanouskaya remains in Lithuania with her children. Her husband, a political activist, is currently in jail in Belarus. She is 38. Lukashenko says he will resign as president once the new constitution is put into place. Right now, it is not known what that constitution says and when it will be in place.

This is probably the last I will blog about this until something significant happens. It does appear that for now, Lukashenko has managed to put down a protest that had at one point maybe 200,000 people in the street. Early on, he was fairly heavy handed. This seems to fuel the opposition. He then backed down and waited, arresting/detaining several hundred protestors each week. This seemed to work. One wonders if there is a lesson there, which would be, if one tries too hard to crack down on protestors, one just fuels them. In the end, the protest resulted in the death of 4 protestors according to most counts. In contrast, the successful Euromaiden protests that overthrew the government of Ukraine in 2014 was done at a cost of at least 104 people, and some provide much higher figures (up to 780). According to one rumor I heard, during the Euromaiden protests President Putin of Russia kept insisting that Viktor Yanukovych, President of Ukraine, crack down harder on the protestors. At the time, Yanukovych had deployed snipers to shoot at protestors but he apparently told Putin that it was politically impossible to do anything further.

When I first starting blogging about this on 13 August 2020 I laid out six possible scenarios:

1. Lukashenko manages to remain in power.
2. Lukashenko is replaced by someone in his entourage.
3. Lukashenko is overthrown and replaced by a democratic government.
4. Lukashenko is overthrown and replaced by a government that becomes an oligarchy or another dictatorship.

5. Russian intervenes.

6. Lukashenko forms a combined government with the opposition so as to head off Russian intervention.


Russian intervention could have several forms

1. To prop up Lukashenko, possibly in exchange for signing a treaty that surrenders some or much of their sovereignty.
2. To prop up a replacement for Lukashenko, also in exchange for signing a treaty that surrenders some or much of their sovereignty.
3. Russia annexes Belarus.


See: Events in Belarus | Mystics & Statistics (dupuyinstitute.org)

For now, it appears that scenario one is the case. Suspect that will still be the case in twelve months from now. Who knows where we will be at in five years. Dictatorships have a tendency to survive for only one generation and Lukashenko is no longer young. 


P.S. The picture of the detained protestor is from previous months, I just happen to like it (“Beauty and the Beast”). She was identified over twitter (@A_Sannikov) as Natalia Petukhova. The arresting officer has not been identified. Picture came from @svirsky1 via @XSovietNews. I still do no know if she had been released, although many protesters have been detained, charged, convicted and later released.


The lockdowns from Coronavirus are over in 6 months?

We now have two working vaccines in America and are starting to distribute. The goal was to inoculate 20 million by the end of 2020 and then 30 million more per month for subsequent months. We fell short of the first goal (only inoculated around 2 million), but hopefully we are on track to inoculate a million people a day for here on out. We shall see.

Assuming you can inoculate a million people a day (it is a lot), then by the end of June we should have around 180 million people inoculated. There are currently over 20 million who have been tested with the virus, so they theoretically don’t need inoculation. The number who have had the virus but not been tested is probably around 20 to 60 million. The United States is currently accumulating more than 200,000 new reported infections a day, so if it continues at that rate (and I am not sure it will decline soon) by the end of June we may have another 36 million cases (and possibly another 180,000 to 360,000 deaths). The United States has a population of 331 million.

So, in an ideal scenario we would have by the end of June 180 million people inoculated, 20 million already infected, another 36 million infected over the six months, at least 20 million infected but not tested, an additional 36 million new cases of people infected by not tested, less all those people who have been infected but get the vaccine anyway (lets say 1/2 or – 56 million). So 180 + 20 + 36 + 20 + 36 – 56 = 236 million people protected/inoculated. This is 71% of the U.S. population vaccinated or previously infected. This is close to the infamous “herd immunity” which I gather should be 80% or greater.

There may be a group of people who resist or reject the vaccine. This is not a big issue for this calculation, as it simply means other people will get vaccinated instead.

Now, there are a lot of factors that will influence these figures. First and most important is can the United States vaccinate a million people a day? Right now, they have not. If they cannot then the point of recovery may slide out until the fall or even to the end of the year.


P.S. In the last three days we have administered 500,000 vaccines a day. See: https://www.cnn.com/2021/01/04/health/us-coronavirus-monday/index.html


Excess Mortality in Russia

Just saw some statistics on excess mortality in Russia. Apparently it is 230,000 people for 2020, with it being estimated by one expert that 81% are from Coronavirus. 81% of 230,000 is 186,300. 

See: https://www.themoscowtimes.com/2020/12/28/russias-mortality-hit-16-year-high-in-november-official-data-says-a72505

The excess deaths graph in this chart is worth looking at, as it compares 2020 with 2015, 2016, 2017, 2018, and 2019, each year separately graphed.

Anyhow, 186,300 to 230,000 excess deaths because of Coronavirus. John Hopkins lists their reported deaths at 56,798 as of 2:23 PM today. So, it appears that Coronavirus deaths were under-reported in Russia by a factor of 3.3 to 4.0. As military historians we are quite used to the Soviet Union under-reporting or obscuring their losses. Apparently, so does the Russian government. Reminds me of a song: https://www.youtube.com/watch?v=0ArlUSVDQIw

Anyhow, the excess mortality in the United States is around 400,000 or so. U.S. reported deaths from Coronavirus is 346,859. 

Excess Mortality | Mystics & Statistics (dupuyinstitute.org)


Coronavirus in the DC area – weekly update 39

Colorized picture from California, 1918. Source: reddit

Weekly update number 39 on the coronavirus in the DC area. Decided to maintain my very current and relevant picture.

This week the D.C area (pop. 5.4 million) increased by 16,418 new cases. This is worse, but the statistics may be distorted because of the holidays. Last week it improved to be at 12,087 cases, as the week before there were 15,323 new cases. Eight weeks ago there were only 4,256 new cases. We are still at least six months way from having a vaccine available for everyone.

Almost all of Europe is still struggling with controlling the spread of the disease. Italy (pop. 60.3 million), the original epicenter of the European outbreak, is still struggling with 11K new cases reported for yesterday.  It remains high in the UK (53K yesterday, it was 19K two weeks ago), France (11K), Spain (14K), Germany (19K) and Russia (27K). The U.S., which has never gotten the virus under control, had 202K new cases yesterday, slightly down from 216K new cases three Tuesdays ago. This is in contrast to places like China (77 cases), Japan (3,629), South Korea (1,048), Taiwan (2), Vietnam (3), Singapore (13), Australia (32) and New Zealand (7 on 12/28). 

The number of reported cases in the DC area was hovering around 8,000 to 9,500 a week for several months, then declined to a low of 2,406 cases twenty-six weeks ago. It has since increased. All the data is from the Johns Hopkin’s website as of 9:22 PM: Johns Hopkins CSSE

……………………..….Population…last week…this week…Deaths
Washington D.C…….…..702,445…….26,900……28,758……..780
Arlington, VA……………..237,521………8,121……..8,786…….181
Alexandria VA……………160,530.…..…6,782……..7,231…..….87
Fairfax County, VA…….1,150,795…….40,483……43,434…….679
Falls Church, VA…………..14,772………..157……..…174……….6
Fairfax City, VA……..…..…24,574.………..281……….304………10
Loudoun County, VA….…406,850..……12,925……13,996……158
Prince Williams C., VA…..468,011….….23,041……25,247……256
Manassas…………………..41,641….……2,708……..2,867…….30
Manassas Park………….…17,307…………869……….926………8
Stafford Country, VA……..149,960……….4,578…….5,099…….24
Fredericksburg, VA…………29,144.………..941……..1,021……..9
Montgomery C., MD…….1,052,567……..42,551…..45,791..1,120
Prince Georges C., MD.…..909,308……..51,006….54,127…1,079
Total……….…….….……..5,365,425……221,343…237,761..4,427

This is a 7% increase since last week. The Mortality Rate for the area is 1.86%. This last week, there were 174 new fatalities reported out of 16,418 new cases. This is a mortality rate of 1.06%. This increased mortality rate is almost certainly driven by people who got ill several weeks ago, so in sense, the figures are now catching up from the lower mortality rates over the last few weeks. The population known to have been infected is 4.43% or one confirmed case for every 23 people. The actual rate of infection has been higher, perhaps as much as 4 times higher.

Virginia has a number of large universities (23,000 – 36,000 students) located in more rural areas, often tied to a small town. This includes James Madison (JMU) at Harrisonburg, University of Virginia (UVA) at Charlottesville and Virginia Tech (VT) at Blacksburg. Most of them were emptied out due to Thanksgiving and the upcoming Christmas holidays. Many of the students are now home until mid-to-late January.

Harrisonburg, VA is reporting 4,343 cases (4,098 last week) and 44 deaths, while Rockingham County, where the town resides, is reporting 3,842 cases (3,386 last week) and 47 deaths. This is where James Madison University is located.

Charlottesville, VA has 2,182 confirmed cases (2,089 last week) and 34 deaths, while Albemarle County, VA, where the town resides, has 2,756 confirmed cases (2,509 last week) and 31 deaths. This is where UVA is located. UVA had a covid tracker which is worth looking at: https://returntogrounds.virginia.edu/covid-tracker. This is definitely worth looking at, as you can see how they were able to bring the virus under control with a student body of 25,000. Apparently college students are more responsible than many adults. 

Further south, Montgomery County, VA has 5,138 cases this week (4,853 last week) and 38 deaths. This is where Virginia Tech is located.

Keep in mind all these increases in this towns is occurring while the universities are not in session. It is currently growing faster than it was when they were, reinforcing my point that college students appear to be more responsible than many adults.

Virginia (pop. 8.5 million) had 4,122 cases yesterday. Last week it was 3,591. For a long time, it pretty much ran 1,000 cases a day, neither going up or going down.

Dare County, North Carolina, a beach area in the outer banks, has 996 cases (888 last week) and 5 deaths. With summer over, not sure why this continues to grow. It is growing a lot faster than during the summer.

More Force Ratio Posts

The last two posts I made on force ratios was drawn from my book War by Numbers. There are additional posts I did early last year on the subject based upon my in-process follow-on book More War by Numbers. They are summarized here:

Summation of Human Factors and Force Ratio posts | Mystics & Statistics (dupuyinstitute.org)

I have been fairly diligent about making sure the “categories” that are listed on the right hand column of the blog are maintained. Therefore, clicking on Force Ratio will lead you to all 29 Force Ratio related posts on this blog. There are 1,129 posts on this blog (as of this post).


More Combat Results Tables from War by Numbers

Now, the purpose of War by Numbers was not to create Combat Results Tables (CRT) for wargames. Its real purpose was to test the theoretical ideas of Clausewitz, and more particularly, Trevor N. Dupuy to actual real-world data. Not as case studies, but as statistical compilations that would show what the norms are. Unfortunately, military history is often the study of exceptions, or exceptional events, and what is often lost to the casual reader it what the norms are. Properly developed statistical database will clearly show what the norms are and how frequent or infrequent these exceptions are. People tend to remember the exceptional cases, they tend to forget the norms, if they even knew what they were to start with.

Chapters 3, 4 and 5 of War by Numbers is primarily focused on measuring human factors (which some people in the U.S. DOD analytical community seem to think are unmeasurable, even though we are measuring them). As part of that effort I ended up assemble a set of force ratios tables based upon theater and nationality. The first of these, on page 10, was in my previous blog post. Here are a few others, from page 11 of War by Numbers.

Germans attacking Soviets (Battles of Kharkov and Kursk), 1943


Force Ratio                          Result                                    Percent Failure   Number of cases

0.63 to 1.06-to-1.00             Attack usually succeeds      20%                        5

1.18 to 1.87-to-1.00             Attack usually succeeds        6%                      17

1.91-to-1.00 and higher      Attacker Advances                 0%                       21


Soviets attacking Germans (Battles of Kharkov and Kursk), 1943


Force Ratio                          Result                                    Percent Failure   Number of cases

0.40 to 1.05-to-1                  Attack usually fails                70%                      10

1.20 to 1.65-to-1.00             Attack often fails                    50%                      11

1.91 to 2.89-to-1.00             Attack sometimes fails          44%                       9


Pacific Theater of Operations (PTO) Data, U.S. attacking Japanese, 1945


Force Ratio                          Result                                    Percent Failure   Number of cases

1.40 to 2.89-to-1.00             Attack succeeds                        0%                     20

2.92 to 3.89-to-1.00             Attack usually succeeds        21%                      14

4.35-to-1.00 and higher       Attack usually succeeds          4%                     26


Force Ratios and CRTs

Page 10 for War by Numbers includes the following table:

European Theater of Operations (ETO) Data, 1944


Force Ratio                          Result                        Percent Failure  Number of cases

0.55 to 1.01-to-1.00             Attack Fails                         100%                       5

1.15 to 1.88-to-1.00             Attack usually succeeds      21%                       48

1.95 to 2.56-to-1.00             Attack usually succeeds      10%                       21

2.71-to-1.00 and higher       Attacker Advances                 0%                       42


Many commercial wargames have something called a CRT or Combat Results Table. It is based upon force ratios. For example, this was one of the earliest CRTs used on Avalon Hill Games in the 1960s.

As can been seen from this Combat Results Table, at 1-to-1 the chances of an attack winning is one-in-three. At 2-to-1 odds the chances of the attacker winning is either the same as the defender winning or is a two-thirds chance of winning. At 3-to-1 odds, the attacker will always win.

Now the variable factor is the exchange result, which is defined that the defender removed everyone and the attacker removes as much as the defender. This usually results in an attacker win, if the attack has the right “spare change.” If the attacker was attacking with a single 7 strength unit against a 3 strength defender and they roll and exchange, then both units are eliminated.  

Compare that to the table from my book based upon 116 division-level engagements from the European Theater of Operations (1944-145).

Needless to say, some elements of my book War by Numbers are of interest to the commercial wargaming community. 

Coronavirus in the DC area – weekly update 38

Colorized picture from California, 1918. Source: reddit

Weekly update number 38 on the coronavirus in the DC area. Decided to update my picture to something very current.

This week the D.C area (pop. 5.4 million) increased by 12,087 new cases. While this is still very high, it is an improvement. Last week there were 15,323 new cases, the week before that 15,790 new cases, the week before that there were 10,892 new cases and seven weeks ago there were only 4,256 new cases. We are still at least six months way from having a vaccine available for everyone.

Almost all of Europe is still struggling with controlling the spread of the disease. Italy (pop. 60.3 million), the original epicenter of the European outbreak, is still struggling with 13K new cases reported for yesterday.  It remains high in the UK (37K yesterday, was 19K a week ago), France (12K), Spain (11K) and Russia (28K). It is still growing in Germany (36K). The U.S., which has never gotten the virus under control, had 195K new cases yesterday, slightly down from 216K new cases two Tuesdays ago. This is in contrast to places like China (78 cases), Japan (2,658), South Korea (1,090), Taiwan (4), Vietnam (6), Singapore (29), Australia (18) and New Zealand (7). 

The number of reported cases in the DC area was hovering around 8,000 to 9,500 a week for several months, then declined to a low of 2,406 cases twenty-five weeks ago. It has since increased. All the data is from the Johns Hopkin’s website as of 9:22 AM: Johns Hopkins CSSE

……………………..….Population…last week…this week…Deaths
Washington D.C…….…..702,445…….25,602…..26,900……..744
Arlington, VA……………..237,521………7,594……8,121……..169
Alexandria VA……………160,530.…..…6,367……6,782……….84
Fairfax County, VA…….1,150,795…….37,693…..40,483……..660
Falls Church, VA…………..14,772………..146……….157……..…6
Fairfax City, VA……..…..…24,574.………..250………281……….10
Loudoun County, VA….…406,850..……12,193..…12,925…….154
Prince Williams C., VA…..468,011….….21,678..…23,041…….247
Manassas…………………..41,641….……2,612…….2,708……..29
Manassas Park………….…17,307…………836…..…869………..8
Stafford Country, VA……..149,960……….4,207……4,578……..23
Fredericksburg, VA…………29,144.………..860………941…..….8
Montgomery C., MD…….1,052,567……..40,500….42,551…1,069
Prince Georges C., MD.…..909,308……..48,718….51,006…1,042
Total……….…….….……..5,365,425…….209,256..221,343..4,253

This is a 6% increase since last week. The Mortality Rate for the area is 1.92%. Last week, there were 139 new fatalities reported out of 12,087 new cases. This is a mortality rate of 1.15%. This increased mortality rate is almost certainly driven by people who got ill several weeks ago, so in sense, the figures are now catching up from the lower mortality rates over the last few weeks. The population known to have been infected is 4.13% or one confirmed case for every 24 people. The actual rate of infection has been higher, perhaps as much as 4 times higher.

One notes a difference in the statistics between Washington DC and Fairfax County. Washington DC has 1 case per 26 people while it has 1 death per 944 people. Fairfax Country has 1 case per 28 people while it has 1 death per 1,744 people. I suspect the primary (but not the only) driver of these differing statistics is that DC is under-reporting the number of people infected.

Virginia has a number of large universities (23,000 – 36,000 students) located in more rural areas, often tied to a small town. This includes James Madison (JMU) at Harrisonburg, University of Virginia (UVA) at Charlottesville and Virginia Tech (VT) at Blacksburg. Most of them were emptied out due to Thanksgiving and the upcoming Christmas holidays. Many of the students are now home until mid-to-late January.

Harrisonburg, VA is reporting 4,098 cases (3,905 last week) and 40 deaths, while Rockingham County, where the town resides, is reporting 3,386 cases (3,035 last week) and 38 deaths. This is where James Madison University is located.

Charlottesville, VA has 2,089 confirmed cases (2,036 last week) and 34 deaths, while Albemarle County, VA, where the town resides, has 2,509 confirmed cases (2,351 last week) and 29 deaths. This is where UVA is located. UVA had a covid tracker which is worth looking at: https://returntogrounds.virginia.edu/covid-tracker. This is definitely worth looking at, as you can see how they were able to bring the virus under control with a student body of 25,000. Apparently college students are more responsible than many adults. 

Further south, Montgomery County, VA has 4,853 cases this week (4,565 last week) and 32 deaths. This is where Virginia Tech is located.

Keep in mind all these increases in this towns is occurring while the universities are not in session. It is currently growing faster than it was when they were, reinforcing my point that college students appear to be more responsible than many adults.

Virginia (pop. 8.5 million) had 3,591 cases yesterday. Last week it was 3,160 and the week before 3,860 cases. For a long time, it pretty much ran 1,000 cases a day, neither going up or going down.

Dare County, North Carolina, a beach area in the outer banks, has 888 cases (812 last week) and 5 deaths. With summer over, not sure why this continues to grow. It is growing a lot faster than during the summer.