We have over a thousand posts on this blog. Always interesting to go back and look a few of these older ones.
We had one blog post that simply asked on 9 November, 2016, after Donald Trump had been elected: What was going to be his foreign policy/national security policy. The old post is here: Questions | Mystics & Statistics (dupuyinstitute.org)
The answers are:
1D (Afghanistan: Decrease U.S. effort)
2B (Iraq: Decrease U.S. effort)
3B (Syria: Decrease U.S. effort)
4C (Ukraine: Keep the same)
5C (Russia: Try to tone it down)
6D (NATO: Force our NATO allies to contribute more)
7B (Georgia: Continue working with them: Partnership for Peace)
8A (Iran: Cancel current deal and try to renegotiate)
9A (Yemen: Keep the same (remain disengaged))
10? (War on Terror)
11A (Defense Budget: Increase defense budget)
12? (East Asia)
13A (Trade: TTP cancelled)
14D (Oil and Climate Change: Interest and funding for clean energy declined)
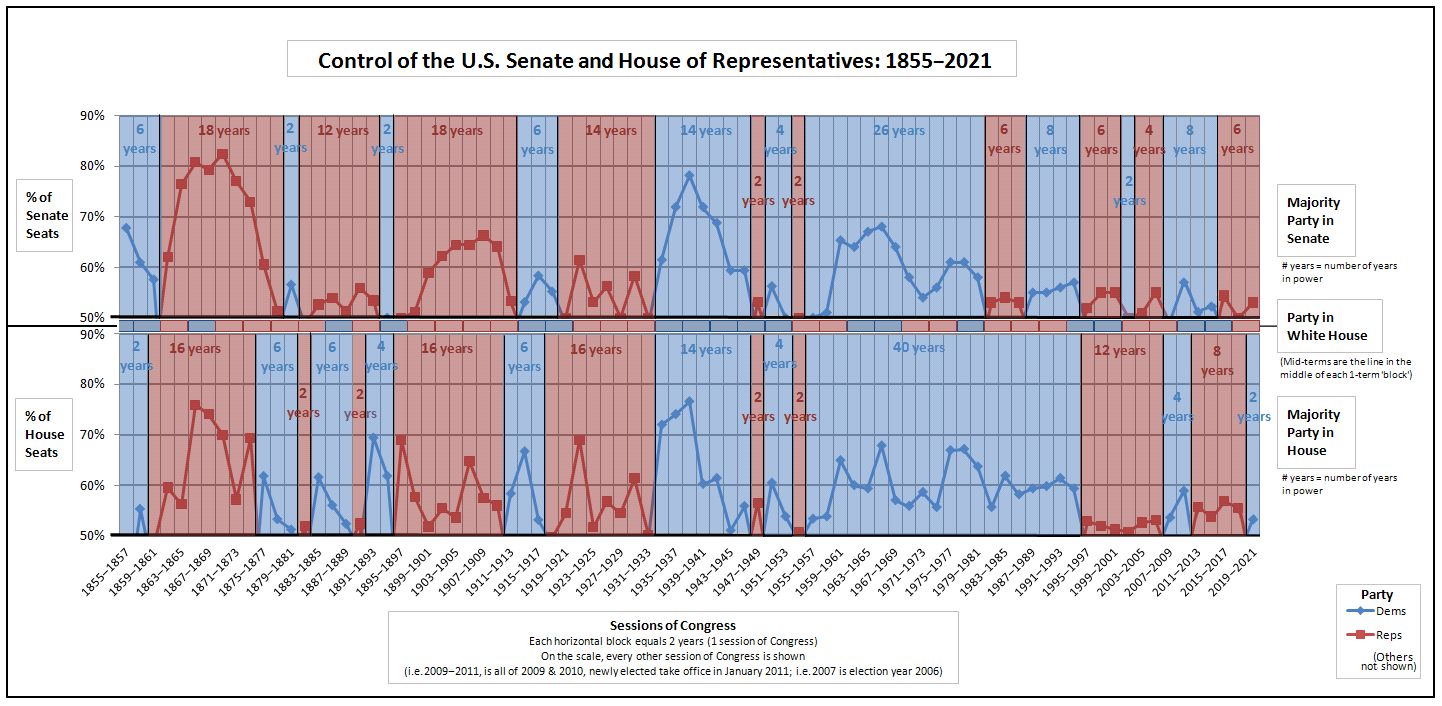
The U.S. Defense budget goes up and down. This is sometimes related to external threats. It is often more closely correlated with which party is in power.
Below is the chart of who held the House, Senate and Presidency since 1855.
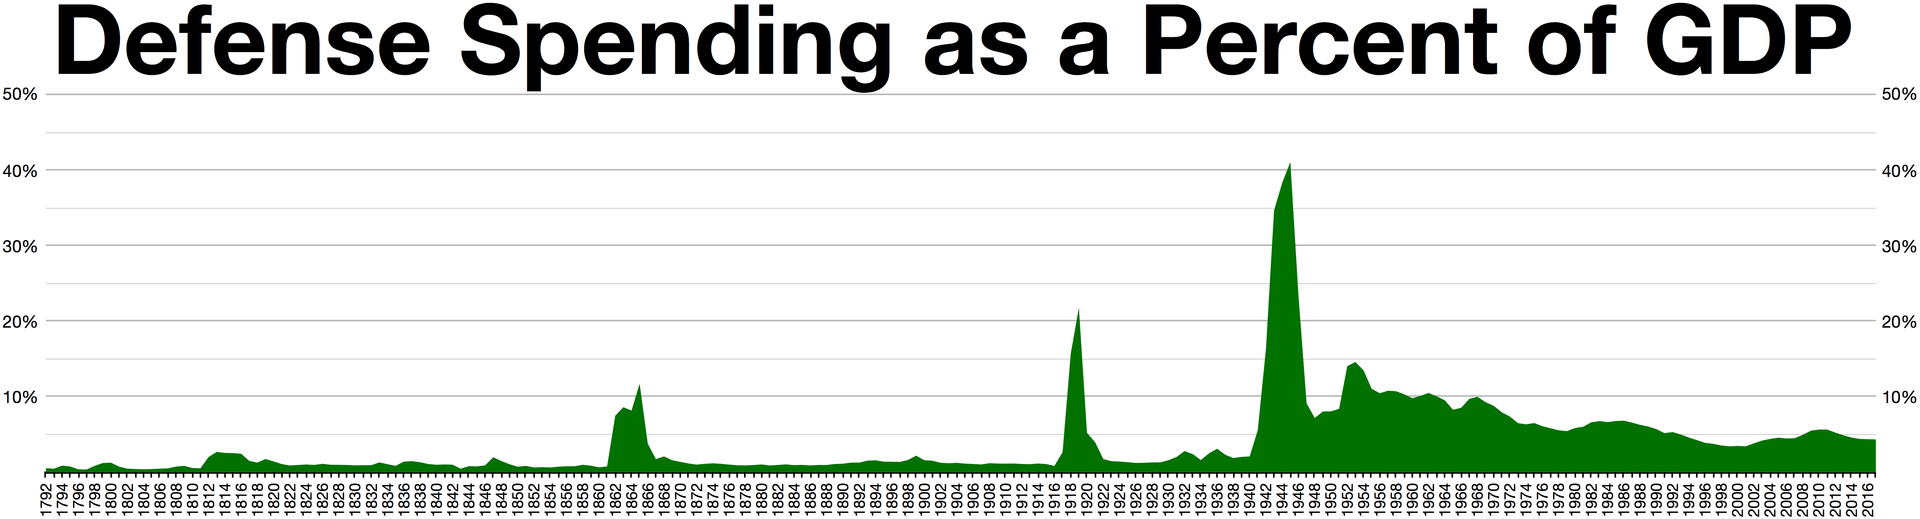
Below is a graph of the U.S. Defense budget as a percent of GDP from 1792 to 2016. We are not going to discuss this graph, I just added it because I think it is a real cool graphic:
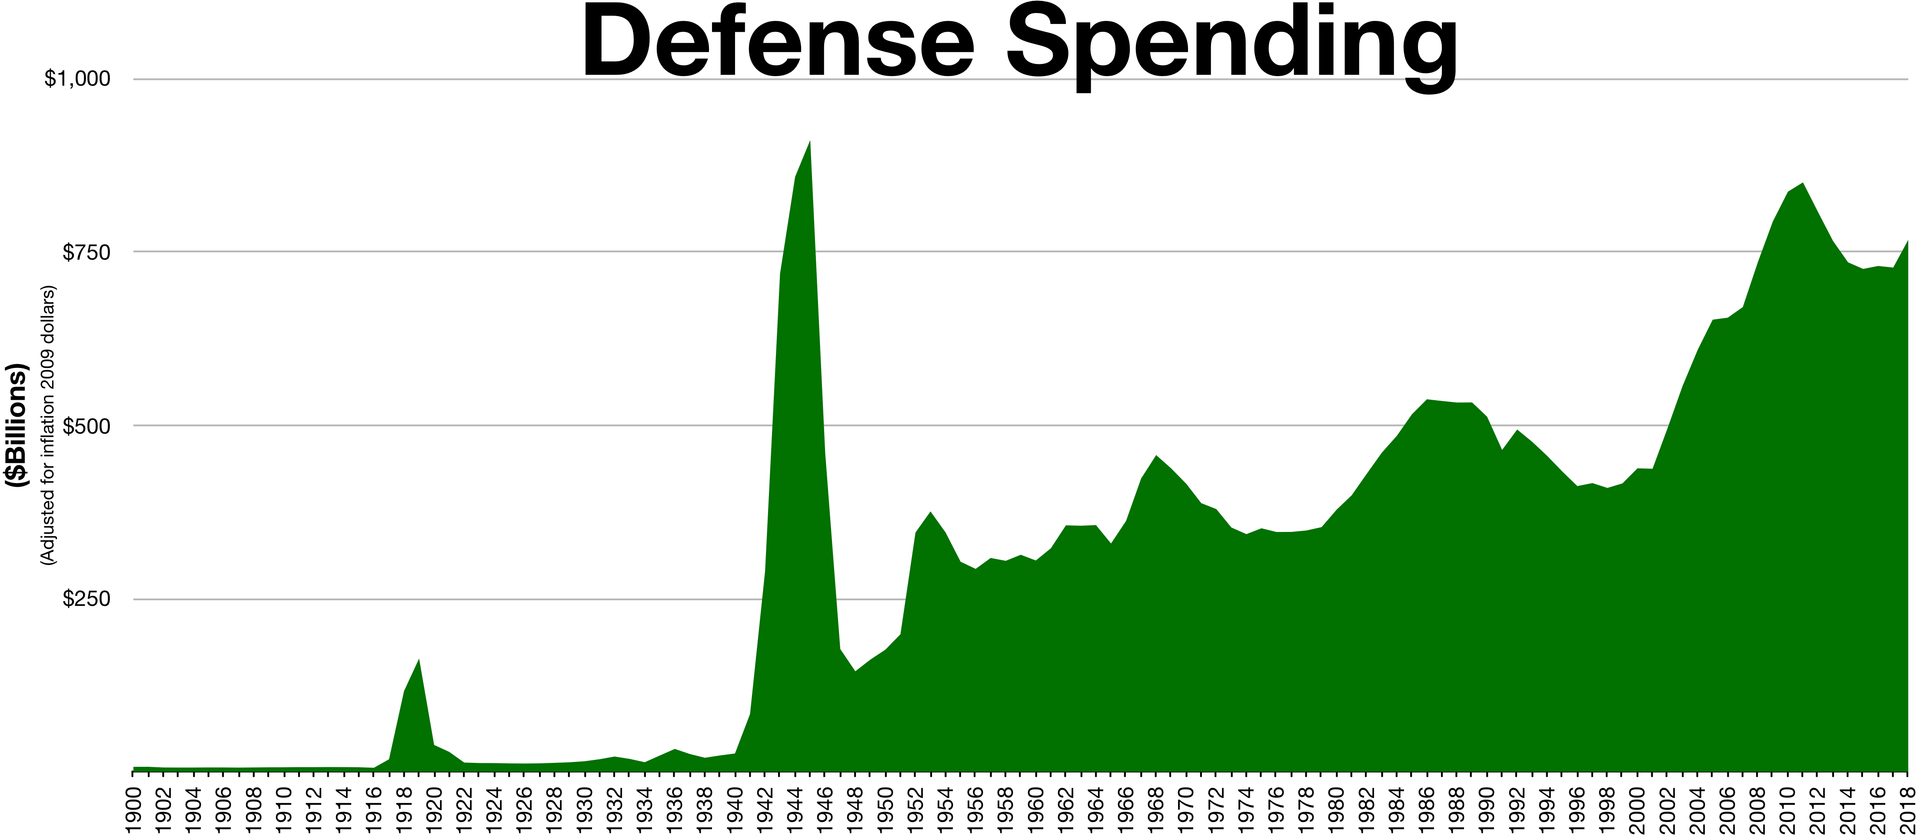
On the other hand, this chart is worth examining further, as it is the U.S. Defense budget in constant 2009 dollars from 1900-2018.
Just picking up the graph from 1972 (after the Vietnam War) one can see (I do recommend copying and blowing up this graphic) that defense spending was flat from 1972-19799 and then started increasing in 1980 under Carter (Democrat) and continued increasing under Reagan (Republican). That increase flattened off and then budget declined after 1989 under Bush (Republican). That budget decline put an end to Trevor Dupuy’s HERO and DMSI organizations, and he reformed in 1992 as The Dupuy Institute. There was a budget increase in 1991, courtesy of the Gulf War and then it continued to decline until 1996 under Clinton (Democrat), where the budget again leveled off. Starting around 2001 under Bush Jr (Republican), the budget again continue to grow, peaking in 2011 and then declining under Obama (Democrat) and leveling off in 2015. It was as a result of that decline that The Dupuy Institute ended up de-staffing, something that we have never recovered from. In 2018 under Trump (Republican) the budget again started to increase (although TDI has not benefited from this increase).
So, the pattern is that the budget does indeed decline or remain flat under Democrats and usually rises under Republicans. There are exceptions to that (1980-1981, 1990-1993, 2000-2001, 2010-2011). But if the pattern holds true, then one is probably safe to assume that it will again decline over the next couple of years down to a lower level. The pattern is that these declines level off at a lower level that is often about 80% or so of the previous budget high. We see that in 1972-1979, 1996-2001 and to a much lesser extent in 2013-2017.
Colorized picture from California, 1918. Source: reddit
Inauguration of a new president today in D.C. Meanwhile the number of cases and deaths from coronavirus continue to rise nationally, although the rate of has declined. This is weekly update number 42 on the coronavirus in the DC area. Decided to maintain my very current and relevant picture.
This week the D.C area (pop. 5.4 million) increased by 18,934 new cases. Last week it was 17,973 new cases. Eleven weeks ago there were only 4,256 new cases. We are still at least six months way from having a vaccine available for everyone.
Almost all of Europe is still struggling with controlling the spread of the disease. Italy (pop. 60.3 million), the original epicenter of the European outbreak, is still struggling with 10K new cases reported for yesterday. It remains high in the UK (33K yesterday), France (24K), Spain (34K), Germany (12K) and Russia (21K). The U.S., which has never gotten the virus under control, had 177K new cases yesterday. This is a downward trend. This is in contrast to places like China (159 cases), Japan (5,284), South Korea (403), Taiwan (6), Vietnam (1), Singapore (30), Australia (9) and New Zealand (5).
The number of reported cases in the DC area was hovering around 8,000 to 9,500 a week for several months, then declined to a low of 2,406 cases twenty-nine weeks ago. It has since increased. All the data is from the Johns Hopkin’s website as of 11:22 AM: Johns Hopkins CSSE
……………………..….Population…last week…this week…Deaths Washington D.C…….…..702,445…….32,600…..34,403……863 Arlington, VA……………..237,521..…..10,277..…10,860……189 Alexandria VA……………160,530………8,307……8,810……..96 Fairfax County, VA…….1,150,795.……50,705…..54,918……733 Falls Church, VA…………..14,772.….……210………243……….6 Fairfax City, VA……..…..…24,574..….…..342………373……..10 Loudoun County, VA….…406,850….…15,711…..17,236……170 Prince Williams C., VA…..468,011…….28,987…..32,237……278 Manassas…………………..41,641..…….3,184……3,458.,……30 Manassas Park………….…17,307….…..1,004……1,041..,..….8 Stafford Country, VA……..149,960….……6,192……6,887…….35 Fredericksburg, VA…………29,144……..1,180…….1,310…….13 Montgomery C., MD…….1,052,567……52,368…..55,203…1,245 Prince Georges C., MD.…..909,308…..60,972……63,994…1,191 Total……….…….….……..5,365,425…272,039…290,973….4,867
This is a 7% increase since last week. The Mortality Rate for the area is 1.67%. This last week, there were 156 new fatalities reported out of 18,934 new cases. This is a mortality rate of 0.82%. The population known to have been infected is 5.42% or one confirmed case for every 18 people. The actual rate of infection has been higher, perhaps as much as 4 times higher.
Virginia has a number of large universities (23,000 – 36,000 students) located in more rural areas, often tied to a small town. This includes James Madison (JMU) at Harrisonburg, University of Virginia (UVA) at Charlottesville and Virginia Tech (VT) at Blacksburg. Most of them were emptied out due to Thanksgiving and the upcoming Christmas holidays. Most of these universities are back in session except for UVA.
Harrisonburg, VA (pop. 54K) is reporting 5,080 cases (4,888 last week) and 55 deaths (up 7 this last week!), while Rockingham County (pop. 81K), where the town resides, is reporting 5,097 cases (4,737 last week) and 63 deaths (up 9 this last week!). This is where James Madison University is located.
Charlottesville, VA (pop. 47K) has 2,586 cases (2,482 last week) and 35 deaths, while Albemarle County, VA (pop. 109K), where the town resides, has 3,575 cases (3,366 last week) and 34 deaths. This is where UVA is located. UVA had a covid tracker which is worth looking at: https://returntogrounds.virginia.edu/covid-tracker. This is definitely worth looking at, as you can see how they were able to bring the virus under control with a student body of 25,000.
Lynchburg (pop. 82K), the home of Liberty University, has 5,514 cases (5,040 last week) cases and 60 deaths.
Further south, Montgomery County, VA (pop. 99K) has 5,894 cases (5,691 last week) and 54 deaths (up 6 this last week!). This is where Virginia Tech is located.
Virginia (pop. 8.5 million) had 4,526 cases yesterday. Last week it was 4,561. For a long time, it pretty much ran 1,000 cases a day, neither going up or going down.
Dare County, North Carolina (pop. 37K), a beach area in the outer banks, has 1,523 cases (1,346 last week) and 6 deaths. With summer over, not sure why this continues to grow. It is growing a lot faster than during the summer.
We usually don’t place any restrictions on incoming remarks. So far, this has not been an issue except for one remark a while back that looked suspicious. Our commentators on this blog have always been very respectful. We received another comment the other day that seemed odd. It referenced a paper on Kursk by an author I was not familiar with. A quick glance at the paper clearly showed that this was a bizarre piece not worthy of further attention. So, do I post the remark and let each person make their decision on the referenced paper, or do I decide that this should get no more attention and not post the remark?
Let me quote the third paragraph from the paper which will show why I really don’t want to bring any attention to it:
“To support his enunciation, Kellerhoff quotes only one source – an obscure British historian Ben Wheatley, who allegedly found some obscure aerial photographs in American archives 75 years after the war. And those photographs, allegedly made by the Luftwaffe planes, are Kellerhoff’s only argument for what he called the “disastrous defeat of the Red Army at Prokhorovka.”
Now, I have not read the referenced article by Kellerhoff, but I am familiar with Dr. Wheatley’s work and have blogged about it before. I also went into those same photo files over a decade ago and there is a 32-page aerial photo section in my big Kursk book. He did not reference my work in his paper. I found out about these aerial photo files from John Sloan, a retired Sovietologist who runs the Xenophon Group (link is in our sidebar). So, these files are certainly not “allegedly found” and “allegedly made by Luftwaffe planes.” They are also not that “obscure” (nor is Dr. Wheatley). A couple of Italian Advanced Squad Leader module designers are currently developing their game map sheets from these Luftwaffe aerial photos. See: http://advancingfire.com/
The rest of the article is filled with similar crap. It was bad enough that if I posted it, then I would be obligated to immediately respond to it. A point-by-point refutation of a ten-page paper would take a while. It sometimes takes more time to refute bad “research” then it takes for the author to make their claims. I do have better and more important, things to do with my time right now. Therefore, I decided not publish the remark and give the referenced article any visibility.
It does appear that the comment is from Russia or a Russian although they use a Chinese appearing name. We will, with some judiciousness, not publish remarks that are obviously deceptive, propaganda-like and based upon poor data. The one other such remark that we did not publish was similar.
The Republican Party appears to have about maxed out its support in most of its core demographics. There are two groups it has had more support from in the past that it lost in 2020, which is white male college educated voters and white female college educated voters. Still, with Trump taking 74 million votes this last election, they did not leave a whole lot spare lying on the table in their core demographics. In contrast, the Democrat took 81 million votes.
We are discussing Republican Party now because they are the party challenged by the changing demographics situation. Now, I did consider entitling this post “whistling past the grave yard,” but felt that may have been a little too pejorative. But, my sense of the situation for over the last 20 years is that the Republican leadership has been very aware of the demographic clock and changing attitudes towards religion working against them, and has been trying to take action to try adjust to these changes. Many of these efforts have not been supported by many in the party.
There was certainly a “black outreach” effort early in the Bush Jr. presidency, very visibly represented by Colin Powell as Secretary of State and Condoleezza Rice as National Security Advisor. That effort does not seem to have resulted in much change. In 2000 it is estimated that the Republican Party won 9% of the “black vote.” In 2020 it was 12% of the “black vote.” This appears to have been an effort that made at best only limited progress. Certainly people can have a loaded political debate as to why. The prominent Colin Powell endorsed Barack Obama in 2008 and 2012 and left the Republican Party in January 2021.
The other major attempt at outreach was by Bush, Jr. with the “Hispanic” vote. In this case, he was well aware of the subject, having been governor of Texas, which in 2000 was 32% “Hispanic.” He encouraged the Senate to put forward the Comprehensive Immigration Reform Act of 2006 (co-sponsors included Republican Senators John McCain and Lindsey Graham). This effort was scuppered by resistance led by Republican Tom Tancredo of Colorado. The bill ended up never being voted into law. Since then no comprehensive immigration reform has been attempted by either party. There is simply not enough agreement on these issues in the last 15 years for anyone to put something together that could actually get majority support.
And then, with the election of Donald Trump and his immigration policy, Republican support among Latinos appears to be have been permanently stagnated. In 2000 Bush Jr. received 35% of the Latino vote. In 2020, Trump received 32% of the Latino vote. Not a strong argument for progress.
Needless to say, the same story exists with many other populations, but these issues have been around for over two decades and the Republican Party has not been able to effectively address them in over two decades. The end result is that they appear to sliding into a permanent political minority role on the national stage.
In 1988 when they won the election, they did so with 53.4% to 45.6% of the popular vote. They did have the advantage of an incumbent (Vice President H. W. Bush) and a growing economy. Since then, the Republican margins have been much less (winner is in bold). In 1992 it was 43.0 (Clinton) to 37.4% (Bush) to 18.9% (Perot). In 1996 it was 49.2% (Clinton) to 40.7% (Dole) to 8.4% (Perot). In 2000 it was 47.9% (Bush) to 48.4% (Gore) to 2.7% (Nader). In 2004 it was 50.7% (Bush) to 48.3% (Kerry). In 2008 it was 52.9% (Obama) to 45.7% (McCain). In 2012 it was 51.1% (Obama) to 47.2% (Romney). In 2016 it was 46.1% (Trump) to 48.2% (Clinton). In 2020 it was 51.3% (Biden) to 46.9% (Trump). In the last eight presidential elections, the Democrats have had more votes in seven of them, and the Republicans only got more than 50% of the vote in one election (and only with the advantage of incumbency and a growing economy).
As I said, they appear to have been whistling past the grave yard.
The last three “political” posts referred to the sense that this latest election may be the start of a new period of single party dominance. We the looked at the changing demographics in the United States and then the change of religion. These three posts are here:
So, why does this matter? Well, let us look at who voted for whom in this last presidential election. This is from the CNN exit polls, which while not “perfect,” they are good enough for this discussion:
Race:………………Percent…….Biden…….Trump
White:……………..67%…………41%………..58%
Black:……………..13%…………87%………..12%
Latino:……………13%…………65%…………32%
Asian:…………….04%…………61%…………34%
Other:…………….04%…………55%…………41%
To read the first line:, “white” made up 67% of the 15,590 people polled. 41% of them voted for Biden, 58% of them voted for Trump.
Religion……….Percent……Biden……Trump
Protestant:……43%………..39%………60%
Catholic:………25%………..52%………47%
Jewish…………02%
Other…………..08%………..69%………29%
None…………..22%………..65%……….31%
Of course, this is an exit poll, so the actual figures may be a couple of percent off, although it is a pretty big poll and exit polls tend to be more accurate than most other polling. The exit poll results are here: https://www.cnn.com/election/2020/exit-polls/president/national-results
Now, there are whole lot of other factors influencing the voter behavior in addition to race and religion but this is enough to look at to establish my point. Now, lets us say we have an electorate that is:
White: 76-19 = 57%
Black: 13%
Asian: 6
Hispanic: 19
Other: 4
Then a Democratic candidate with the same pull as Biden would take 53 percent of the vote (.57 x .41 + .13 x .87 + .06 x .61 + .19 x . 65 + .04 x ..55 = .5289) while a Republican candidate with the same pull as Trump would take 44 percent of the vote (.57 x .58 + .13 x .12 + .06 x .34 + .19 x .32 + 04 x . 41 = .4438). This means that popular vote would split around 53% to 44%, which is a solid and secure lead for the Democratic candidate. In 2020 the popular vote split 51.3% to 46.9%. Turn out in 2020 was 66.7% of registered votes, which is the highest turn out in any U.S. presidential election since 1900 (McKinley vs Bryan). Turnout was below 50% in 1920 (Harding vs Cox), 1924 (Coolidge vs Davis vs La Follette) and in 1996 (Clinton vs Dole vs Perot). Turnout is big issue in the final vote totals, especially as not all age groups and other groups have the same rates of turnout.
So, looking just at demographics is does appear that on the national level the Democrats will continue to hold an advantage of several percentage points over the Republicans unless:
The Republicans expand their reach into the “minorities” votes (Blacks, Asians, or Hispanics). Right now, they are behind in all three, and there does not seem to be strong reason for this to change in the near future.
The Republicans maximize the “white” vote to around 65%.
The demographics of the U.S. changes significantly away from the growing representation of “minorities.” There is no reason to believe that this will happen.
In fact, most likely that demographics of the U.S. will continue to slowly move to even a larger percent of people identified as minorities. So, if the situation is bad now for the Republicans, it will only get worse over time unless there is a major change. This is part of the reason why I tend to believe that we are looking at an extended period of a single dominant political party. And this is not discussing religion.
But, religion is an issue. We have gone from 1970 to there being only 8% of the population telling Gallup that they are not Christian to 31% in 2017 that do not identify themselves as Christian. Now, it would take a huge cultural shift to change that back. Most likely that 31% will remain the same or get larger over time. If it gets larger over time, then this also works against the Republicans. Going back the exit polls, in this last election 60% of Protestants voted for Trump while 65% to 69% of “other” and “none” voted for Biden. So unless there is suddenly a nationwide religious “revival,” this is not going to get any more favorable to the Republicans in the long run.
So, two long-term trends working against them sort of ensures that more often than not, the Democrats with control the House, Senate and Presidency for many decades to come. And these are not the only long term trends working against them (for example, among voters at 18-24: 65% voted for Biden, only 31% for Trump).
There are a lot of little things that play with the conclusions and overturn them occasionally. This includes who is running for each party, what policies they adopt, which scandals/controversies occur, and probably most important, whether the economy is heading up or down during an election year. But the long term pattern is looking pretty certain.
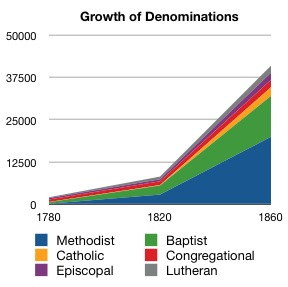
In addition to demographic changes, there also a shift in religious beliefs or lack thereof. The chart below shows the growth in various churched from 1780 to 1860. One will note it is primarily protestants, with Methodists and Baptists dominating. There is a very small line for Catholics. The Catholic areas tended to be where there were Hispanic populations (Texas and California) or where there were Americans of French descent (Louisiana). The state of Maryland was also established as a Catholic colony. During the time of the English Civil War, Catholic Maryland was invaded twice by Virginia, generating one “major” battle (The Battle of Severn in 1655 near what is now Annapolis, Maryland). The Battle of Severn resulted in 2 killed from the 175 Virginian attackers and 49 casualties (17 killed, 32 wounded, with 4 people executed after the battle) among the 130 defenders (38% casualties).
So this takes us up to the U.S. Civil War. The Irish Potato famine started in 1845, generating a large migration of Irish Catholics to the United States. The Irish population declined from around 8.18 million in 1841 to 5.8 million in 1861 and continued to decline to 4.21 million in 1931. The U.S. Irish population boomed. This was followed by many other immigrations from other parts of Europe. By 1950 the split of religions was:
Protestant: 69%
Catholics: 25%
Jewish: 4%
Other religions: 3%
Undesignated: 2%
As of 2017, the same source (Gallup) reports:
Protestant: 38%
Catholics: 21%
Non-denominational Christian: 9%
Mormon: 2%
Jewish: 2%
Other religions: 5% (Muslims make up around 1%)
None: 20%
Undesignated: 4%
Some political parties tend to make religious appeals based on Judeo-Christian heritage, but…it appears that around 30% of the U.S. population no longer identifies itself as Christian. This is a significant change. Most of that change started in the 1970s and greatly expanded in the 1990s and is continuing to expand.
Year……Percent not Christian *
1970……8%
1975…..13%
1980…..11%
1985…..14%
1990…..18%
1995…..18%
2000…..17%
2005…..19%
2010…..24%
2015…..29%
2017…..31%
* i.e. Designated Jewish, Other Religions,. None and Undesignated.
The United States has had two Catholic presidents (Kennedy and Biden), three presidents of significant Irish descent (including Reagan who was half-Irish and half-English/Scottish), two of significant German descent (Eisenhower and Trump **), one of Dutch descent (Van Buren, the only president to speak English as a second language ***), one who was mixed race (Obama), none of Italian descent, none Hispanic, none Jewish and none Mormon. 38 of our 45 Presidents were primarily English/Scottish descent and officially protestants.
** Trump is German on his father’s side and Scottish on his mother’s side.
Much of what is driving the political landscape is demographics. In the United States in 1860, just before the U.S. Civil War, consisted mostly of either “white” protestants; “blacks,” most of whom were slaves; and very few “Indians,” most of whom lived on reservations. Obviously slaves could not vote but were all freed in 1865. Women could not vote until 1920. The citizens also could not directly vote for Senators until 1913. Before then, they were chosen by the various state legislatures.
The actual statistics from 1860 were:
Total Population: 31,443,321
“White”: 26,922,537 (86%)
“Black”: 4,441,830 (14%)
“Indian”: 44,021 (0.14%)
“Asian”: 34,933 (0.11%)
“Hispanic”: 155,000 (0.5%)
Indian is American Indian, Eskimo and Aleut. Asian is Asian and Pacific Islander. Hispanic can be of any race and overlaps with the other categories. The “Hispanic” figure is a very much later estimate and is not based upon census data at that time. I gather the other categories are based upon self-identification (or visual identification by census takers).
Now step forward to 1930, towards the end of the period of Republican domination:
Total Population: 122,775,046
“White”: 110,286,740 (90%)
“Black”: 11,891,143 (10%)
“Indian”: 332,397 (0.27%)
“Asian”: 264,766 (0.22%)
“Hispanic”: 2,021,820 (1.6%) – figure from 1940
The “Hispanic” figure is a later post-census estimate.
Also the nature of the “white” population had changed, and that is a long discussion that I will avoid. It was no longer mostly Anglo, but included considerable number of people from or descended from Germany, Ireland, Italy, various Eastern European countries, etc. This immigration also brought in a considerable number of Catholics and Jews. Some of these groups also faced some discrimination.
And then we get to 1980, towards the end of the period of Democratic domination:
Total Population: 226,545,805
“White”: 188,371,622 (83%)
“Black”: 26,495,025 (12%)
“Indian”: 1,420,400 (0.6%)
“Asian”: 3,500,439 (1.5%)
“Hispanic”: 14,608,673 (6%)
“Other”: 6,758,319 (3%)
And to move up until today (2020, projected) – the end of what may be the period of contested control:
Total Population: 333,896,000
“White”: 255,346,000 (76%)
“Black”: 44,810,000 (13%)
“Indian”: 4,328,000 (1.3%)
“Asian”: 19,708,000 (6%)
“Hispanic”: 63,784,000 (19%)
“Two or more races”: 9,703,000 (3%)
So, Latino’s, other minorities and mixed race people now are up to 42% of the population. In 1980 it was 23%. This is a significant change, especially if one political party does better with some of these groups than others.
It is clear that this shift is having a big effect on U.S. politics. Of course, that is saying the obvious, but this is a major driver in why I think one party is about to re-establish dominance.
Colorized picture from California, 1918. Source: reddit
Amid all the other drama in D.C, we are also setting new national records this last week for the number of cases and deaths from coronavirus. The same with the D.C. area.
This is weekly update number 41 on the coronavirus in the DC area. Decided to maintain my very current and relevant picture.
This week the D.C area (pop. 5.4 million) increased by 17,973 new cases. Last week it was 16,305 new cases. Ten weeks ago there were only 4,256 new cases. We are still at least six months way from having a vaccine available for everyone.
Almost all of Europe is still struggling with controlling the spread of the disease. Italy (pop. 60.3 million), the original epicenter of the European outbreak, is still struggling with 14K new cases reported for yesterday. It remains high in the UK (46K yesterday), France (20K), Spain (25K), Germany (27K) and Russia (23K). The U.S., which has never gotten the virus under control, had 225K new cases yesterday. This is in contrast to places like China (175 cases), Japan (4,575), South Korea (561), Taiwan (4), Vietnam (5), Singapore (17), Australia (16) and New Zealand (6).
The number of reported cases in the DC area was hovering around 8,000 to 9,500 a week for several months, then declined to a low of 2,406 cases twenty-eight weeks ago. It has since increased. All the data is from the Johns Hopkin’s website as of around 11 AM (forgot to check the time): Johns Hopkins CSSE
……………………..….Population…last week…this week…Deaths Washington D.C…….…..702,445…….30,482……32,600……831 Arlington, VA……………..237,521..……9,420……10,277……187 Alexandria VA……………160,530………7,676……..8,307……..91 Fairfax County, VA…….1,150,795.…..46,776…….50,705……720 Falls Church, VA…………..14,772.….…..194……….210………..6 Fairfax City, VA……..…..…24,574..….…..311………..342………10 Loudoun County, VA….…406,850….…14,973…..15,711…….165 Prince Williams C., VA…..468,011…….27,297……28,987……268 Manassas…………………..41,641..…….3,025…….3,184……..29 Manassas Park………….…17,307….…….972…….1,004……….8 Stafford Country, VA……..149,960….….5,684……..6,192……..30 Fredericksburg, VA…………29,144…….1,106….…1,180……..12 Montgomery C., MD…….1,052,567……48,864…..52,368…1,203 Prince Georges C., MD.…..909,308……57,286…..60,972…1,151 Total……….…….….……..5,365,425…254,066….272,039…4,711
This is a 7% increase since last week. The Mortality Rate for the area is 1.73%. This last week, there were 159 new fatalities reported out of 17,973 new cases. This is a mortality rate of 0.88%. The population known to have been infected is 5.07% or one confirmed case for every 20 people. The actual rate of infection has been higher, perhaps as much as 4 times higher.
Virginia has a number of large universities (23,000 – 36,000 students) located in more rural areas, often tied to a small town. This includes James Madison (JMU) at Harrisonburg, University of Virginia (UVA) at Charlottesville and Virginia Tech (VT) at Blacksburg. Most of them were emptied out due to Thanksgiving and the upcoming Christmas holidays. Many of the students are now home until mid-to-late January.
Harrisonburg, VA (pop. 54K) is reporting 4,888 cases (4,593 last week) and 48 deaths, while Rockingham County (pop. 81K), where the town resides, is reporting 4,737 cases (4,313 last week) and 54 deaths. This is where James Madison University is located.
Charlottesville, VA (pop. 47K) has 2,482 confirmed cases (2,303 last week) and 35 deaths, while Albemarle County, VA (pop. 109K), where the town resides, has 3,366 confirmed cases (3,009 last week) and 34 deaths. This is where UVA is located. UVA had a covid tracker which is worth looking at: https://returntogrounds.virginia.edu/covid-tracker. This is definitely worth looking at, as you can see how they were able to bring the virus under control with a student body of 25,000.
Lynchburg (pop. 82K), the home of Liberty University, has 5,040 cases and 60 deaths.
Further south, Montgomery County, VA (pop. 99K) has 5,691 cases this week (5,398 last week) and 48 deaths. This is where Virginia Tech is located.
Keep in mind all these increases in this towns is occurring while the universities are not in session. It is currently growing faster than it was when they were.
Virginia (pop. 8.5 million) had 4,561 cases yesterday. Last week it was 4,377. For a long time, it pretty much ran 1,000 cases a day, neither going up or going down.
Dare County, North Carolina (pop. 37K), a beach area in the outer banks, has 1,346 cases (1,167 last week) and 5 deaths. With summer over, not sure why this continues to grow. It is growing a lot faster than during the summer.