Chris has a new article up on Small Wars Journal: “Airpower: Just a Part of the Counterinsurgency Equation.”
The Dupuy Institute
Excellence in Historical Research and Analysis
The Dupuy Institute
Excellence in Historical Research and Analysis
Mystics & Statistics
A blog on quantitative historical analysis hosted by The Dupuy Institute
KOSOVO 1999
A lot of time could and should be spent examining this campaign. It was example of trying to change of countries’ policy by an extended air campaign. It is such an odd case that I left it out of my original article (see blog post “Defeating an Insurgency by Air”, which is also posted to the History News Network). I simply did not want to address it. I probably should have.
As with the U.S. in Afghanistan in 2001, this was a case where U.S. and NATO airpower was supporting the insurgency. The mostly Muslim Kosovars were revolting against the established Yugoslavian government. In this case through, there was not much of an insurgency and the actions on the ground consisted mostly of Yugoslavia attempting to firm up their control over the area, in part by driving the local Kosovars out of the area. At one point, hundreds of thousands of people were dislodged or migrating from the homes.
The United States and NATO were really not providing air support for the insurgents, so much as attempting a punishing bombing campaign against the Yugoslavian Army without taking any risk of losing aircraft. This was an odd aerial bombardment that continued for 78 days at a loss of five aircraft (two due to combat). Finally, on 3 June 1999, the Yugoslavian government agreed to cease their operations in Kosovo and withdraw their forces. Their losses according to some sources were 14 tanks, 18 APCs, 20 artillery pieces and 121 airplanes and helicopters (see Wikipedia: NATO Bombing of Yugoslavia). This was surprisingly low ground losses for a 78 day air campaign that included 38,004 sorties and involved over a thousand aircraft. This included 10,484 “strike sorties; that released 23,614 “air munitions” over Kosovo (these figures are from NATO covering the period from 24 March to 9 June 1999). This was 6,303 tons of munitions and 35% of the bombs and missiles used were precision guided.
Many commentators, including the NATO commander General Wesley Clark, consider that the primarily reason they withdrew is because the Yugoslavian leader, Milosevic, believed that the U.S. was about to insert ground forces in the campaign.
So it was a successful air campaign, but the reason it was successful was that the Yugoslavian leader thought that it was about to turn into a ground campaign. While this is one of the few cases of a pure air campaign actually achieving its stated political goal, it is not a case of an insurgency being defeated primarily by air, especially as the air campaign was done in support of the insurgency.
To Clarify
Dr. Woodford states:
Hossack [Dstl] (2007), Blaho & Kaiser [CAA] (2009), and Lawrence [TDI] (2015) found no statistically meaningful relationship between troop density and insurgency outcome.
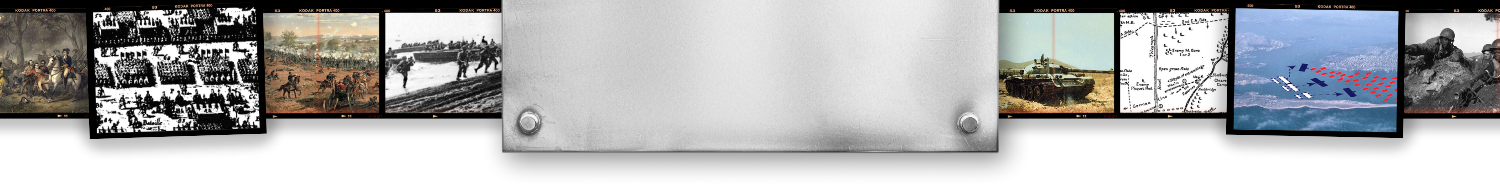
Just to clarify, I went only far enough to prepare the following table:
This was work I did back in 2004 using the original 28 cases we developed the Iraq Casualty Estimate from. At that time, Quinliven had only used 13 cases to establish his theme, and none had a density above 23.7. We did not rigorously test and analyze this theme, as it was clear from even a quick look that there was little value to it “…as a relationship that can be used analytically for predictive purposes for an insurgency.” The original purpose of Quinliven’s estimate was to look at “stability operations.” This is discussed in pages 70-71 of my book.
Force Ratios and Counterinsurgency III
Additional posts in this series:
Force Ratios and Counterinsurgency
Force Ratios and Counterinsurgency II
Force Ratios and Counterinsurgency IV
To summarize the findings of the seven large-N case studies of the relationship between manpower and counterinsurgency:
Troop Density (troops per inhabitant)
- Goode [CAA] (2009) asserted a statistically meaningful relationship between troop density and insurgency outcome.
- Hossack [Dstl] (2007), Blaho & Kaiser [CAA] (2009), and Lawrence [TDI] (2015) found no statistically meaningful relationship between troop density and insurgency outcome.
- Kneece, et al [IDA] (2010) and Friedman (2011) found a statistically meaningful relationship between troop density in defined areas of operation and insurgency outcome
- Friedman (2011) asserted that there was no discernible statistical support for a benchmark troop density level (i.e. 20 troops/1,000 inhabitants).
Force Ratios (counterinsurgents per insurgent)
- Hossack [Dstl] (2007), Libicki [RAND] (2008), Blaho & Kaiser [CAA] (2009), and Lawrence [TDI] (2015) asserted a statistically meaningful relationship between force ratios and insurgency outcome.
- Goode [CAA] (2009) and Kneece, et al [IDA] (2010) rejected the validity of a relationship between force ratios and outcome due to an inherent unreliability of relevant data.
- Friedman (2011) identified a statistically meaningful relationship between force ratios and outcome when controls were applied to the data.
- Lawrence [TDI] (2015) found a strong relationship between force ratios, the nature of an insurgency, and insurgency outcome.
Manpower and insurgency
At first glance, it would appear that despite the recent availability of historical data on insurgencies, the debate over the relationship of force ratios and troop density to outcomes remains an open one. Amidst the disagreement, however, one salient conclusion stands out: all of the studies generally agree that there is a positive correlation between counterinsurgent force strength and the outcome of an insurgency. The collective analysis suggests that the commitment of larger numbers of counterinsurgent forces has historically correlated with more successful counterinsurgency campaign outcomes. What remains open to dispute is just how significant this finding is, or whether it matters at all.
Troop density (countrywide) vs. troop density (AO)
Another broad conclusion from these studies is that there appears to be no statistical support for the original Quinlivan troop density construct as measured by the number of counterinsurgents per inhabitant. The only study to support this without qualification was Goode [CAA] (2009). The extensive data collection and testing conducted by Friedman (2011) also cast serious doubt on the validity of the notion of force level benchmarks.
However, Kneece, et al [IDA] (2010) and Friedman (2011) both made a compelling case for the usefulness of troop density as measured by the number of counterinsurgents per inhabitant within a defined area of counterinsurgent operations. When measured in this manner, a clear correlation was found to exist between troop density and insurgency outcome. This notion has considerable qualitative appeal. Insurgencies generally do not occur uniformly throughout an entire country. Insurgent activity usually takes place within a specific region or area. Consequently, counterinsurgent forces are not deployed uniformly throughout a country, but rather to areas with the highest insurgent activity. This revised troop density construct definitely merits further study.
Force ratios and data reliability
One argument raised against the applicability of using force ratios is that data relating to insurgents is based on either counterinsurgent estimates or imprecise counts, or unreliable information from insurgent sources. This uncertainty therefore simply renders the data invalid for analysis. This claim seems overstated. While it is relatively certain that there are inaccuracies in such data, it is implausible to think that it is all hopelessly flawed or fictitious. In nearly all the datasets, the data are collected as reported. This variety in sourcing would seem to auger against systematic bias, which would truly render the data invalid.
Data collected in an unsystematic way is definitely going to be fuzzy or noisy, but again, this does not invalidate its usefulness. As my colleague Chris Lawrence contends, even if the insurgent force strength data is inaccurate, it is not incorrect by an order of magnitude. The range of error is probably more like +/- 50%. Random changes in insurgent force size by +/- 50% still produce similar analytical results after regression analysis. Insurgent force size data may be noisy, but that in itself is an insufficient reason alone to discount it.
Sensitivity of results to coding choices/definitions
Given the general agreement that there is a relationship between manpower and outcome, it seems odd that there is still deep disagreement over specific aspects of this. One possible explanation for this is the wide variation in definitions of terms and variables. It should be noted that despite the very large body of research and scholarship on insurgency and counterinsurgency, there is very little consensus on how to define such conflicts. Both Kneece, et al [IDA] (2010) and Friedman (2011) pointed out that analytical outcomes are sensitive to how the variables are defined. Kneece, et al [IDA] (2010) did a quick check on how winning or losing was scored among 36 of the same cases in five different data sets and found agreement on only 11.
Some of the variations in the conclusions may be due to case selection. There are no universally accepted definitions for what insurgency or counterinsurgency are, or any meaningful distinction between these types of conflicts and less violent variants such as peacekeeping operations, interventions, or stabilization operations. The authors of each of the studies established clear but differing criteria for case selection, resulting in analyses of similar datasets with some overlap in common cases.
My next and final post in this series will address the origins of the various datasets and potential future directions for research on this subject.
Bleeding an Insurgency to Death
The most meaningful quote I know of about the value of historical study is “The lessons of history are that nobody learns the lessons of history.” Some may write this off as just cynicism, but unfortunately, “history repeats itself,” and we have seen this all too often. There is 3,400 years of documented military history, and this rather extensive data base of material is often ignored; and when it is accessed, often it is to grab an example or two that supports whatever pre-conceived notion that the user already has. It is a discipline that has been poorly used and often abused. Part of our interest in quantified historical analysis is that we want to study the norms, not the exceptions; not the odd case or two, but what are the overall pattern and trends. Sometimes I think the norms get lost in all the interesting and insightful case studies.
Anyhow, there was a posting in another blog that my fellow blogger, Dr. Woodford, brought to my attention that included the formula 30,000 – 25,000 = 30,000. The link to his post is below:
http://blogs.cfr.org/zenko/2016/01/07/how-many-bombs-did-the-united-states-drop-in-2015/#
Mr. Zenko says in part:
The problem with this “kill-em’-all with airstrikes” rule, is that it is not working. Pentagon officials claim that at least 25,000 Islamic State fighters have been killed (an anonymous official said 23,000 in November, while on Wednesday, Warren added “about 2,500” more were killed in December.) Remarkably, they also claim that alongside the 25,000 fighters killed, only 6 civilians have “likely” been killed in the seventeen-month air campaign. At the same time, officials admit that the size of the group has remained wholly unchanged. In 2014, the Central Intelligence Agency (CIA) estimated the size of the Islamic State to be between 20,000 and 31,000 fighters, while on Wednesday, Warren again repeated the 30,000 estimate. To summarize the anti-Islamic State bombing calculus: 30,000 – 25,000 = 30,000.
This post brings back a few memories of our work on Iraq in 2004-2006. If you note in my book America’s Modern Wars there is an entire chapter on “Estimating Insurgent Strength” (pages 115-120). Part of our concern, which we briefly documented on page 116, was that the officially release estimated of insurgent strength remained at 5,000 forever. It was a constant figure, no matter how nasty the situation got. We really did not believe it. Then, when everything fell apart and the insurgents grabbed Mosul (sound familiar?), the estimate was revised upwards to 20,000. This was better, but it still seemed too low to us, especially as the U.S. was claiming something like 12,000 insurgents killed a year. Needless to say, if they were killing 60% of the insurgents a year, this was an insurgency that was going to quickly be bled to death. As we now know with a decade of hindsight, this did not happen.
This was the reason for section in my book called “Bleeding an Insurgency to Death (pages 156-158). Needless to say, something was wrong with the math somewhere, and our own estimate of insurgent strength was something like 60,000 (see page 116). As Mr. Zenko’s blog post points out, something remains wrong with the math in the air war against ISIL.
Iraq Revolt of 1920
The previously quoted Air University Review article discussing air power and the Mad Mullah clearly overplayed the impact of air power on that campaign and rather significantly downplayed the importance of the 3,600 ground troops involved. Oddly enough, various Wikipedia and other articles on the internet make similar claims. The article then goes on to address Iraq in 1920. It states:
http://www.airpower.maxwell.af.mil/airchronicles/aureview/1983/jul-aug/dean.html
By 1920, Churchill had asked Trenchard to plan much more ambitious project, to control Mesopotamia (Iraq) by air. The British were, at the time, nurturing a new Arab government in Iraq, a government not popular among the Arab tribes populating the country. These tribes seemed totally unimpressed with British-sponsored progressive government, which included rules about taxation and standards of acceptable behavior. In late 1920, a serious rebellion against British rule was in progress; the 80 British and Indian battalions (120,000 troops) garrisoning the country were being hard pressed to maintain order. An additional 15,414 men sent from India were quickly absorbed in trying to control an insurrection of at least 131,000 armed men. The British forces were scattered throughout the country, protecting population centers and vulnerable lines of communication. With simultaneous outbreaks of violence in several areas, the British force proved too weak in any single spot to deal effectively with the problem. Even with 63 aircraft working with the army, putting down the 1920 insurrection in Iraq was a costly business: about 38 million pounds.
Now this was a revolt of 131,000 against 120,000, with an additional 15,414 reinforcements according to the same account (other accounts give slightly different figures, see Haldane (link below), pages 64 & 325). So, over 135,000 trained troops against the 131,000 rebelling Iraqis. Not surprising, this did not go well for the rebelling Iraqis, with or without air power. In fact, the entire revolt was over in less than four months. In the case of Somalia, the RAF has 12 planes supporting 3,600 troops or one plane per 300 troops. Now the ratio appears to be one plane per 2,150 troops. This would imply a much lower level of air support than in Somalia.
The British commander in Iraq, Lt. General Haldane, did write a book on the subject, The Insurrection in Mesopotamia 1920:
http://babel.hathitrust.org/cgi/pt?id=inu.30000083739544;view=1up;seq=1
Haldane does address the support he received from the Royal Air Force squadrons (see pages 300-301), and details the various operations and engagements fought. He credits the air force on one occasion with greatly assisting in the defense of an isolated garrison at Rumaithah. This is pretty far from a case of an insurgency being defeated primarily by air. It is clear that statements like those found in Wikipedia that “The use of aircraft shifted the advantage to the British and played a huge role in ending the revolt,” seem to grossly overstate the case (see Wikipedia “Iraq Revolt against the British”). These types of claims are made in several other articles on the net. Haldane’s account certainly does not support these claims.
The revolt started with peaceful protests in May 1920. The armed revolt started in July and was pretty much over by mid-October of that year. It was a 3 1/2 month long revolt. It was never able to establish itself in the larger cities like Baghdad, Mosul and Basra, where the British maintained garrisons. The British then assigned the Iraqi’s a king and established a protectorate over Iraq. This insurrection was followed, of course, by an insurrection in Kurdistan in 1922.
The figure of 131,020 revolting armed Iraqis comes from Haldane, page 124. He states that there were 59,805 armed with modern rifles (also see page 298 and 328). We have no idea how accurate these estimates are (but remain suspicious). Still, it was a significant enough revolt that British casualties were 2,269. This was 426 killed (312 killed, 113 died of wounds and died while prisoner of war), 615 missing (451 missing and 164 prisoners of war) and 1,228 wounded (British figures are from 2 July to 17 October). Haldane states that “Most of the missing were killed, a few only rejoining.” I gather this means that the British lost over 800 troops killed during this campaign (55 British killed and 141 British missing, and 354 Indians killed and 282 Indians missing, and 17 “followers” killed and 28 “followers” missing for a total of 877). Haldane claimed that 8,450 Iraqis killed and wound in the rebellion (see Haldane, page 331). A four-to-one exchange between insurgents and professional military is not out of line with other figures we have seen.
After the revolt, the British, with Winton Churchill as Secretary of State of the Colonies, decided to “police” Iraq from the air. It was this effort, which included air campaigns against recalcitrant villages (and therefore civilians), that led many to focus on the air aspects of this revolt. The 1920 revolt was clearly not put down primarily by air power. There is probably good reason to examine the subsequent efforts to use air power in Iraq, as this was an attempt to keep a potential insurgency off balance by an extended air campaign.
This was also one of those ‘brief insurgencies” which we have not invested a lot of time examining. One of the results of our work was that insurgencies tend to last 4 ½ years or less, or last for 7 years or more. We really had no examples of insurgencies lasting between 4 ½ years in length of 7 years in length in the 100+ cases we studies. In effect, they are either over quickly, in a couple of years, or they drag on for seven years or longer (see America’s Modern Wars, pages 24-25 and 148). This did lead me to consider whether I should categorize or classify “revolts” as something different than “insurgencies.” (for example, would the overthrow of Batista in Cuba in 1958 be classified as a “revolt” or as an “insurgency”?). But, we did not have strong reason to do so for of our analysis at the time, so therefore passed on this subject.
Force Ratios and Counterinsurgency II
![By Perhelion [CC0], via Wikimedia Commons](https://dupuyinstitute.dreamhosters.com/wp-content/uploads/2016/01/1024px-Balanced_scale_of_Justice.svg_-1024x804.png)
Additional posts in this series:
Force Ratios and Counterinsurgency
Force Ratios and Counterinsurgency III
Force Ratios and Counterinsurgency IV
Even as James Quinliven’s assertion of the importance of force density became axiomatic during the dark days of the U.S. war in Iraq, other researchers began to take a closer look at the role force strength played in past insurgencies. What quickly became evident was that the lack of available empirical data to analyze limited the validity of the analysis. Quinliven’s conclusions had been based on just 13 cases. The persuasiveness of conclusions of similar studies were also limited by small sample sizes.[1] Larger data sets, such as those provided by the Correlates of War Project or the Empirical Studies of Conflict Project were available but did not contain the detailed strength data needed for force ratio analysis. The urgency of the Iraq conflict led to government funding to collect the specific data needed to facilitate large-N case studies based on samples that approached statistical significance.
The Dupuy Institute (TDI) undertook one of the earliest efforts to gather a significant sample of historical insurgency data for serious analysis. Between 2004 and 2009, sponsored by the U.S. Army Center for Army Analysis (CAA); Office of the Secretary of Defense, Net Assessment; and the National Intelligence Council of the Central Intelligence Agency, TDI amassed data on 109 cases of post-World War II insurgencies, interventions, and peacekeeping operations. 83 cases were used for analysis.
Led by Chris Lawrence, TDI’s analytical effort found that insurgency outcomes closely tracked the force ratio of counterinsurgents to insurgents. While overwhelming numbers were not required to defeat an insurgency, force ratios above 10-to-1 nearly always guaranteed a counterinsurgent victory. Conversely, lower force ratios did not preclude success, but conflicts with two or fewer counterinsurgents per insurgent greatly favored an insurgent victory.
When force ratios were assessed together with the nature of the motivation for the insurgency, TDI found that force ratios had little impact on the outcome of insurgencies with a limited political or ideological basis. However, when facing broadly popular insurgencies, counterinsurgents lost every time they possessed a force ratio advantage of 5-1 or less, failed half the time with odds between 6-1 and 10-1, but succeeded three-quarters of the time when outnumbering the insurgents by 10-1 or more.
TDI also examined the relationship between force density and conflict outcome, but was unable to find any correlation in the data.
Defence Science and Technology Laboratory (Dstl) [3]
In 2004, the Defence Science and Technology Laboratory (Dstl) of the British Ministry of Defence initiated a multi-year research program into counterterrorist/counterinsurgency campaigns as an extension of previous research on asymmetric warfare. The three-year effort, led by Andrew Hossack, involved data collection on 44 post-World War I asymmetric conflicts, of which 34 were used for analysis.
Hossack’s study concluded that there is a relationship, albeit weak, between between the odds of military campaign success and force ratios as measured in terms of a ratio of median annual force strengths. The advantages were relatively modest. Each tenfold increase in the ratio of counterinsurgents to insurgents improved the chances of success by only 30%. A 10-1 manpower advantage yielded a 47% chance of success. Improving the ratio to 100-1 still only afforded a 77% chance of winning.
RAND [4]
In 2006, the Office of the Secretary of Defense contracted RAND’s National Defense Research Institute for a comprehensive study of insurgency and counterinsurgency. In support of the project, Martin Libicki directed the compilation of data on 89 post-World War II insurgencies to analyze why they began, grew, and were resolved. The original list of cases was based upon a dataset of 127 insurgencies created by James D. Fearon and David D. Laitin[5] and modified.
With regard to force ratios, Libicki concluded that “as a general rule, the greater the government-to-insurgent force ratio, the lower the odds of an insurgent victory,” but that “the relationship is not particularly strong.”
CAA
In 2008, CAA contracted with TDI to code the data for it had collected for 102 post-World War II conflicts and design a database for it, which was designated the CAA Irregular Warfare Database. The availability of the Irregular Warfare Database spawned two CAA analytical efforts.
The first was conducted by Justine Blaho and Lisa Kaiser in 2009, who sought to build a model to predict the outcome of irregular wars. They tested 34 independent variables from 74 of the cases in the database and found 11 with significant correlations to outcome, including the peak counterinsurgent-to-insurgent ratio for each conflict. Blaho and Kaiser removed the variable for counterinsurgent-per-civilian (force density) from their analysis because it did not demonstrate a significant correlation to outcome. Among other conclusions, they determined that counterinsurgents had a greater probability of winning an irregular war if the peak year counterinsurgent-to-insurgent ratio is high.[6]
In 2009, CAA undertook another study aimed at providing historical context for U.S. force levels in Iraq and Afghanistan. Their goal was to find the number of counterinsurgent forces required to arrest and reverse a given level of insurgent violence. The analysts whittled the number of cases from the Irregular Warfare Database to be analyzed to 42 by eliminating those not deemed to be insurgencies, those lacking complete data, and third-party interventions on the side of the insurgents.
In contrast to the previous work using data collected by TDI, the study analysts rejected the validity of counterinsurgent to insurgent force ratios. As justification, they cited the unreliability of data on insurgent force size, insurgent and civilian casualties, and counts of insurgent attacks. Instead, they adopted the force density construct “in accordance with doctrine and previous studies.” In contrast to Quinliven’s 20/1,000 ratio, the CAA analysis concluded that “the minimum counterinsurgent force is 2.8 soldiers per 1,000 residents, with more forces required as the violence level increases.”[7]
Institute for Defense Analysis (IDA) [8]
In preparation for the 2010 Quadrennial Defense Review, Office of the Director, Cost Assessment and Program Evaluation (CAPE), Department of Defense asked the Institute for Defense Analysis to update a previous study estimating ground force requirements for stability operations. For the revised study, the IDA analysts also made use of the CAA Irregular Warfare Database, selecting 41 cases “with the objective of establishing a relationship between force density and outcomes.”
Like the second CAA study, the IDA analysts deemed force ratios to be a “flawed and unreliable indicator,” stating that “we do not believe that information about the size of insurgent forces is sufficiently credible to be subjected to statistical analysis.” Acknowledging previous studies that did not find a statistically meaningful link between force density and outcome, the IDA analysts adjusted the dataset in three ways: to use force densities based on their estimates for the local population of the actual areas of operation in historical cases (as opposed to the entire country); to count indecisive outcomes as military operational successes for the counterinsurgents; and rescoring several outcomes as indecisive, rather than failure for counterinsurgents.
Using this adjusted data, the IDA analysts found a statistically significant, though not robust, relationship between force density and outcome. They concluded that a density of 20‐25 troops per thousand population was consistent with a 50‐60% chance of success. Successful outcomes decreased greatly for force densities below 15 troops per 1,000, and for operations with ratios above 40 troops per 1,000, the success rate exceeded 75%.
In 2011, Jeffery Friedman, then a doctoral candidate in the Harvard Kennedy School, published a large-N academic study on insurgency force strengths, which addressed the basic question “how does manpower affect counterinsurgency?” As his starting point, Friedman adopted the dataset created by Jason Lyall and Isaiah Wilson III of 173 post-World War I insurgencies.[10] After dropping two cases, he added his own data from 400 additional sources on foreign and indigenous counterinsurgent force strengths, the size and population of areas of operations, and insurgent force size.
Friedman subjected his data to a broader range of statistical testing than the previous studies. He concluded that there was no statistical correlation between overall numbers of counterinsurgents or counterinsurgents per area and outcome. He found that counterinsurgent to insurgent force ratios were significant only with controls on the data. However, troop density – measured as the ratio of counterinsurgents per inhabitant in the specific area of operations that the counterinsurgents sought to control – demonstrated a consistent, positive correlation with insurgent success.
Perhaps of greater significance, Friedman also found that manpower did not necessarily have a decisive impact on insurgency outcome. He could find no discernible empirical support for Quinliven’s 20/1,000 ratio. A counterinsurgent troop density of 80 troops per 1,000 inhabitants was less than twice as likely to succeed as a counterinsurgent force sized an order of magnitude lower. In a model derived from his analysis, as force size increased from 5 to 80 troops per 1,000 inhabitants in the area of operations, the probability of success rose by less than 15 percent.
Conclusion
The quality of quantitative analyses of force strengths in insurgencies and counterinsurgencies improved greatly between 2003 and 2011, but the debate remains unresolved. My next post will look at the conclusions of these studies and evaluate whether they tip the scales one way or another in favor of force ratios or troop density.
Notes
[1] John J. McGrath, Boots on the Ground: Troop Density in Contingency Operations. Fort Leavenworth, KS: Combat Studies Institute, 2006; James Dobbins, Keith Crane, and Seth G. Jones, The Beginner’s Guide to Nation-Building. Santa Monica, CA: The RAND Corporation, 2007; Joshua Thiel, “COIN Manpower Ratios: Debunking the 10 to 1 Ratio and Surges,” Small Wars Journal, 2011; Riley M. Moore, “Counterinsurgency Force Ratio: Strategic Utility or Nominal Necessity?” Small Wars & Insurgencies, 24:5, 2013
[2] Christopher A. Lawrence, “The Analysis of the Historical Effectiveness of Different Counterinsurgency Tactics and Strategies,” Presentation at the Cornwallis Group XIII: Analysis in Support of Policy, The Pearson Peacekeeping Centre Cornwallis Park, Nova Scotia, Canada, 17-20 March 2008; Christopher A. Lawrence, America’s Modern Wars: Understanding Iraq, Afghanistan and Vietnam, Philadelphia, PA: Casemate, 2015
[3] Andrew Hossack, “Security Force & Insurgent Success Factors in Counter-Insurgency Campaigns,” Presentation at the Cornwallis Group XII: Analysis for Multi-Agency Support, The Pearson Peacekeeping Centre Cornwallis Park, Nova Scotia, Canada, 2-5 April 2007; Andrew Hossack, “Strategic Success Factors in Counter-Insurgency Campaigns: With Discussion of the Modelling Approach,” Presentation to ORS Defence Special Interest Group, 24 February 2010
[4] Martin C. Libicki, “Eighty-Nine Insurgencies: Outcomes and Endings,” Appendix A in David C. Gompert and John Gordon IV, War by Other Means: Building Complete and Balanced Capabilities for Counterinsurgency, Santa Monica, CA: RAND Corporation, 2008
[5] James D. Fearon and David D. Laitin, “Ethnicity, Insurgency, and Civil War” American Political Science Review 97, 1, Feb 2003
[6] Justine Blaho and Lisa Kaiser, “A Predictive Model for Irregular Wars Based on a Structured Historical Database.” Presentation at the 48th AORS Symposium, Working Group 5 – Irregular Warfare and Counterinsurgency, 14-15 October 2009
[7] Steven M. Goode, “A Historical Basis for Force Requirements in Counterinsurgency,” Parameters, Winter, 2009-10
[8] R. Royce Kneece, Jr., David A. Adesnik, Jason A. Dechant, Michael F. Fitzsimmons, Arthur Fries, and Mark E. Tillman, “Force Sizing for Stability Operations,” Arlington, VA, Institute for Defense Analysis, 2010
[9] Jeffery A. Friedman, “Manpower and Counterinsurgency: Empirical Foundations for Theory and Doctrine,” Security Studies, 20:556–591, 2011
[10] Jason Lyall and Isaiah Wilson III, “Rage against the Machines: Explaining Outcomes in Counterinsurgency Wars,” International Organization 63, no. 1, Winter 2009
Chasing the Mad Mullah
The Dupuy Institute’s work on insurgencies was all based upon post-WWII cases. This was a marketing decision, because it is hard to sell history to some people, and the older the history, the less relevant it appears to them. But, some of the comments to my previous postings caused me to look back at the early British air operations after World War I. I ran across this 1983 article in the Air University Review:
http://www.airpower.maxwell.af.mil/airchronicles/aureview/1983/jul-aug/dean.html
The article states:
“The first indication that the British Air Force could deal effectively with a colonial disturbance was the successful operation of “Z” unit in British Somaliland in 1920. This was a campaign against Mohammed bin Abdullah Hassan, the Mad Mullah, who had been pillaging the eastern tip of Africa since 1899; and who had been evading punitive operations by regular British army units and the Anglo-Egyptian Sudanese Army for more than 15 years. The inability of ground forces to stop the Mullah and his dervishes from overrunning the country led to a cabinet decision to use air power against the brigand and his large following.”
“A self-contained RAF expedition, code-named Unit Z, was organized and equipped for a six-month-long campaign. The unit had 12 de Havilland 9a aircraft, ten Ford trucks, two Ford ambulances, six trailers, two motorcycles, two Crosley light trucks, 36 officers and 183 men. By New Year’s Day of 1920, Z Force had built a temporary airdrome at Berbera and were assembling their aircraft, which had been delivered by ship. By 19 January all aircraft had been assembled and flight tested. The RAF’s plan was simple: bomb the Mullah’s forts and pursue his bands wherever they could be found, driving them toward the resident ground forces stationed in the area.”
“The first raid, carried out by six aircraft, almost ended the war. A bomb blast nearly killed the Mullah, but he was saved by a fortuitously placed camel. Further raids, resulting in heavy casualties, took place over the next two days and caused the dervishes to retreat. Somaliland Field Forces were positioned to block the retreat while the Royal Air Force switched to a supporting role of maintaining communications between the various ground force detachments, providing air cover, and evacuating the wounded. The aircraft proved eminently successful in dislodging the Mullah and his followers from their forts and driving them toward the ground forces which were able to neutralize the Mullah and his band of men The campaign against the Mullah lasted only three weeks and cost about 77,000 pounds, a considerable saving over the campaign proposed by the Chief of the Imperial General Staff. He had estimated that it would take 12 months and two divisions to do the job plus an additional expenditure running into millions of pounds to build the railways, roads, and garrison bases necessary to maintain the peace.”
So was this a case where a dozen aircraft were able to end an insurgency that thousands of troops had not been able to? This air contingent (called the “Z Force”) was led by Royal Air Force (RAF) “Group Captain” Gordon (equivalent to an O-5 or Colonel). The commander of the campaign was the civilian governor general of Somaliland. The ground element included: the battalion-sized Somaliland Camel Corps (700 rifles), a composite battalion of the 2nd (Nyasaland) Battalion and the 6th (British Somalia) Battalion of the King’s African Rifles (700 rifles), a half battalion of an Indian grenadier battalion (400 rifles), and irregular Somali tribal levee (1,500 rifles), 300 “Illaloes,” and naval landing forces from the Royal Navy. So a brigade size force (at least 3,600) with air support.
Now, the Mohammed bin Abdullah Hassan has been fighting the British, the Italians and the Ethiopians since 1899 when he declared his first “jihad” (or holy war) against the colonial powers. This was already a 20-year old contest. This was the addition of airpower to what had been a very extended and extensive campaign. It was the British who gave him the nick-name the “Mad Mullah.” He is considered to be the national hero of Somalia. He does have a facebook page.
His hey-day had been around 1900-1904 when he had thousands of “Darvish” (or Dervishes) under his command and British sent four major expeditions against his Islamic Dervish state. By 1905, he was forced into a truce, where his followers constructed a theocratic state in the Italian protectorate. In 1908, he again initiated his holy war, and 1913 Hassan was able to bloodily defeat the British 110-man Somali Camel Constabulary at Dul Madoba. But, his territory remained limited to a collection of forts in the Ogaden and his fortified capital which he had occupied since 1907. Over time, his strength had declined from 6,000 fighting men in 1913 to less than a thousand in 1919.
The British began a new campaign in January 1920 supported by air forces operating from Berbera. On 21 January and subsequent days the RAF repeatedly bombed Hassan’s camp and followers, almost killing him. Meanwhile the ground forces advanced against the various Dervish forts, with the air planes conducting aerial bombardment for some of those attacks. The ground forces took the capital Taleh on 9 February. Hassan and some of his followers retreated into the Ogaden desert. Hassan later died of the flu, on 21 December 1920, at the age of 64. This was the end of the revolt.
This was a twenty year effort that only included air power at the last year, and it included significant ground forces in an offensive role (contrary to the Air University Review article). Still the British were able to defeat this Islamic state in a 21-day campaign. It was a clear demonstration of the value of air support, but it was essentially a conventional campaign against an already weakened opponent that had a clear objective in taking his forts and his fortified capital. It is not a good example of defeating an insurgency by air.
It is clear that this was primarily a ground campaign, supported by air. For a detailed description of the military operations see pages 262-284 (it can be converted to a PDF file): http://archive.org/stream/TheMadMullahOfSomaliland/214616_The_Madmullah_Of_Somaliland_1916_1921_djvu.txt
It states on page 278 that: “It is unfortunate that no very definite conclusions can probably be drawn from the results achieved, and that consequently the most extravagant claims in regard to the efficacy of aircraft under such conditions have been preferred.” This is followed by a detailed discussion of the value of air in this campaign. It is an account worth reading, especially when compared to some accounts that seem to over-value the air contribution to this campaign.
Air Power Defeating an Insurgency
Well, my post on this subject did stir up some conversation. My statement was that “So, we are left to state that we cannot think of a single insurgency that was defeated by airpower, primarily defeated by airpower, or even seriously undermined by airpower. Perhaps there is a case we are missing.”
This is, of course, not to say that air power has not been very important in fighting insurgencies, it is just too simply point out that air power does not seem to be able to do the job on its own.
Did I overstate my case? Are there a couple cases when this is not true? Perhaps there is a case I am missing. Let’s look at some of the other cases that people have suggested we look at.
- Chasing the Mad Mullah in 1920
- The Iraq Revolt 1920
- Kosovo 1999
- Italian Operations against the Senussi in Libya
- Habbaniya campaign and the defeat of Rashid Ali in May 1941
Perhaps some people were confused by the sentence “The airplane was first extensively used as a counterinsurgent tool by the United States in Nicaragua in 1927-1933…” which probably should have been written as “The airplane was first extensively used by the United States as a counterinsurgent tool in Nicaragua in 1927-1933…” I am going to edit the original post accordingly, so there is no confusion.
Anyhow, we will examine these five cases over the next couple of days. They are all pretty interesting. If there are any other examples we should look at, please let me know.
Force Ratios and Counterinsurgency
How many troops are needed to defeat an insurgency? This deceptively innocuous question is laden with political and military peril. The answer is, of course, that it depends. Some contend that a precise ratio of counterinsurgents to insurgents or to the local population will lead to victory, while others argue that force strengths are irrelevant to success or failure. In the wake of America’s decidedly ambivalent experiences in Iraq and Afghanistan, the debate remains unresolved. However, there have been several recent analytical efforts focused on resolving the question. This will be the first in a series of posts that will review these studies and their conclusions.
It is not clear where the notion originated that force ratios mattered in counterinsurgency. It appears to have become an article of faith during the British campaign in Malaya, although Sir Robert Thompson — a British staff officer in that conflict and a counterinsurgency theorist influential during the Vietnam War — subsequently claimed that the rule-of-thumb that 20 troops were needed per 1,000 insurgents to succeed was the invention of a journalist.[1] Another Mayalan campaign veteran, Richard Clutterbuck, likewise later derided the validity of a “tie-down” ratio:
Much nonsense is heard on the subject of tie-down ratios in guerrilla warfare–that 10 to 12 government troops are needed to tie down a single guerrilla, for instance. This is a dangerous illusion, arising from a disregard of the facts.[2]
The relevance of force ratios made a comeback in the mid-1990s, albeit measured in a different way. Seeking a way of projecting force requirements necessary for sustained stability operations, RAND analyst James T. Quinliven looked at 13 historical cases and concluded that success required 20 troops were needed per 1,000 local inhabitants.[3] Defining ratios by the number of troops per population became known as force density.
The political volatility of force requirements for stability operations and counterinsurgency became vividly apparent during the lead up to the U.S. invasion of Iraq in 2003. Quinlivan published an update of his analysis to address Iraq and asserted that to meet a ratio of 20 troops per 1,000 inhabitants, 500,000 foreign troops were necessary to stabilize 25 million Iraqis.[4] U.S. Army Chief of Staff General Eric Shinseki told Congress that “several hundred thousand” American troops would be necessary to stabilize Iraq following the fall of Saddam Hussein. This drew a quick rebuttal from Deputy Secretary of Defense Paul Wolfowitz, who testified that Shinseki’s estimate was “wildly off the mark.” The public disagreement led to Shinseki’s premature retirement and replacement as Army Chief of Staff.
Although the initial phase of Operation IRAQI FREEDOM quickly defeated the Iraqi military and toppled Saddam’s regime, the chaotic stabilization effort that followed and the emergence of an insurgency appeared to bear out the validity of Qunilivan’s and Shinseki’s assessments for force requirements. Certainly one influential group thought so: the authors of the revised U.S. Army and Marine Corps doctrinal manual FM 3-24/MCWP 3-33.5 Counterinsurgency, published in 2006. The manual rejected tie-down ratios but endorsed Quinlivan’s force density concept:
During previous conflicts, planners assumed that combatants required a 10 or 15 to 1 advantage over insurgents to win. However, no predetermined, fixed ratio of friendly troops to enemy combatants ensures success in COIN. The conditions of the operational environment and the approaches insurgents use vary too widely. A better force requirement gauge is troop density, the ratio of security forces (including the host nation’s military and police forces as well as foreign counterinsurgents) to inhabitants. Most density recommendations fall within a range of 20 to 25 counterinsurgents for every 1000 residents in an AO. Twenty counterinsurgents per 1000 residents is often considered the minimum troop density required for effective COIN operations; however as with any fixed ratio, such calculations remain very dependent upon the situation.[5]
FM 3-24 was often cited as the intellectual foundation for the subsequent success of the so-called Iraqi “Surge” in 2007 under General David Petraeus, who had overseen revision of the manual as the commander of the U.S. Army’s Combined Arms Center at Ft. Leavenworth.
Interestingly enough, however, this endorsement of force density ratios was qualified in the subsequent joint doctrinal manual, JP 3-24 Counterinsurgency Operations, published just three years later in 2009. While force density was still considered a useful measure, mention of the specific 20/1,000 ratio was omitted:
No force level guarantees victory for either side, insurgent or counterinsurgent. No predetermined, fixed ratio of friendly forces to enemy forces ensures success in COIN. The OE and insurgents’ approaches vary too widely. Such calculations remain very dependent upon the assets available and the situation. A better force requirement gauge is counterinsurgent force density, which is the ratio of land security forces (including both indigenous and foreign contributions) and supporting elements (which must account for technological sophistication and applicability) to inhabitants. Force density will depend on the overall context, especially the size and density of the population, and can change over time. In some situations, the necessary force ratio may be unattainable. In these situations, the commander will have to determine if there are ways to leverage other advantages through innovative operational design and interdependent joint operations. If not, this may lead the commander to adopt limited objectives or plan for a prolonged, multiphased campaign as alternatives.[6]
When JP 3-24 and FM 3-24 were again revised in 2013 and 2014, respectively, neither contained any references to force level requirements, tie-down ratios, or troop density.[7] As quickly as the concepts had been adopted, they were abandoned. This is likely the result of more careful examinations of the relationship between force strength and counterinsurgency outcomes conducted during the 2000s. I will take a closer look at these studies in subsequent posts.
Additional posts in this series:
Force Ratios and Counterinsurgency II
Force Ratios and Counterinsurgency III
Force Ratios and Counterinsurgency IV
Notes
[1] Riley M. Moore, “Counterinsurgency Force Ratio: Strategic Utility or Nominal Necessity,” Small Wars & Insurgencies, 24:5, 2013, p. 859
[2] Christopher A.Lawrence, America’s Modern Wars: Understanding Iraq, Afghanistan and Vietnam, Philadelphia, PA: Casemate, 2015, p. 55
[3] James T. Quinlivan, “Force Requirements in Stability Operations,” Parameters 25, no. 4, 1995, p. 59–69
[4] James T. Quinlivan, “Burden of Victory: the Painful Arithmetic of Stability Operations,” Santa Monica, CA: Rand Corporation, 2003
[5] Field Manual (FM) 3-24 Counterinsurgency, Washington, DC: Headquarters, Department of the Army, December 2006, p. I-13
[6] Joint Publication (JP) 3-24 Counterinsurgency Operations, Washington, DC: Joint Staff of the Joint Chiefs of Staff, 5 October 2009, p. III-3
[7] Joint Publication (JP) 3-24 Counterinsurgency, Washington, DC: Joint Staff of the Joint Chiefs of Staff, 22 November 2013; Field Manual (FM) 3-24 Insurgencies and Countering Insurgencies, Washington, DC: Headquarters, Department of the Army, May 2014