Mystics & Statistics

A blog on quantitative historical analysis hosted by The Dupuy Institute

Russian Revolutions

russian-revolution-3-jpg

There seems to be a sense out there that somehow or the other, that the Russians are very stolid, patient, long-suffering and willing to tolerate considerable duress under their government without complaint. Not sure exactly how that idea got established. The last hundred years of Russian history has shown considerable instability.

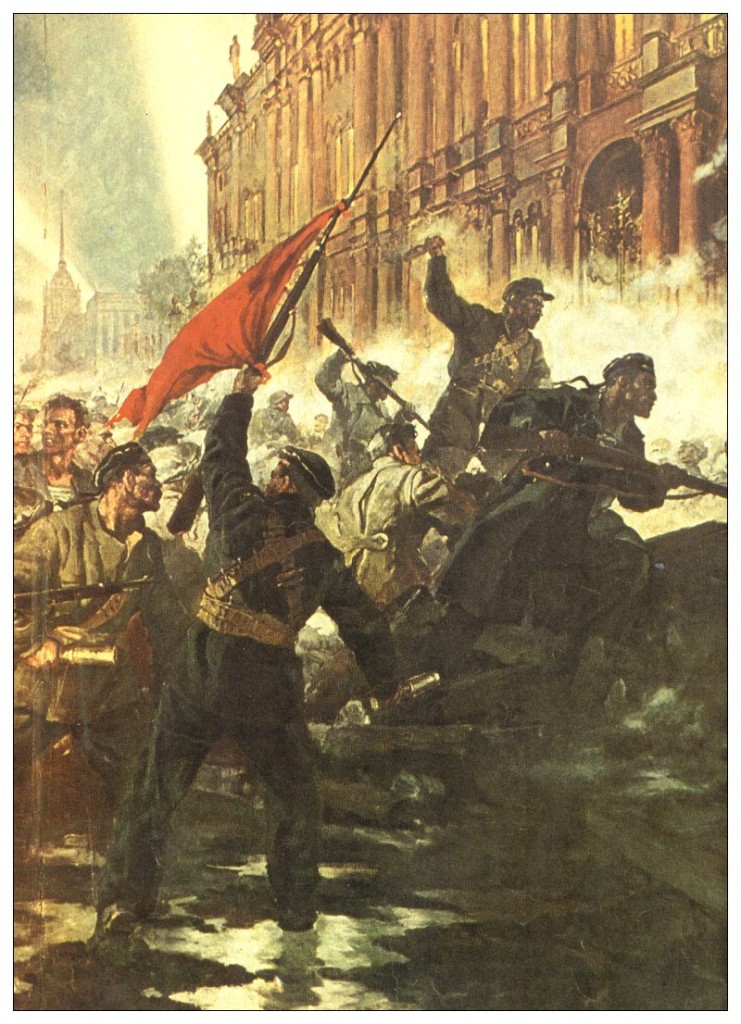
In the last hundred years Russia has had three revolutions that overthrew the leadership and changed the entire form of government. The first revolution happened with the “February Revolution” which occurred in March 1917, when the Tsar abdicated and a provisional government was established, headed first by Prince Georgii Lvov and then by Alexander Kerensky. This actually briefly created a struggling democratic government that ruled (or misruled) Russia for eight months. The next revolution was when the Bolsheviks bloodily throw that government out of power and took over in their “October Revolution” (which occurred in November under the new calendar). The third revolution occurred in December 1991 when the heads of Russia, Belarus and Ukraine decided that they would rule themselves and dismissed the communist government headed by Mikhail Gorbachev, dissolving the Soviet Union.

This is three successful revolutions in a hundred years, or one every 33 if you want to use an average. Of course, two occurred in an eight month period, and then it was 74 years before the next one occurred.

On the other hand, there have been some significant changes to the Russian governance that did not necessarily include large street protests. For example, the shift from Stalin to Khrushchev generated significant changes in how the country was run and managed. Communism under Khrushchev and its later leaders was very different from the leadership of Lenin or Stalin, when a communist society was being built, often with considerable brutality. It was a change from a state that was revolutionary to a more mature and stable dictatorship. It also introduced the idea of reform of the Soviet system, something that did not last long under Khruschchev, but would later influence Gorbachev.

The next significant change was the reform movement that started under Gorbachev in 1986 or was it Andropov in 1982? Gorbachev arrived in power in 1985, instituted “Perestroika” (restructuring) in 1986 “Glasnost” (openness) in 1988. These reforms were quickly followed by the ending of the Soviet Union in 1991, but it was a significant change in the governance of the Soviet Union for as long as it lasted.

Then there was another significant change in governance with the change from Yelstin to Putin in 2000. This moved the country from a troubled democracy to one that for all practical purposes over time has turned into a dictatorship.

The interesting aspect of all four of these last changes is their fundamentally peaceful nature. Three were done with little open protests and the collapse of the Soviet Union happened four months after the violence of the “August Coup.” Even though their impact was far reaching, they were hardly classic revolutions (unlike the two in 1917). They might be better described as reform movements or even palace coups, but they did significantly change the way the country was ruled. So, this is six major changes in how the country was ruled over a hundred year, or one every 17 years, with the longest being 37 years, being from the October Revolution in late 1917 to the demotion of Malenkov in early 1955 (who was eventually allowed to retire instead of being killed, which was a significant change in the Soviet system).

In contrast the United States has not had any revolutions in the last 100 years, and no significant changes in the way we are governed. The two biggest changes in our recent history was the “New Deal” package of reforms that came during the Great Depression of the 1930s and what I call our “cultural revolution” of the 1960s. They certainly were significant, hard to say if they were as significant as the three non-revolutionary changes in Russia. So, I would argue that Russia is more prone to revolution and revolutionary change than places like the United States, United Kingdom or many other modern democratic counties. This should not really be surprising.

But one more point about the “long-suffering” image of the Russian people. In World War I, Russia lost 1.1% of its population in the war and its government was overthrown (twice). In World War I, France lost 3.4% of its population while Britain & Ireland lost 1.6% (and Scotland lost 3.1%). Other countries that lost a higher percent of population killed than Russia are: Australia at 1.2%, New Zealand 1.5%, Italy 1.6%, Bulgaria 1.9%, Austria-Hungary 1.9%, Germany 3.0%, Rumania 3.3%, Turkey 3.7%, and poor Serbia at 5.7% of their population lost in World War I! (Just for comparison, the U.S. lost 0.1% of its population in World War I, see Niall Ferguson, Pity of War, page 299). The “long-suffering” Russia people seemed to have bailed out a little earlier and at less cost than most of the other major powers in World War I. As I also like to point out to people convinced of the softness of America and the firmness of the old Soviet Union, the U.S. lost 58,000 people after a 15 year commitment to Vietnam (1957 – 1973) and then withdrew. The Soviet Union lost 15,000 people after a 9 year commitment to Afghanistan (1979-1989) and then withdrew.

So, it would appear from a most casual look that there is not much of an argument that the Russian government is somehow or the other more immune to revolution or palace coups or other significant changes in ruling systems because of the “long-suffering” nature of the population. It appears that they are as willing as most to change things up and more willing than some.

Just to give one more number, Putin has been effectively in power for 16 years (since 2000).

Why Men Rebel?

In the 1960s, there were two big-budget quantitative historical studies conducted of the causes of revolution. One was by Ted Gurr of Princeton University and resulted in the 1970 book Why Men Rebel? The other similar effort was done by a husband and wife team of Ivo and Rosalind Feierabend out at San Diego State University. They published their data and results in a series of articles and in 1972 in a compilation book (Anger, Violence and Politics: Theories and Research). Ted Gurr’s work is much more widely known, although in the 1980s when I reviewed both of their works in depth, I found them to be similar and of equal quality.

Both Ted Gurr’s and the Feierabend’s work was based upon measuring political violence, which was a very relevant subject back in the 1960s. I believe that both projects were U.S. government funded. They both collected extensive data on violence in every county in the world in the post-WWII era (their data cut off was in the late 1960s) and created an index of political violence by country. They then built a multi-variant regression model to try to measure what causes those levels of violence.

Although they were completely separate and isolated efforts, using different data collections, they ended up pretty much reaching similar conclusions (much like what happened with my work and Andrew Hossack’s work). They were both cross-national studies that tried to determine the level of political violence in a country based on a range of factors. Like with any extensive quantitative analysis, there were a lot of elements and interesting findings in this work. But, they both put front and center a “relative deprivation” hypothesis of the causes of political violence (and/or rebellion). Basically, what this said was that if things are going well, and then they start going badly, this creates the highest chance for ‘regime change.”

So, for example, in their data sample the rich (or developed) countries tended to be very stable. Very poor countries (undeveloped) were less stable. But the least stable countries are those somewhere between rich and poor that are getting wealthier (what they called at the time developing countries). They tend to be stable when they are economically growing, but once the growth stops, they become unstable. If there is any validity to this hypothesis (and there certainly was using the twenty years of data from around 1948 to 1968), then this leads to me to wonder about the long-term stability of Russia and China.

A summary of Why Men Rebel is here: http://wikisum.com/w/Gurr:_Why_men_rebel. As the summery notes: “(3) “Progressive deprivation” [the J-curve]–expectations grow [we expect continued growth] and capabilities do to, but capabilities either don’t keep up or start to fall (pg 53)–modernization, depression in a growing country, or other change could cause this. [What he wrote in 1970 about this describes nicely what happened with the fall of the USSR.]”

It would be interesting, in light of almost 50 more years of data since they did their work, if someone took their regression models and ran the last 50 years of data through them to see how they did. I always like to see a little model validation (although this is rarely done).

The Russian Recession, Part Dva

I just wanted to add a little more data on the Russian recession. Apparently according to Citi Group analysts, the Russian economy is expected to contract 1.5% in 2016. It is probably too early to make predictions for 2017, and some of that is dependent on the price of oil.

The cuts in government spending in 2015 were 10% and the Russian government has said they are expecting another 10% budget cut in 2016. They are expected to run a budget deficit of around 4.4% of GDP according to Citi Group analysts.

Just to put this in context, it was estimated by CBO that as a result of sequestration that U.S. government discretionary spending (meaning not including Social Security and Medicare) in 2013 would decline by 5.6% and in 2014 by 3.6%. The cuts to the U.S. Defense budget was expect to be 6.4% for 2013 and 5.5% in 2014 (non-defense discretionary spending was a reduction of 4.7% in 2013 and 1.6% in 2014). I gather the real figures were close to these projections. I do not have the figures for 2015 near at hand, but I gather it was less.

During the height of the Great Recession in 2009, the U.S. government budget deficit was 9.8% of GDP. For 2015 it was 2.5% of GDP.

The Russian Recession

The Russian economy this last year shrunk 3.7% according to their own figures (the Ukrainian economy is also not doing very well). Just to put this in context, in 2009, during the worst economic year in the United States since the Great Depression, the U.S. economy shrunk 2.8% (and it only grew 0.3% in 2008 as the recession kicked in according to World Bank figures). United States unemployment figures rose from 4.7% in November 2007 to 10% in October 2009. The “Great Recession” officially ended in July 2009 and the economy grew 2.5% in 2010. The U.S. economy in 2014 grew 2.4% and the unemployment rate has just recently dropped to below 5%. Some people are saying that is too slow. Still, this provides context for a 3.7% contraction feels like. The Russian unemployment rate in 2014 was 5.4%.

The Russian economy was not a power house to begin with, being in 2014 only the tenth largest economy in the world, ranked just above Canada and just below India. Its economy was around one-tenth the size of the U.S. economy in 2014 ($17,348,071 million for the U.S. vice 1,860,597 for Russia according to United Nations). The U.S. economy constitutes something like 23-24% of the gross world product. With the current contraction, Russia’s economy may become smaller than Canada’s. Not sure this qualifies Russia as a world power, even with nukes.

US_share_of_world_GDP_since_1980
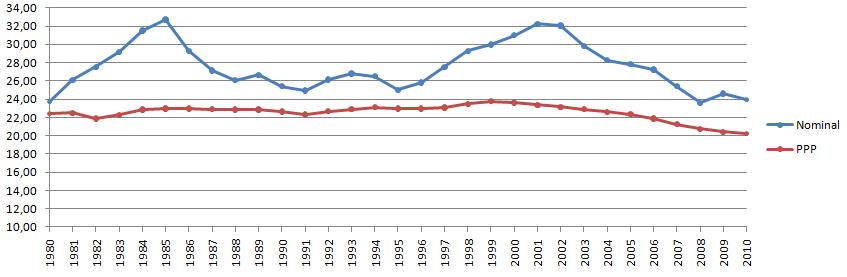
U.S. Share of World GDP (%) since 1980

It does not appear that this is the end of it. With oil down to $30 a barrel from a height of around $100, with China’s economy slowing down, with more oil coming to the market place due to the release of sanctions on Iran, it is expected that oil will remain below $40 a barrel for some time to come. Gas and oil make up something like 50% of the Russian government revenue (they have a 13% flat income tax). This is creating a massive economic and budget shortfall at a time when they are building up their military and engaged in activities in Ukraine and Syria. Of course, the Russian government has a lot of other expenditures besides defense. It is an interesting balancing act.

The Russian economy is expected to decline in 2016 also, although probably not as much as it did in 2015. The ruble has dropped precipitously compared to the dollar and Euro over the last couple of years (from below 30 to around 80 rubles per dollar). With trade sanctions still in place, Russia’s generally poor relations with most nations in Europe and the west, the Chinese economy slowing down, and oil prices remaining low; there is little reason to expect an immediate turn around.

The Russian recession is clearly deeper and probably will be longer than the U.S. “Great Recession.” But, while our recession lasted around a year and a half (2008 – 2009) and recovery has been slow, the Russian recession is clearly going to last longer. How much longer, we do not know. This is a potentially very long recession for them, and not surprising, this raises questions about internal political stability.

Ukraine Lost?

An article in the Bloomberg View caught my attention called “Russia and Ukraine Finally Break Up”. It is at: http://www.bloombergview.com/articles/2015-12-30/russia-and-ukraine-finally-break-up?cmpid=yhoo.headline

As everyone is pretty aware, Ukraine and Russia have been closely integrated throughout their history. The word for the Russians, come from the “Rus,” the original Swedish Viking established civilization centered around Kiev (now capital of Ukraine). Kiev is also where the Cyrillic alphabet and the original Russian Orthodox Church were developed. At the height of the Soviet Union, there were many Ukrainians in and about the Kremlin, with one of the eight leaders of the Soviet Union being Ukrainian (Chernenko). My mother-in-laws’ family were from the Ukrainian town of Radomysl, and were driven out of it during the same Russian Civil War my English grandfather was involved with. The family ended up in Kiev and Moscow. As Russian President Vladimir Putin has stated: “We in Russia have always considered Russians and Ukrainians to be one people. I still think so.” Ukraine and Russia have always been connected economically, culturally and often politically. What this article is showing is that there has now been a break economically.

There was also been a clear break politically. Up until the last year, the government of the independent Ukraine (independent since 1991) has swayed between Ukrainian oriented leaders and Russian oriented leaders. This was very much driven by the presence of 17% of the population being ethnic Russians and 67.5% of the population being primarily Russian speakers. Yet, this political break has occurred over the last year. The previously Russian oriented leader of Russia, the now exiled Yanukovich, in the election of 2010 led the first round with 36% of the vote. Even though he then won the run-off election against the Timoschenko with 49%, this third of the Ukrainian electorate seems to have been his core support, having garnered 39.3% in 2004 and 44.2% in the second run-off election of 2004 (with the first run-off results vacated due to extended protests). His support was strong the eastern and southern parts of Ukraine, especially among ethnic Russians and Russian leaning Ukrainians. With the events of the last year, the majority Russian areas of Crimea have been annexed by Russia and the parts of the provinces of Donetsk and Lugansk have become independent areas in rebellion. This pulls a significant number of Russian leaning voters out of the electorate. Needless to say, this has tilted the electoral power in Ukraine to guarantee that no Russian leaning leader can be elected in the near future (and Ukraine is still a functioning democracy).

If Ukraine has broken politically with Russia and is breaking economically with Russia, does this mean the country has truly and completely evolved into a new relationship with Russia that breaks significantly with the past and puts Ukraine on an truly independent course?

Is this Putin’s real legacy? Has he lost Ukraine, although he gained Crimea?  Is this the uncalculated trade-off resulting from Putin’s foreign policy where he gains Crimea (population 2 million) but losses Russian influence in Ukraine (population 44 million before losing Crimea). Is this the permanent shift of Ukraine from long historical ties to Russia to tying itself to the rest of Europe?

Murmansk

The Battleship the HMS Glory in Murmansk

I still have a half dozen blog posts to make on airpower and insurgencies, but I am going to shift directions for a little bit to discuss affairs in Eastern Europe.

In 1919 a young man from Liverpool ended up in Murmansk, Russia on board the British merchant ship the S.S. Nigeria. This British and allied intervention, which started towards the end of World War I, was now in the middle of the Russian Civil War. We know little of his actions at that time. Family legend is that he was with the British Marines fighting the Bolsheviks. His own memory was of constantly cleaning the fireplace irons. His record states that he was a ship assistant steward and was credited with a very good rating, as were 21 others on the ship. But there were also 11 men whose conduct was “decline to report.” This was clearly not a happy ship.

The ships log stated on 3 January 1919 that three of the firemen (listed by name) “…when ordered by Chief Engineer to work bunker coal from shelter deck into bunkers, refused to do so. When brought before me (the master) when I asked them to perform this duty they refused.” It continues: “They do not consider it their work, but will perform this work if paid one shilling per ton.”

On 4 February 1919, 10.12 AM it stated: “Sailors and firemen, combined not to allow the [S.S.] Competitor’s crew to bunker S.S. Nigeria, thereby endangering the frozen meat supply for the whole of the Northern Russian Forces at Murmansk. An armed guard from H.M.S. Glory arrived on board and arrested mutinous crew and took them away.”

Then on 4 March it states in the ships log: “The deck hands when ordered by chief office to discharge fifty empty coal barges to S.S. Competitor, also two men for coaling platform, they flatly refused, using threatening language. [name redacted] said we are on deck but it is damned little we intend doing.”

Finally, on 14 March 1919, 4 PM the log states: The following members of the crew [9 names redacted] has this day been convicted and sentenced to various periods of imprisonment for refusing [unreadable word] to duty, and [name redacted] to be discharged from the ship and pay a share of the expense of the court; and [three names redacted] pay a share of the expense of the court and return to ship. These men were tried before a Naval Court and His Britannic Majesty’s Consul and [10 names redacted] has been payed off articles. Wages deposited with H.B.M. Consul.”

On 10 April, one other crewman was found drunk and sent back to the UK at his own expense. Wages in full were handed to him.

There was also another curious problem, with an entry on 4 February 1919 at 4 PM stating: “On going into sailors and firemen forcastles, we found a quantity of stores which were apparently pilfered from the British and American Storerooms in the [S.S.] Nigeria. Also a sum of Russian money (3728 rubles).

At the time, a ruble was worth a whole lot more than it is now.

It was a curious piece of family history, with 10 out of 32 crew members of the S.S. Nigeria effectively revolting against the assigned work. My grandfather, William E. Catherall, the assistant stewart, was not among them. He never mentioned this incident to us, although we asked him about this trip.

William E. Catherall first went to sea on 22 September 1916, during World War I. He was 15 years old and lied about his age to join the merchant marine, as he claimed that many of the Liverpool kids did at that time. His father “died at sea” in 1905. On 7 June 1922, he left his ship in New York Harbor and did not return. There he made his living in New York owning and operating restaurants and bars. But this little trip to Murmansk, where he may have never even left the dock area, regardless of family legend, created a life-long interest in all things Russian in his descendants. This has resulted in a very large book on a tank battle there (Kursk: The Battle of Prokhorovka) and many other Russian influences in my life. A hundred year-old event in my family history leads us to the next series of threads.

Pouring Cold Water in ‘Boots on the Ground’

Both Chris and I questioned the proposed force size figures being bandied about by advocates and opponents of a U.S. ground force intervention to combat Daesh in Iraq and Syria. It turns out that we were not the only ones who found these figures to be curious. Kevin Benson, a retired U.S. Army colonel and the Deputy Chief of Staff, J-5 for the Army component of U.S. Central Command in 2002, found these proposed force levels to be far too low on simple logistical grounds. In an analysis published on War on the Rocks, he summarized the challenges and requirements:

In the case of a campaign against ISIL, the length of the lines of communication in this theater of war, from seaports and airports to key ISIL-held cities, is daunting. From our bases in Kuwait, it is roughly 1,000 kilometers to Mosul.  To Raqqa it is another 400 kilometers.  If we were to attack ISIL through the Syrian port of Latakia, the distance to Raqqa is 300 kilometers.  We can assume these lines of communication will be contested.   It may well only require two U.S. brigade combat teams, along with French, Russian, Turkish, Kurdish, Jordanian, and Iraqi forces to defeat ISIL in combat.  Nonetheless, it will take a lot more than 10,000 soldiers to deliver two brigade combat teams to Mosul and Raqqa in the form required to engage in battle with an enemy who clearly knows how to fight.

Two BCTs would be a minimum force level commitment just to defeat Daesh on the battlefield. They would clearly be insufficient for follow-on stability or counterinsurgency operations.

Benson concludes with an excellent point about the pitfalls of spitballing numbers in policy discussions:

Military and security professionals need to overcome policymakers’ fascination with low numbers of troops being the best course of action and their resultant tendency to micro-manage troop numbers down to the tactical level.  Military advice must be solid, fact-based advice on the structure we would need to put into place to truly defeat ISIL on its home turf.  After 14 years at war, we know no plan can look with certainty beyond initial contact with the enemy main body — the enemy gets a vote.  We know friction and the fog of battle are real.  Still, unsubstantiated numbers proposed through the media and other journals do not really help address the issue at hand.  Frankly, Sen. McCain and Gen. Zinni ought to realize that what they are saying about what it would take to defeat ISIL is not helpful in crafting the plans really needed to accomplish this task. Hurling low ball figures without considering the mathematics of war is not rendering sound military advice, it is chasing sound bites and re-tweets.

Force Ratios and Counterinsurgency IV

picture-17Much has changed since James Quinliven kicked off discussion over manpower and counterinsurgency. One of the most significant differences is the availability now of useful collections of historical data for analysis.


Previous posts in this series:
Force Ratios and Counterinsurgency
Force Ratios and Counterinsurgency II
Force Ratios and Counterinsurgency III


Dataset origins

Detailed below are the lineages for the data sets used in six of the seven analyses I have discussed. The cases used by Libicki and Friedman were drawn from databases created by several academic organizations and work by James Fearon and Daivd Laitin [1] and, Jason Lyall and Isaiah Wilson III [2]. Both Libicki and Friedman contributed additional research of their own to complete their datasets.

Datasets 01

The data used by Lawrence, CAA, and IDA was all researched and compiled by The Dupuy Institute (TDI). Both TDI’s Modern Insurgencies Spreadsheets (MISS) Database and CAA’s Irregular Warfare Database contain data on at least 75 variables for each historical case.

Datasets 02

The details of the dataset created and used by Hossack at Dstl have not been addressed in public forums, but it is likely to be similar.

Future directions for research

Given the general consensus of all of the studies that counterinsurgent manpower levels do correlate with outcome, the apparent disagreement over force ratio and troop density measures may not be as relevant as previously thought. More data collection and testing should be done to verify the validity of the postulated relationship between counterinsurgent force levels and the local population within an active area of operation.

Though there was consensus on the advantage of counterinsurgent manpower, there was no agreement as to its overall importance. More analysis is needed to examine just how decisive manpower advantages may be. Hossack and Goode suggested that a counterinsurgent manpower advantage may be important largely to prevent insurgent military success. Hossack and Friedman suggested that there may be points of diminishing manpower returns and Lawrence indicated that a force ratio advantage was decisive only against insurgencies with broad popular support. Given the potential difficulties in generating significant additional counterinsurgent manpower, it may be applicable and useful only under particular circumstances.

Due to the limitations of the available data, all of the studies based their analysis on data averages. The figures used for insurgent and counterinsurgent force sizes were usually selected from the highest annual totals across years or decades. All of the studies indicated the need to obtain more detailed data on individual cases to allow for more discreet and dynamic analysis to look for undetected links and patterns. Lawrence in particular called for examination of conditions before insurgencies begin and when they are just getting underway.

Friedman noted the value of quantitative analysis in helping to drive forward discussion and debate on defense and security topics. Research and analysis on insurgency and counterinsurgency was left to languish during the Vietnam War, only to be exhumed under the dire circumstances of the U.S. war in Iraq. It would be deeply unfortunate if promising new lines of inquiry were abandoned again.

Notes

[1] James D. Fearon, and David D. Laitin, “Ethnicity, Insurgency, and Civil WarAmerican Political Science Review 97, 1, Feb 2003

[2] Lyall, Jason and Isaiah Wilson III, “Rage Against the Machines: Explaining Outcomes in Counterinsurgency Wars,” International Organization 63, Winter 2009

Bombing Kosovo in 1999 versus the Islamic State in 2015

I just wanted to do a little ‘back of the envelope” comparison between these two air campaigns. In the case of Kosovo, if you believe the casualty figures provided virtue of Wikipedia (which are not always incorrect), they flew 38,004 sorties and killed 956 supposed hostiles (that is 956 killed, 5,173 wounded and 52 missing for a total of 6,181 casualties). Or, maybe that should be 10,484 “strike sorties.” Regardless, this was either 38 sorties per person killed or 10 “strike sorties” per person killed (missing are counted among the killed for this calculation). Or if based on total casualties, 6 sorties per casualty or 1.7 “strike sorties” per casualty. Now, only 35% of the bombs and missiles used were precision guided.

If you look at the link in my post “Bleeding an Insurgency to Death” you could surmise that in 2015 in Iraq and Syria, the U.S. and its allies dropped 28,714 “munitions.” They claim 25,500 killed. This is 1.13 “munitions dropped” per person claimed killed. So, one bomb kills one person.

Kosovo was 23,614 “air munitions” for 1,008 deaths or 6,181 casualties. This is 23 “air munitions” per person killed or 3.8 “air munitions” per casualty. So, Kosovo in 1999 is 23.42 ‘air munitions” per person killed while Syria and Iraq in 2015 is 1.13 “munitions dropped” per person claimed killed. This is an effectiveness improvement of over 20 times! Of course, these campaigns were conducted against different terrain and somewhat different circumstances that may favor one over the other. We have not evaluated those factors (after all, this is just “back-of-the-envelope” calculations).

Now, in Kosovo, only 35% of the bombs and missiles used were precision guided. Don’t know what the figure is now, but if it was 100%, and if we assumed that only the precision guided munitions in Kosovo hit anything (a questionable assumption), then we still end up with an effectiveness improvement of over seven times.

But maybe the 25,500 killed really means 25,500 killed and wounded (of which the majority would be wounded). In that case using the Kosovo figures for total casualties you end up with 3.82 “air munitions” per casualty versus 1.13 “munitions dropped” per casualty for Syria and Iraq. Again, if we completely discount the effectiveness of non-precision guided munitions in Kosovo, and assume that in Syria and Iraq 100% of the munitions are precision guided, then we end up with similar levels of effectiveness per casualty (1.34 “air munitions” versus 1.13 “munitions dropped” per casualty). There are a lot of “ifs” to get to this point.

Now, one should not put to much stock in the “back of the envelope” calculations, but something doesn’t quite line up here.