Mystics & Statistics

A blog on quantitative historical analysis hosted by The Dupuy Institute

Human Factors in Warfare: Measuring Morale

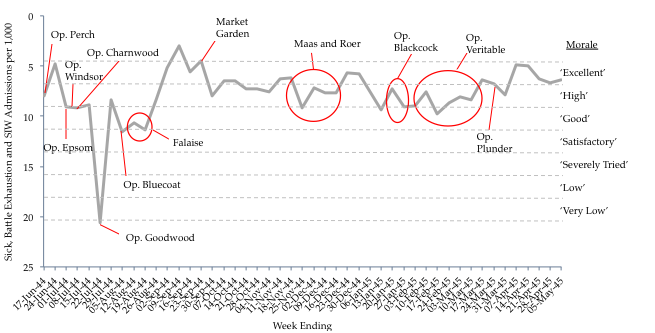
Figure One: Second Army, Weekly Admissions per 1,000 to General Hospitals and Casualty Clearing Stations for Sickness, Battle Exhaustion and SIW, 11 June 1944 to 5 May 1945. Morale scale equivalents are presented on the right hand Y-axis. (Dr. Jonathan Fennell)

One of Trevor Dupuy’s more important and controversial contributions to a theory of combat was the assertion that outcomes were dictated in part by behavioral factors, i.e. the human element. Among the influential human factors he identified were leadership, training, experience, and manpower quality. He also recognized the importance of morale.

Morale is an ephemeral quality of military forces and is certainly intangible. Yet even though it may not be easily defined and can probably never be quantified, troop morale is very real and can be very important as a contributor to victory or defeat. The significance of morale is probably inversely proportional to the quality of troops. A well-trained, well-led, cohesive force of veterans will fight well and effectively even if morale is low… Yet for ordinary armies, poor morale can contribute to defeat.[1]

Dr. Jonathan Fennell of the Defence Studies Department at King’s College London recently set out to determine if there were ways of measuring morale by looking at the combat experiences of the British Army in World War II. Fennell proposed

that the concept of morale has no place in a critical analysis of the past unless it is clearly differentiated from definitions associated solely or primarily with mood or cohesion and the group. Instead, for morale to have explanatory value, particularly in a combat environment, a functional conceptualisation is proposed, which, while not excluding the role of mood or group cohesion, focuses its meaning and relevance on motivation and the willingness to act in a manner required by an authority or institution.

Fennell constructed a multi-dimensional model of morale

By drawing on studies made across the social sciences and on primary archival evidence from the British and Commonwealth Army’s experiences in North Africa in the Second World War… It suggests that morale can best be understood as emerging from the subtle interdependencies and interrelationships of the many factors known to affect military means.

Fennell tested his methodology by developing a weekly morale score using bi-weekly censorship summaries of letters and correspondence from members of the British Second Army in the Northwest Europe Campaign in 1944-45.

These summaries proved a useful source to describe and ‘quantify’ levels of morale (through the use of a numerical morale scale). Where morale was described as ‘excellent’, it was awarded a score of 3. ‘High’ morale was given a score of 2 and ‘good’ morale was scored 1. ‘Satisfactory’ morale was given a score of 0 (neither positive or negative). Morale described as ‘severely tried’ was scored -1, while ‘low’ and ‘very low’ morale were scored -2 and -3 respectively.

He then correlated these scores with weekly statistics compiled by the British Second Army and 21st Army Group on rates of sickness, battle exhaustion, desertion, absence without leave (AWOL) and self-inflicted wounds (SIW).

The results of the correlation analysis showed that the tabulated rates (the combined rate of sickness, battle exhaustion, desertion, AWOL and SIW) had an extremely strong negative correlation with morale (-0.949, P<0.001), i.e. when morale was high, sickness rates etc. were low, and when morale was low, sickness rates etc. were high. This is a remarkably strong relationship and shows that these factors when taken together can be used as a quantitative method to assess levels of morale, at the very least for the Army and campaign under discussion.

The results are shown on the graph above. According to Fennell,

This analysis of morale supports the conclusions of much of the recent historiography on the British Army in Northwest Europe; morale was a necessary component of combat effectiveness (morale in Second Army was broadly speaking high throughout the victorious campaign); however, morale was not a sufficient explanation for Second Army’s successes and failures on the battlefield. For example, morale would appear to have been at its highest before and during Operation ‘Market Garden’. But ‘Market Garden’ was a failure. It is likely, as John Buckley has argued, that ‘Market Garden’ was a conceptual failure rather than a morale one. Morale would also appear to have been mostly high during operations in the Low Countries and Germany, but these operations were beset with setbacks and delays.

Fennell further explored the relationship between morale and combat performance, and combat performance and strategy, in his contribution to Anthony King, ed., Frontline: Combat and Cohesion in the Twenty-First Century (Oxford: Oxford University Press, 2015). An earlier version of his chapter can be found here.

NOTES

[1] Trevor N. Dupuy, Understanding Defeat: How To Recover From Loss In Battle To Gain Victory In War (New York: Paragon House, 1990), p. 67

First Guards Tank Army

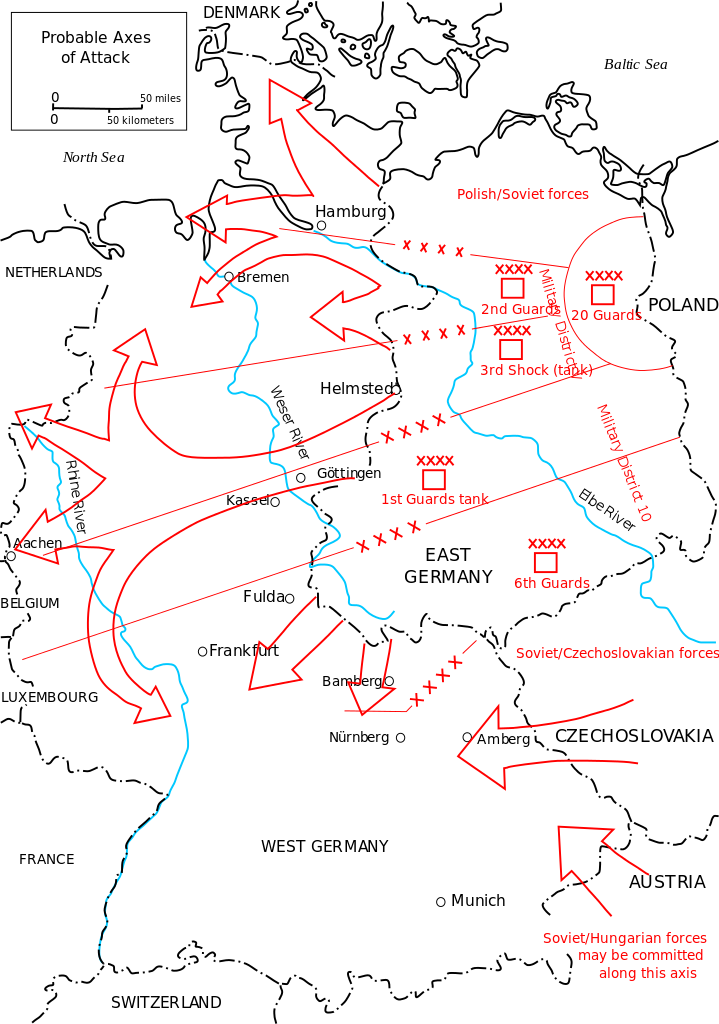
The map from 1976 in Shawn Woodford’s last post had two formations close to my heart, the First Tank Army (later renamed the First Guards Tank Army) and the Sixth Guards Army. The First Guards Tank Army is the formation going through the Fulda Gap. The Sixth Guards Army is to its left. Both formations played prominent roles in my Kursk book.

Also….Russia has brought back the First Guards Tank Army. It was disbanded in 1998 and re-activated in November 2014. See my previous blog post:

https://dupuyinstitute.dreamhosters.com/2016/04/01/next-stop-berlin/

Is The Fulda Gap Rhyming or Echoing?

Probable Axes of Attack of Warsaw Pact. Taken from Graham H. Turbiville, "Invasion in Europe--A Scenario," Army, November 1976, p. 19.
Probable Axes of Attack of Warsaw Pact. Taken from Graham H. Turbiville, “Invasion in Europe–A Scenario,” Army, November 1976, p. 19.

One of the great historical “what if’s” of recent memory was the imagined clash between the military forces of the U.S.-led North Atlantic Treaty Organization (NATO) and the Soviet-led Warsaw Pact in West Germany. This scenario – particularly a highly anticipated massive tank battle in the Fulda Gap on the north German plains – dominated the imaginations of U.S. military members, politicians, academics, strategic theorists, think tankers, and wargame nerds from the 1950s through the 1980s. Endless amounts of attention and effort were spent examining, debating, and thinking through a hypothetical war that seemed terribly real and imminent to so many at the time, but which also abruptly evaporated from the popular consciousness with the end of the Cold War in 1991. For many who came of age in the 1970s and 80s, however, merely mentioning the Fulda Gap evokes a collective nostalgic recollection of the prospect of a handful of plucky and resourceful NATO divisions battling it out with hordes of Soviet tank armies under the specter of global thermonuclear annihilation.

With this in mind, it has been rather fascinating to watch the unfolding debate over what is becoming an imagined clash between the military forces of the U.S.-led NATO and a resurgent Russia in Eastern Europe. Strategic analysts, doing what strategic analysts do, wargamed a hypothetical scenario involving a Russian invasion of the Baltic States and a NATO military intervention. The results of the wargame suggested that the current balance of forces highly favors the Russians.

So, what should we make of this? Well, the designers of the Baltic scenario wargame don’t want to scare anyone, but

It seems unlikely that Vladimir Putin intends to turn his guns on NATO any time soon. However, the consequences should he decide to do so are severe. Probably the best outcome — if the phrase has any meaning in this context — would be something like a new Cold War, with all the implications that bears. A war with Russia would be fraught with escalatory potential from the moment the first shot was fired; and generations born outside the shadow of nuclear Armageddon would suddenly be reintroduced to fears thought long dead and buried.

Wait, a new Cold War? Are you sure? Well, for some, the logic certainly points in a specific direction:

This means that the United States and its NATO allies need to be prepared for such an eventuality — and, better yet, prepared to such a degree that Moscow will recognize that pushing on the alliance will be too costly and risky to be worth trying. The U.S. defense budget request for next year (and accompanying commitments to further deployments in Europe), which is currently being used by the relevant House and Senate committees to inform their markups of the Fiscal Year 2017 defense authorization and appropriations bills, represents a major step forward in achieving this goal. It appropriately concentrates on the threat to U.S. and allied security posed by “great power” potential adversaries. It plusses up investments in key next-generation technologies in areas like space, unmanned systems, and cyber, while also preserving funding for the modernization of the nation’s nuclear deterrent. And it allocates $3.4 billion for the European Reassurance Initiative, while committing to reestablishing the permanent presence of an armored brigade combat team in Europe to strengthen the American posture there in the face of the most serious near-term threat to U.S. and allied interests — a resurgent and revisionist Russia.

For those of us old enough to remember, Baltic States is starting to sound an awful lot like Fulda Gap.

The Meaning of Military Expenditures II

In response to my last blog post I basically threw out a menu of possible conclusions. I received a very nicely thought out response to that post from Mike Johnson, which I felt was deserving its own blog post. His response is below (with his permission, of course):

With regard to the 20 April 2016 blog entry about military expenditures, I appreciated the list of possible conclusions and thought I would throw discussion points.

The comparison between US and other country defense spending is interesting, including the often mentioned statement that the US spends as much on defense as the next 10 countries combined.  I remember, from when I was in OPNAV N80 a couple of decades ago, that our NATO allies had twice as many active duty personnel and twice as many reservists as all the US Services combined. Yet, their combined defense budgets were less than what we were spending on our people in our military personnel and reserve personnel appropriations. Of course, back then Germany and France and many others still had conscription and less is usually spent on conscripts. But, it still leads to some serious questions about how to compare defense budgets when our allies could have twice the personnel and their total budgets were less than what we spent just on our personnel.  Several factors come into play. First, we have retirees being paid starting around age 40 or even earlier.  I don’t know of any other country that pays retirees before the mid-50s if not the 60s. Second, the retirement and a lot of the heath care are paid by other departments in most other governments, but in the US DoD pays into these programs.  Base pay for British military, by comparable grade, is actually more than in the US military; but we then add BAH and BAS on top (tax free); in the UK, the MOD subsidizes housing, but the serviceman has to pay a part. It isn’t clear whether the UK or the US serviceman of comparable grade has more “take home pay” so I don’t think the difference is that we pay our servicemen significantly more than other countries.

When it comes to Russia and China, in particular, conversions using market rates understate what is spent for most of the defense spending.  I had a colleague over the years–an expert on the Soviets–who would argue that Russian Federation soldiers had to be underfed, and suffering from malnutrition, because of the amount they were paid and given for meals.  I pointed out that meals certainly should use PPP and not market rates to convert and at the time the ratio between the two was about 7 (PPP converted into about 7 times as many US dollars compared with what market rates; it is less dramatic today but still to be of consideration). Anything internal to the Russian or Chinese economies should, in my opinion, use PPP for the exchange (which compares the cost of comparable items in each system).  This is particularly true of personnel pay, messing, accommodations, and most of logistics.  I am not sure about weapon systems. These are paid for internally, but they do have a connection to the outside world.

The way we count is different.  For example, funding is appropriated to the Services and to agencies in OSD as a top line that can be obligated.  How that is paid for may come from many sources including revenue collected by the Service.  In European budgets, we routinely see factors like total resource and then they subtract from that number expected receipts amounting to several percent of the budget.  In other words, they spend more because they can spend their revenues (such as payments made by service members for their housing) for whatever they want, but they are deducted from the top line used for comparison.

The US military does spend a lot more than any other country, despite the above factors.  Part of that is what it takes to maintain 6 regional combatant commands. Part of it is maintaining a constant level of forces around the world.  A war with most of our enemies is much more likely to be in their front yard and not ours.  We spend a lot on R&D and a lot on keeping equipment modern. And we spend a lot on training personnel.

PPP is purchasing power parity, which is a comparison between the currencies of two countries at which each currency when exchanged for the other will purchase the same quantity of goods as it purchases at home. So, for example, when the ruble dropped from 30 to 60 to a dollar, the Soviet defense budget suddenly did not really drop in half. So a direct comparison of exchange rates between countries often de-values the defense expenditures of less developed countries, where good and services are relatively cheap. Comparing countries based upon PPP tries to adjust for that.

Assessing the TNDA 1990-91 Gulf War Forecast

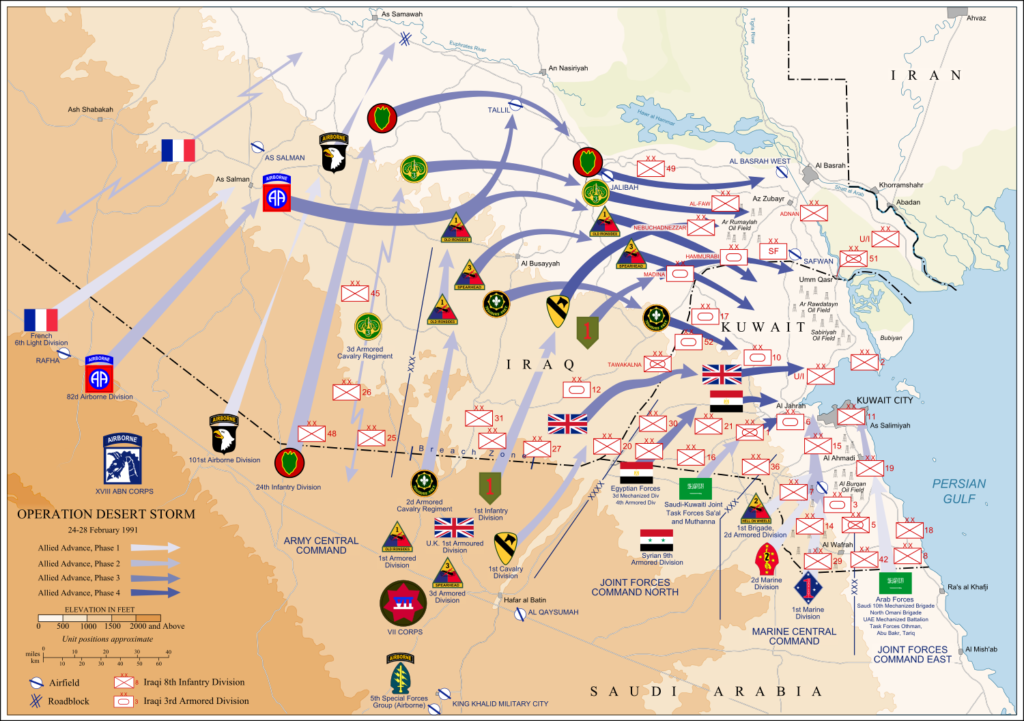
Map of ground operations of Operation Desert Storm starting invasion February 24-28th 1991. Shows allied and Iraqi forces. Special arrows indicate the American 101st Airborne division moved by air and where the French 6st light division and American 3rd Armored Cavalry Regiment provided security. Image created by Jeff Dahl and reposted under the terms of the GNU Free Documentation License, Version 1.2.

[NOTE: This post has been edited to more accurately characterize Trevor Dupuy’s public comments on TNDA’s estimates.]

Operation DESERT STORM began on 17 January 1991 with an extended aerial campaign that lasted 38 days. Ground combat operations were initiated on 24 February and concluded after four days and four hours, with U.S. and Coalition forces having routed the Iraqi Army in Kuwait and in position to annihilate surviving elements rapidly retreating northward. According to official accounting, U.S. forces suffered 148 killed in action and 467 wounded in action, for a total of 614 combat casualties. An additional 235 were killed in non-hostile circumstances.[1]

In retrospect, TNDA’s casualty forecasts turned out to be high, with the actual number of casualties falling below the lowest +/- 50% range of estimates. Forecasts, of course, are sensitive to the initial assumptions they are based upon. In public comments made after the air campaign had started but before the ground phase began, Trevor Dupuy forthrightly stated that TNDA’s estimates were likely to be too high.[2]

In a post-mortem on the forecast in March 1991, Dupuy identified three factors which TNDA’s estimates miscalculated:

  • an underestimation of the effects of the air campaign on Iraqi ground forces;
  • the apparent surprise of Iraqi forces; and
  • an underestimation of the combat effectiveness superiority of U.S. and Coalition forces.[3]

There were also factors that influenced the outcome that TNDA could not have known beforehand. Its estimates were based on an Iraqi Army force of 480,000, a figure derived from open source reports available at the time. However, the U.S. Air Force’s 1993 Gulf War Air Power Survey, using intelligence collected from U.S. government sources, calculated that there were only 336,000 Iraqi Army troops in and near Kuwait in January 1991 (out of a nominal 540,000) due to unit undermanning and troops on leave. The extended air campaign led a further 25-30% to desert and inflicted about 10% casualties, leaving only 200,000-220,000 depleted and demoralized Iraqi troops to face the U.S. and Coalition ground offensive.[4].

TNDA also underestimated the number of U.S. and Coalition ground troops, crediting them with a total of 435,000, when the actual number was approximately 540,000.[5] Instead of the Iraqi Army slightly outnumbering its opponents in Kuwait as TNDA approximated (480,000 to 435,000), U.S. and Coalition forces probably possessed a manpower advantage approaching 2 to 1 or more at the outset of the ground campaign.

There were some aspects of TNDA’s estimate that were remarkably accurate. Although no one foresaw the 38-day air campaign or the four-day ground battle, TNDA did come quite close to anticipating the overall duration of 42 days.

DESERT STORM as planned and executed also bore a striking resemblance to TNDA’s recommended course of action. The opening air campaign, followed by the “left hook” into the western desert by armored and airmobile forces, coupled with holding attacks and penetration of the Iraqi lines on the Kuwaiti-Saudi border were much like a combination of TNDA’s “Colorado Springs,” “Leavenworth,” and “Siege” scenarios. The only substantive difference was the absence of border raids and the use of U.S. airborne/airmobile forces to extend the depth of the “left hook” rather than seal off Kuwait from Iraq. The extended air campaign served much the same intent as TNDA’s “Siege” concept. TNDA even anticipated the potential benefit of the unprecedented effectiveness of the DESERT STORM aerial attack.

How effective “Colorado Springs” will be in damaging and destroying the military effectiveness of the Iraqi ground forces is debatable….On the other hand, the circumstances of this operation are different from past efforts of air forces to “go it alone.” The terrain and vegetation (or lack thereof) favor air attacks to an exceptional degree. And the air forces will be operating with weapons of hitherto unsuspected accuracy and effectiveness against fortified targets. Given these new circumstances, and considering recent historical examples in the 1967 and 1973 Arab-Israeli Wars, the possibility that airpower alone can cause such devastation, destruction, and demoralization as to destroy totally the effectiveness of the Iraqi ground forces cannot be ignored. [6]

In actuality, the U.S. Central Command air planners specifically targeted Saddam’s government in the belief that air power alone might force regime change, which would lead the Iraqi Army to withdraw from Kuwait. Another objective of the air campaign was to reduce the effectiveness of the Iraqi Army by 50% before initiating the ground offensive.[7]

Dupuy and his TNDA colleagues did anticipate that a combination of extended siege-like assault on Iraqi forces in Kuwait could enable the execution of a quick ground attack coup de grace with minimized losses.

The potential of success for such an operation, in the wake of both air and ground efforts made to reduce the Iraqi capacity for offensive along the lines of either Operation “Leavenworth’…or the more elaborate and somewhat riskier “RazzleDazzle”…would produce significant results within a short time. In such a case, losses for these follow-on ground operations would almost certainly be lower than if they had been launched shortly after the war began.[8]

Unfortunately, TNDA did not hazard a casualty estimate for a potential “Colorado Springs/ Siege/Leavenworth/RazzleDazzle” combination scenario, a forecast for which might very well have come closer to the actual outcome.

Dupuy took quite a risk in making such a prominently public forecast, opening his theories and methodology to criticism and judgement. In my next post, I will examine how it stacked up with other predictions and estimates made at the time.

NOTES

[1] Nese F. DeBruyne and Anne Leland, “American War and Military Operations Casualties: Lists and Statistics,” (Washington, D.C.: Congressional Research Service, 2 January 2015), pp. 3, 11

[2] Christopher A. Lawrence, America’s Modern Wars: Understanding Iraq, Afghanistan and Vietnam (Philadelphia, PA: Casemate, 2015) p. 52

[3] Trevor N. Dupuy, “Report on Pre-War Forecasting For Information and Comment: Accuracy of Pre-Kuwait War Forecasts by T.N. Dupuy and HERO-TNDA,” 18 March, 1991. This was published in the April 1991 edition of the online wargaming “fanzine” Simulations Online. The post-mortem also included a revised TNDM casualty calculation for U.S. forces in the ground war phase, using the revised assumptions, of 70 killed and 417 wounded, for a total of 496 casualties. The details used in this revised calculation were not provided in the post-mortem report, so its veracity cannot be currently assessed.

[4] Thomas A. Keaney and Eliot A. Cohen, Gulf War Airpower Survey Summary Report (Washington, D.C.: U.S. Department of the Air Force, 1993), pp. 7, 9-10, 107

[5] Keaney and Cohen, Gulf War Airpower Survey Summary Report, p. 7

[6] Trevor N. Dupuy, Curt Johnson, David L. Bongard, Arnold C. Dupuy, How To Defeat Saddam Hussein: Scenarios and Strategies for the Gulf War (New York: Warner Books, 1991), p. 58

[7] Gulf War Airpower Survey, Vol. I: Planning and Command and Control, Pt. 1 (Washington, D.C.: U.S. Department of the Air Force, 1993), pp. 157, 162-165

[8] Dupuy, et al, How To Defeat Saddam Hussein, p. 114

The Meaning of Military Expenditures

My last post was a data dump without a conclusion. I probably need to add one, although I usually avoid providing opinions. There is no shortage of opinions in the American blogosphere and political landscape. I think a little less opinion and a little more data has value. If you want opinions, there are plenty of services out there who specialize in that, and from any perspective and viewpoint that you like.

From the previous Military Expenditures posting one could draw a number of conclusions:

  1. That the American allies in NATO and Asia are not carrying their weight…or…
  2. The threat from Russia and China is grossly overstated
    1. Russia’s defense expenditures are $51.6 billion while NATO (not including the U.S.) is around $300 billion.
    2. China’s defense expenditures are $145.8 billion (or is it $215 billion) while Japan, South Korea and Taiwan’s combined are $85 billion.
    3. The U.S. is spending $597.5 billion.
    4. …or….
  3. The U.S. is spending too much on defense.
    1. Beware of the “military-industrial complex?”
    2. …or….
  4. This is the cost of being the world leader (3.3% of GDP on defense)….or…
  5. The higher U.S. defense expenditures are certainly justified because:
    1. We are covering against Russia ($51.6 billion)
    2. We are covering against China ($145.8 billion)
    3. Then there is ISIL….and….
    4. Iraq, Afghanistan and Somalia
    5. We have other missions, like nuclear deterrence, that adds to our cost.
    6. We need to continue to develop and maintain our technological edge, and that costs money.
    7. …or….
  6. The U.S. is spending too much on the wrong things…or….
  7. Maybe defense budget is not really a good measurement of military power….or…
  8. Maybe Russia and China are getting more “bang for the buck” then the U.S. and its western allies….or…
  9. Whatever else I forgot to mention….or….
  10. Some or all of the above.

Anyhow, one could interpret the figures in my previous post a number of different ways depending on their own political leanings and biases.

And…..I still didn’t really add a conclusion.

Forecasting the 1990-1991 Gulf War

DoD photo by Regina Ali

In my last post on the subject of prediction in security studies, I mentioned that TDI has a public forecasting track record. The first of these, and possibly the most well know, involves the 1990-1991 Gulf War.

On 13 December 1990, Trevor N. Dupuy, President of Trevor N. Dupuy & Associates (TNDA), testified before the House Armed Services Committee on the topic of the looming military confrontation between the military forces of the United States and United Nations Coalition allies and those of Iraq.[1] He offered TNDA’s assessment of the potential character of the forthcoming conflict, as well as estimates of the likely casualties that both sides would suffer. Dupuy published a refined and expanded version of TNDA’s analysis in January 1991.[2]

Based on a methodology derived from Dupuy’s combat models and synthesized data on historical personnel and material combat attrition, TNDA forecast a successful U.S. and Coalition air/ground offensive campaign into Kuwait.[3] Using publicly available sources, TNDA calculated that Iraqi forces in Iraq numbered 480,000, U.S. forces at 310,000, and Coalition allies at 125,000.

The estimated number of casualties varied based on a campaign anticipated to last from 10 to 40 days depending on five projected alternate operational scenarios:

  • Operation “Colorado Springs.” A 10-day air campaign aimed at achieving air superiority and attacking Iraq’s ground forces and war-making infrastructure. While TNDA believed an air campaign would proceed any ground offensive option, Dupuy suggested that it could potentially force an Iraqi surrender without the need for a land attack.
  • Operation “Bulldozer.” A frontal assault on Iraqi forces in Kuwait, lasting 10-20 days.
  • Operation “Leavenworth.” A double envelopment of Iraqi forces in Kuwait using an armored turning force in the west and a U.S. Marine amphibious landing in the east.
  • Operation “RazzleDazzle.” Similar to “Leavenworth,” but combined with an assault along the Iraq-Kuwait border by airborne/airmobile forces for a triple envelopment to encircle all Iraqi forces in Kuwait.
  • Operation “Siege.” A combination of an extended Operation “Colorado Springs” and ground force raids on all of Iraq’s borders. After 10-20 days, one of the three ground attack options (“Bulldozer,” “Leavenworth,” or “RazzleDazzle”) would be initiated to conclude the war.

Based on these assumptions, TNDA produced a range of casualty predictions for U.S. forces that TNDA asserted would probably be accurate to within +/- 50%. These ranged from a low of 380 for a 10-day “Colorado Springs” air-only campaign, to a top-end calculation of 16,645 for a 10-day “Colorado Springs” followed by a 20-day “Bulldozer” frontal assault.

TNDA’s Projection of Likely U.S. Casualties

Scenario Duration

Killed

Wounded

Total

+/-50%

Colorado Springs

10-40 days

190-315

190-315

380-630

Bulldozer*

10-20 days

1,858-2,068

8,332-9,222

10,190-11,290

5,335-16,645

Leavenworth*

10-20 days

1,454-1,664

6,309-7,199

7,763-8,863

4,122-12,995

RazzleDazzle*

10-20 days

1,319-1,529

5,534-6,524

6,853-8,053

3,717-11,790

Siege*

10-30 days

564-1,339

1,858-5,470

2,422-6,809

1,451-10,479

* Figures include air casualties

Based on these calculations, TNDA recommended the following course of action:

If the above figures are close to accurate (and history tells us they should should be), then the proper solution is to begin the war with the air campaign of Operation “Colorado Springs.” If this should result in an Iraqi surrender, so much the better. If not, then after about ten days of “Colorado Springs,“ to continue the air campaign for about ten more days while initiating Operation “Siege.” If this does not bring about an Iraqi surrender, the ground campaign should be concluded with Operation “RazzleDazzle.” If this has not brought about an Iraqi surrender, then an advance should be made through the desert to destroy any resisting Iraqi forces and to occupy Baghdad if necessary.[4]

In my next post, I will assess the accuracy of TNDA’s forecast and how it stacked up against others made at the time.

Notes

[1] Armed Services Committee, U.S. House of Representatives, Testimony of Col. T. N. Dupuy, USA, Ret. (Washington D.C.: 13 December 1990)

[2] Trevor N. Dupuy, Curt Johnson, David L. Bongard, Arnold C. Dupuy, If War Comes, How To Defeat Saddam Hussein (McLean, VA.: HERO Books, 1991); subsequently republished as How To Defeat Saddam Hussein: Scenarios and Strategies for the Gulf War (New York: Warner Books, 1991).

[3] These are the Quantified Judgement Model (QJM) and Tactical Numerical Deterministic Model (TNDM). Dupuy’s methodological approach and his first cut on a Gulf War estimate are described in Chapter 7 of Trevor N. Dupuy, Attrition: Forecasting Battle Casualties and Equipment Losses in Modern War (McLean, VA.: HERO Books, 1990).

[4] Dupuy, et al, How To Defeat Saddam Hussein, 126

Military Expenditures

The American political campaign has ended up discussing NATO recently, including one candidate who states that NATO is “obsolete.” The sense is that America’s allies are not pulling their weight. Let us just look at some comparative defense budgets for a moment. Most figures below are estimates for 2015 from the International Institute of Strategic Studies (IISS), a private UK based organization. I cannot vouch for their accuracy, but they have been doing this for a while.

United States: $597.5 Billion or 3.3% of GDP

Now, our NATO allies are spending much less. The big spender is the United Kingdom at 56.2 billion or 2% of their GDP. This is followed by Germany at 36.6 billion which is only 1.1% of their rather large GDP (largest economy in Europe). France is at 32.0 billion or 1.9% of their GDP (note that the SIPRI figures are much higher for France). Other large NATO countries include:

Turkey…..….22.6….2.2% (these are 2014 SIPRI figures)

Italy….…..….21.1….1.1%

Canada………14.0…..0.9%

Spain…………10.7…..0.9%

Poland…..…..10.3….2.1%

Netherlands…10.1.…1.2% (these are 2014 SIPRI figures)

Total NATO expenditures (not including United States) for 2014 was $310 billion (SIPRI figures). I gather it is now somewhat less. It was the goal once that every member of NATO spent 2% of their GDP on national defense. Many NATO members are far below that goal.

So, it would appear that the U.S. spending 3.3% of its GDP on defense, while no major country in NATO is spending much more than 2% of its GDP on defense. In contrast Russia is spending $51.6 billion or 4.1% of GDP. So certainly between England, Germany, France, Italy, Turkey, Spain, Poland and the Netherlands they are spending at least $195.2 billon on defense, which is almost four times what Russia is spending.

If one looks to the Pacific, one sees the same pattern. The United States spends 597.5 billion on defense or 3.3%. Our ally Japan spends 41.4 billion or 1.0% of GDP. South Korea, sitting opposite the very unstable and dangerous North Korea, spends 33.4 million on defense or 2.4% of GDP. Taiwan, still claimed as a province by China, spends 10.2 billion or 1.9% of GDP.

In contrast China is spending 145.8 billion on defense or 1.2% of its GDP.


Now these are mostly IISS figures, there are somewhat different figures provided by the Stockholm International Peace Research Institute (SIPRI). For example they have the U.S. budget figures at 596.0 (vice 597.5) but this makes up 3.9% of GDP (vice 3.3%). Not sure why there is such a big difference in the figures for percent of GDP. They have a much higher figure for China (215 billion at 1.9% of GDP), Russia (66.4 billion at 5.4% of GDP) and France (50.9 billion at 2.1% of GDP). They have a world total figure of 1,676 billion (of which the United States spending makes up 35.6%) while the IISS has a world total figure of 1,563 billion (of which the United States spending makes up 38.2%).

Of course, this does not address how much “bang for the buck” people are getting.

Why the Russian Economy is Tumbling

The link here is to a New York Times article that nicely summarizes the situation with the Russian economy. Nothing new here, but nicely presented:

Why the Russian Economy is Tumbling

A few highlights

  1. The country has been operating at a deficit since 2012.
  2. Its Reserve Fund is slated to run out by 2017.
  3. Experts suggest this crisis is more alarming (it is a note on the Budget balance chart).
  4. Russian intervention in Syria cost Russia $482 million (not sure where that figure came from).
  5. Russia is decreasing its defense budget by 5%.
  6. The Russian defense budget is over $50 billion (in contrast, the U.S. defense budget is 610 billion for 2013).
  7. It can, of course, tap into the National Wealth Fund (raid their pensions to cover existing expenses).


History News Network (HNN)

hnn-logo-new

We do have a half-dozen links listed down at the bottom of the right hand column of this blog. One is the History News Network

I have five articles posted on HNN. Two of them being posts from this blog. They are:

How Military Historians Are Using Quantitative Analysis

Did the Pentagon Learn from Vietnam?

Defeating an Insurgency by Air

Did I Just Write the Largest History Book Ever?

Are Russians Really Long-Suffering

Now, they do choose the headlines, and sometimes that gives a different feel to the article. So for example, one of my blog posts was titled “Russian Revolutions.” The exact same article on the HNN is titled “Are Russians Really Long-Suffering.” This apparently got a couple of people up in arms because the article did not talk about all the famines and oppression in Russia and the Soviet Union. It did not, because it was about revolutions, and in particular was about revolutions that succeeded. The famines in the 1890s, 1920s and 1930s did not directly lead to a successful revolution (a point that I think is pretty significant).

The article “Did I Just Write…” is actually a shorter version of an article I posted on the Aberdeen Bookstore website: Long version of “Did I Just Write…” Part of the reason that I wrote that article was to see if someone would come out of the woodwork and post that there was a larger book published (usually these postings start with something like “the author is an idiot because….”). I did not get that for this article. This does sort of confirm my suspicion that this is indeed the largest single volume history book ever written (no disrespect intended for the 11-volumes done by the Durants…which were four million words and 10,000 pages). I wonder if this is something I should submit to the Guinness Book of World Records? Will I get free beer for that?