Mystics & Statistics

A blog on quantitative historical analysis hosted by The Dupuy Institute

Syrian Disengagement

The United States has struggled with what to do in Syria. We never had good relations with the dictatorial Assad family. Their civil war started with civil protests on 15 March 2011 as part of the Arab Spring. The protests turned bloody with over a thousand civilian dead (have no idea how accurate this number is) and thousands arrested. It had turned into a full civil war by late July 2011. Our initial response was to remain disengaged.

It is only when Assad used chemical weapons against his own population, similar to Saddam Hussein of Iraq, that we finally considered intervening. President Obama announced a “red line” on 20 August 2012 against the use of chemical weapons. Assad’s forces violated this on 17 October 2012 in Salqin, 23 December 2012 at Al-Bayadah, most notably in 19 March 2013 in Aleppo and in several other locations during March and April,  29 April 2013 in Saraqib and a couple of more incidents in May, 21 August 2013 in Ghouta and several other incidents in August. All attacks used the nerve agent Sarin. Instead of responding militarily, this then turned into a coordinated international effort to eliminate all the Syria chemical weapons, which was done in conjunction with Russia. This was not entirely successful, as repeated later incidences would demonstrate.

In my opinion, the United States should have intervened with considerable force in March 2013 if not before. This would include an significant air campaign, extensive aid to the rebels, and a small number of advisors. This would have certainly entailed some American casualties. Perhaps the overall results would have been no better than Libya (which has also been in civil war from 2011). But, at least with Libya we did got rid of Muammar Gaddafi in October 2011. Gaddafi had most likely organized a terrorist attack against the United States. This was the 1988 Lockerbie bombing of Pan Am Flight 103 which killed 270 people, including 190 Americans (and was most likely conducted in response to Reagan’s 1986 U.S. bombing of Libya).

Still, an intervention in Syria at that point may well have ended Assad’s regime and empowered a moderate Sunni Arab force that could control the government. It may have also forestalled the rise of ISIL. Or it may not have…it is hard to say. But, what happened over the next eight years, with the rise of ISIL, their seizure of Mosul in Iraq, and the extended civil war, was probably close to a worse case scenario. This was a case where an early intervention may have lead to a more favorable result for us. I suspect that our intervention in Libya probably created a more favorable result than if we had not intervened.

The problem in Syria is that Assad represents a minority government of Shiite Arabs. They make up around 13% of the population (largest group are Alawites). This lords over a population of 69-74% Sunni (most are Arabs but it includes Kurds and Turcoman). In the end, given enough decades and enough violence, the majority will eventually rule. It is hard to imagine in this day and age that a minority can continue to rule forever, although Bashir Assad and his father have now ruled over Syria for almost 49 years. Part of what makes that possible is that around 10% of the population of Syria is Christian and 3% Druze. They tend to side with and support the Alawites, as a dominant, non-democratic Sunni rule would be extremely prejudiced against them. Needless to say, something like an Islamic State would be a nightmare scenario for them. So, for all practical purposes, Assad tends to have the support of at least a quarter of the population. From their central position, and armed by Russia, this makes them a significant force.

So, the question becomes, should the United States now disengage from Syria, now that the Islamic States is gone (but as many as 3,000 of their fighters remain)? Right now, we have at least 2,000 troops in and around Syria, with most of them outside of Syria (mostly based with our fellow NATO member Turkey). We have lost a total of two people since this affair started. We are allied with and supporting small moderate Sunni Arab groups and some Kurdish groups (which Turkey is opposed to and sometimes engages in combat). Turkey is supporting some of its own moderate Sunni Arab groups. Also in Syria is the radical Arab groups, Al-Qaeda and of course, the Islamic State (whose leader is still at large) and Al-Nusrah. So, is it time to leave?

What are the possible outcomes if we leave?

  1. Assad will win the civil war and we will have “peace in our time” (written with irony).
    1. As the moderate Sunni groups are primarily based in Turkey they may not disappear anytime soon, especially if they are still being given support from Saudi Arabia and other Arab nations, even if the U.S. withdraws support.
    2. The Kurdish groups are still in Syria and probably not going away soon. They have some support from the Kurds in Iraq.
    3. Al-Qaeda and ISIL and other radical groups are probably not going away as long as Syria is ruled by the Alawites.
    4. There is a border with Iraq that facilitates flow of arms and men in both directions.
  2. The civil war will continue at a low level.
    1. A pretty likely scenario given the points above.
    2. Will this allow for the resurgence of radical Islamist groups?
  3. The civil war will continue at significant intensity for a while.
    1. Hard to say how long people can maintain a civil war, but the war in Lebanon went on for a while (over 15 years, from 1975 to 1990).
    2. This will certainly allow for the resurgence of radical Islamist groups.
  4. We will have a period of relative peace and then there will be a second civil war later.
    1. The conditions that lead to the first revolt have not been corrected in any manner.
    2. Syria is still a minority ruled government.
    3. This could allow for the resurgences of radical Islamist groups.
  5. There is a political compromise and joint or shared rule.
    1. I don’t think this was ever on the Assad’s agenda before, and will certainly not be now.
  6. Assad is overthrown.
    1. This is extremely unlikely, but one cannot rule out an internal Alawite coup by a leadership with a significantly different view and approach.
    2. As it is, it does not look like he is going to be defeated militarily any time soon.

So, where does continued U.S. engagement or disengagement help or hinder in these scenarios?

A few related links:

  1. Map of situation in Syria (have no idea how accurate it is): https://www.aljazeera.com/indepth/interactive/2015/05/syria-country-divided-150529144229467.html
  2. Comments by Lindsey Graham on Syria: https://www.yahoo.com/news/republican-senator-graham-warns-against-syria-troop-withdrawal-165314872.html
  3. More Maps: http://www.newsweek.com/russia-says-syria-war-nearly-over-trump-claims-us-leave-very-soon-866770


Response

A fellow analyst posted an extended comment to two of our threads:

C-WAM 3

and

Military History and Validation of Combat Models

Instead of responding in the comments section, I have decided to respond with another blog post.

As the person points out, most Army simulations exist to “enable students/staff to maintain and improve readiness…improve their staff skills, SOPs, reporting procedures, and planning….”

Yes this true, but I argue that this does not obviate the need for accurate simulations. Assuming no change in complexity, I cannot think of a single scenario where having a less accurate model is more desirable that having a more accurate model.

Now what is missing from many of these models that I have seen? Often a realistic unit breakpoint methodology, a proper comparison of force ratios, a proper set of casualty rates, addressing human factors, and many other matters. Many of these things are being done in these simulations already, but are being done incorrectly. Quite simply, they do not realistically portray a range of historical or real combat examples.

He then quotes the 1997-1998 Simulation Handbook of the National Simulations Training Center:

The algorithms used in training simulations provide sufficient fidelity for training, not validation of war plans. This is due to the fact that important factors (leadership, morale, terrain, weather, level of training or units) and a myriad of human and environmental impacts are not modeled in sufficient detail….”

Let’s take their list made around 20 years ago. In the last 20 years, what significant quantitative studies have been done on the impact of leadership on combat? Can anyone list them? Can anyone point to even one? The same with morale or level of training of units. The Army has TRADOC, the Army Staff, Leavenworth, the War College, CAA and other agencies, and I have not seen in the last twenty years a quantitative study done to address these issues. And what of terrain and weather? They have been around for a long time.

Army simulations have been around since the late 1950s. So at the time these shortfalls are noted in 1997-1998, 40 years had passed. By their own admission, these issues had not been adequately addressed in the previous 40 years. I gather they have not been adequately in addressed in the last 20 years. So, the clock is ticking, 60 years of Army modeling and simulation, and no one has yet fully and properly address many of these issues. In many cases, they have not even gotten a good start in addressing them.

Anyhow, I have little interest in arguing these issues. My interest is in correcting them.

Assessing The Assessments Of The Military Balance In The China Seas

“If we maintain our faith in God, love of freedom, and superior global airpower, the future [of the US] looks good.” — U.S. Air Force General Curtis E. LeMay (Commander, U.S. Strategic Command, 1948-1957)

Curtis LeMay was involved in the formation of RAND Corporation after World War II. RAND created several models to measure the dynamics of the US-China military balance over time. Since 1996, this has been computed for two scenarios, differing by range from mainland China: one over Taiwan and the other over the Spratly Islands. The results of the model results for selected years can be seen in the graphic below.

The capabilities listed in the RAND study are interesting, notable in that the air superiority category, rough parity exists as of 2017. Also, the ability to attack air bases has given an advantage to the Chinese forces.

Investigating the methodology used does not yield any precise quantitative modeling examples, as would be expected in a rigorous academic effort, although there is some mention of statistics, simulation and historical examples.

The analysis presented here necessarily simplifies a great number of conflict characteristics. The emphasis throughout is on developing and assessing metrics in each area that provide a sense of the level of difficulty faced by each side in achieving its objectives. Apart from practical limitations, selectivity is driven largely by the desire to make the work transparent and replicable. Moreover, given the complexities and uncertainties in modern warfare, one could make the case that it is better to capture a handful of important dynamics than to present the illusion of comprehensiveness and precision. All that said, the analysis is grounded in recognized conclusions from a variety of historical sources on modern warfare, from the air war over Korea and Vietnam to the naval conflict in the Falklands and SAM hunting in Kosovo and Iraq. [Emphasis added].

We coded most of the scorecards (nine out of ten) using a five-color stoplight scheme to denote major or minor U.S. advantage, a competitive situation, or major or minor Chinese advantage. Advantage, in this case, means that one side is able to achieve its primary objectives in an operationally relevant time frame while the other side would have trouble in doing so. [Footnote] For example, even if the U.S. military could clear the skies of Chinese escort fighters with minimal friendly losses, the air superiority scorecard could be coded as “Chinese advantage” if the United States cannot prevail while the invasion hangs in the balance. If U.S. forces cannot move on to focus on destroying attacking strike and bomber aircraft, they cannot contribute to the larger mission of protecting Taiwan.

All of the dynamic modeling methodology (which involved a mix of statistical analysis, Monte Carlo simulation, and modified Lanchester equations) is publicly available and widely used by specialists at U.S. and foreign civilian and military universities.” [Emphasis added].

As TDI has contended before, the problem with using Lanchester’s equations is that, despite numerous efforts, no one has been able to demonstrate that they accurately represent real-world combat. So, even with statistics and simulation, how good are the results if they have relied on factors or force ratios with no relation to actual combat?

What about new capabilities?

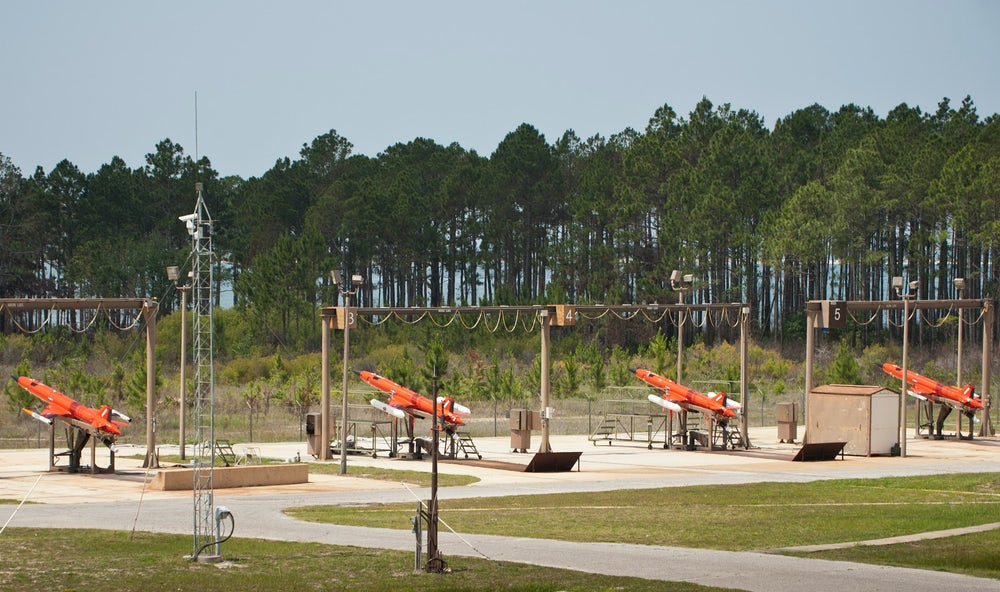
As previously posted, the Kratos Mako Unmanned Combat Aerial Vehicle (UCAV), marketed as the “unmanned wingman,” has recently been cleared for export by the U.S. State Department. This vehicle is specifically oriented towards air-to-air combat, is stated to have unparalleled maneuverability, as it need not abide by limits imposed by human physiology. The Mako “offers fighter-like performance and is designed to function as a wingman to manned aircraft, as a force multiplier in contested airspace, or to be deployed independently or in groups of UASs. It is capable of carrying both weapons and sensor systems.” In addition, the Mako has the capability to be launched independently of a runway, as illustrated below. The price for these vehicles is three million each, dropping to two million each for an order of at least 100 units. Assuming a cost of $95 million for an F-35A, we can imagine a hypothetical combat scenario pitting two F-35As up against 100 of these Mako UCAVs in a drone swarm; a great example of the famous phrase, quantity has a quality all its own.

A battery of Kratos Aerial Target drone ready for take off. One of the advantages of the low-cost Kratos drones are their ability to get into the air quickly. [Kratos Defense]

How to evaluate the effects of these possible UCAV drone swarms?

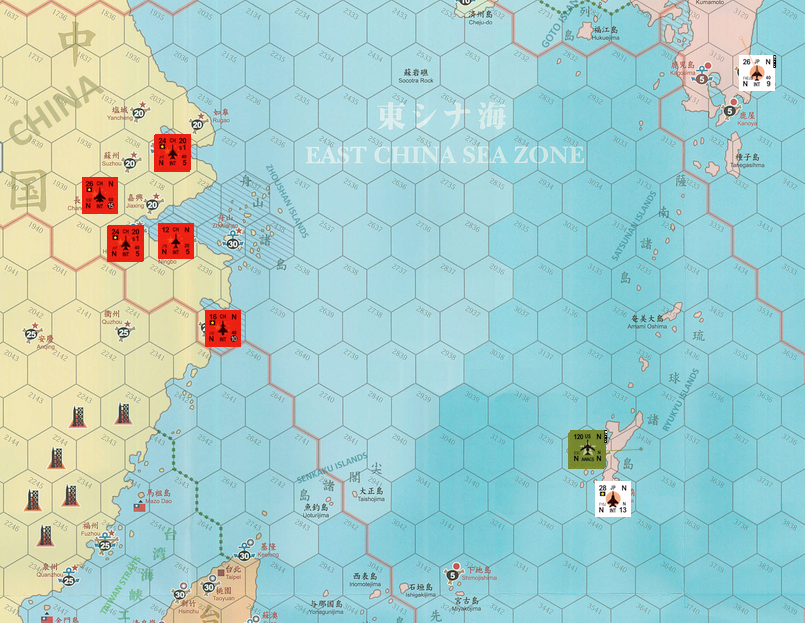
In building up towards the analysis of all of these capabilities in the full theater, campaign level conflict, some supplemental wargaming may be useful. One game that takes a good shot at modeling these dynamics is Asian Fleet.  This is a part of the venerable Fleet Series, published by Victory Games, designed by Joseph Balkoski to model modern (that is Cold War) naval combat. This game system has been extended in recent years, originally by Command Magazine Japan, and then later by Technical Term Gaming Company.

Screenshot of Asian Fleet module by Bryan Taylor [vassalengine.org]

More to follow on how this game transpires!

C-WAM 3

Now, in the article by Michael Peck introducing C-WAM, there was a quote that got our attention:

“We tell everybody: Don’t focus on the various tactical outcomes,” Mahoney says. “We know they are wrong. They are just approximations. But they are good enough to say that at the operational level, ‘This is a good idea. This might work. That is a bad idea. Don’t do that.’”

Source: https://www.govtechworks.com/how-a-board-game-helps-dod-win-real-battles/#gs.ifXPm5M

I am sorry, but this line of argument has always bothered me.

While I understand that no model is perfect, that is the goal that modelers should always strive for. If the model is a poor representation of combat, or parts of combat, then what are you teaching the user? If the user is professional military, then is this negative training? Are you teaching them an incorrect understanding of combat? Will that understanding only be corrected after real combat and loss of American lives? This is not being melodramatic…..you fight as you train.

We have seen the argument made elsewhere that some models are only being used for training, so…….

I would like to again bring your attention to the “base of sand” problem:

https://dupuyinstitute.dreamhosters.com/2017/04/10/wargaming-multi-domain-battle-the-base-of-sand-problem/

As always, it seems that making the models more accurate seems to take lower precedence to whatever. Validating models tends to never be done. JICM has never been validated. COSAGE and ATCAL as used in JICM have never been validated. I don’t think C-WAM has ever been validated.

Just to be annoyingly preachy, I would like to again bring your attention to the issue of validation:

Military History and Validation of Combat Models


TDI Friday Read: Links You May Have Missed, 30 March 2018

This week’s list of links is an odds-and-ends assortment.

David Vergun has an interview with General Stephen J. Townshend, commander of the U.S. Army Training and Doctrine Command (TRADOC) on the Army website about the need for smaller, lighter, and faster equipment for future warfare.

Defense News’s apparently inexhaustible Jen Judson details the Army’s newest forthcoming organization, “US Army’s Futures Command sets groundwork for battlefield transformation.”

At West Point’s Modern War Institute, Army Lionel Beehner, Liam Collins, Steve Ferenzi, Robert Person and Aaron Brantly have a very interesting analysis of the contemporary Russian approach to warfare, “Analyzing the Russian Way of War: Evidence from the 2008 Conflict with Georgia.”

Also at the Modern War Institute, Ethan Olberding examines ways to improve the planning skills of the U.S. Army’s junior leaders, “You Can Lead, But Can You Plan? Time to Change the Way We Develop Junior Leaders.”

Kyle Mizokami at Popular Mechanics takes a look at the state of the art in drone defenses, “Watch Microwave and Laser Weapons Knock Drones Out of the Sky.”

Jared Keller at Task & Purpose looks into the Army’s interest in upgunning its medium-weight armored vehicles, “The Army Is Eyeing This Beastly 40mm Cannon For Its Ground Combat Vehicles.”

And finally, MeritTalk, a site focused on U.S. government information technology, has posted a piece, “Pentagon Wants An Early Warning System For Hybrid Warfare,” looking at the Defense Advanced Research Projects Agency’s (DARPA) ambitious Collection and Monitoring via Planning for Active Situational Scenarios (COMPASS) program, which will incorporate AI, game theory, modeling, and estimation technologies to attempt to decipher the often subtle signs that precede a full-scale attack.

‘Love’s Tables’: U.S. War Department Casualty Estimation in World War II

The same friend of TDI who asked about ‘Evett’s Rates,” the British casualty estimation methodology during World War II, also mentioned that the work of Albert G. Love III was now available on-line. Rick Atkinson also referenced “Love’s Tables” in The Guns At Last Light.

In 1931, Lieutenant Colonel (later Brigadier General) Love, then a Medical Corps physician in the U.S. Army Medical Field Services School, published a study of American casualty data in the recent Great War, titled “War Casualties.”[1] This study was likely the source for tables used for casualty estimation by the U.S. Army through 1944.[2]

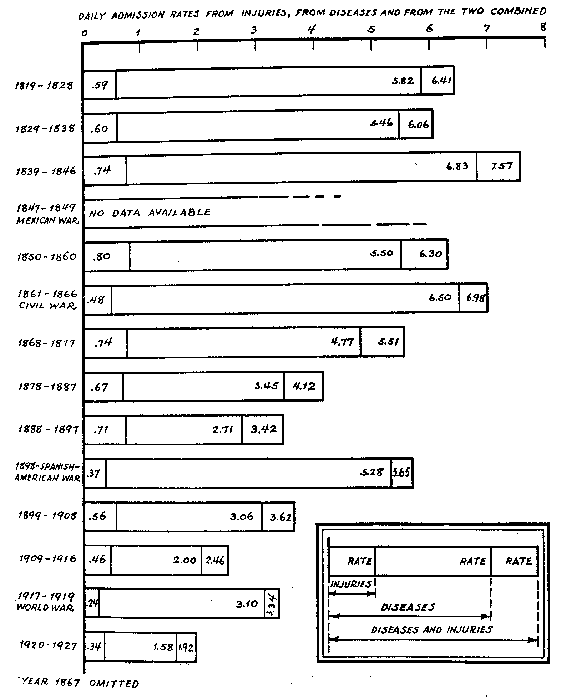
Love, who had no advanced math or statistical training, undertook his study with the support of the Army Surgeon General, Merritte W. Ireland, and initial assistance from Dr. Lowell J. Reed, a professor of biostatistics at John Hopkins University. Love’s posting in the Surgeon General’s Office afforded him access to an array of casualty data collected from the records of the American Expeditionary Forces in France, as well as data from annual Surgeon General reports dating back to 1819, the official medical history of the U.S. Civil War, and U.S. general population statistics.

Love’s research was likely the basis for rate tables for calculating casualties that first appeared in the 1932 edition of the War Department’s Staff Officer’s Field Manual.[3]

Battle Casualties, including Killed, in Percent of Unit Strength, Staff Officer’s Field Manual (1932).

The 1932 Staff Officer’s Field Manual estimation methodology reflected Love’s sophisticated understanding of the factors influencing combat casualty rates. It showed that both the resistance and combat strength (and all of the factors that comprised it) of the enemy, as well as the equipment and state of training and discipline of the friendly troops had to be taken into consideration. The text accompanying the tables pointed out that loss rates in small units could be quite high and variable over time, and that larger formations took fewer casualties as a fraction of overall strength, and that their rates tended to become more constant over time. Casualties were not distributed evenly, but concentrated most heavily among the combat arms, and in the front-line infantry in particular. Attackers usually suffered higher loss rates than defenders. Other factors to be accounted for included the character of the terrain, the relative amount of artillery on each side, and the employment of gas.

The 1941 iteration of the Staff Officer’s Field Manual, now designated Field Manual (FM) 101-10[4], provided two methods for estimating battle casualties. It included the original 1932 Battle Casualties table, but the associated text no longer included the section outlining factors to be considered in calculating loss rates. This passage was moved to a note appended to a new table showing the distribution of casualties among the combat arms.

Rather confusingly, FM 101-10 (1941) presented a second table, Estimated Daily Losses in Campaign of Personnel, Dead and Evacuated, Per 1,000 of Actual Strength. It included rates for front line regiments and divisions, corps and army units, reserves, and attached cavalry. The rates were broken down by posture and tactical mission.

Estimated Daily Losses in Campaign of Personnel, Dead and Evacuated, Per 1,000 of Actual Strength, FM 101-10 (1941)

The source for this table is unknown, nor the method by which it was derived. No explanatory text accompanied it, but a footnote stated that “this table is intended primarily for use in school work and in field exercises.” The rates in it were weighted toward the upper range of the figures provided in the 1932 Battle Casualties table.

The October 1943 edition of FM 101-10 contained no significant changes from the 1941 version, except for the caveat that the 1932 Battle Casualties table “may or may not prove correct when applied to the present conflict.”

The October 1944 version of FM 101-10 incorporated data obtained from World War II experience.[5] While it also noted that the 1932 Battle Casualties table might not be applicable, the experiences of the U.S. II Corps in North Africa and one division in Italy were found to be in agreement with the table’s division and corps loss rates.

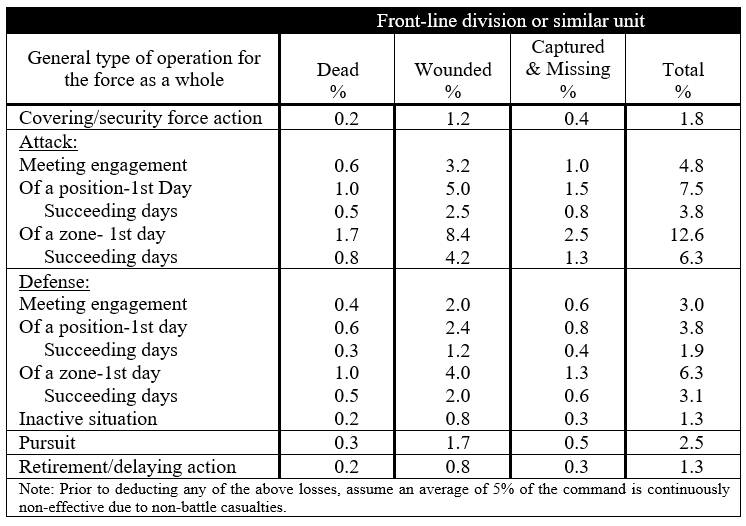
FM 101-10 (1944) included another new table, Estimate of Battle Losses for a Front-Line Division (in % of Actual Strength), meaning that it now provided three distinct methods for estimating battle casualties.

Estimate of Battle Losses for a Front-Line Division (in % of Actual Strength), FM 101-10 (1944)

Like the 1941 Estimated Daily Losses in Campaign table, the sources for this new table were not provided, and the text contained no guidance as to how or when it should be used. The rates it contained fell roughly within the span for daily rates for severe (6-8%) to maximum (12%) combat listed in the 1932 Battle Casualty table, but would produce vastly higher overall rates if applied consistently, much higher than the 1932 table’s 1% daily average.

FM 101-10 (1944) included a table showing the distribution of losses by branch for the theater based on experience to that date, except for combat in the Philippine Islands. The new chart was used in conjunction with the 1944 Estimate of Battle Losses for a Front-Line Division table to determine daily casualty distribution.

Distribution of Battle Losses–Theater of Operations, FM 101-10 (1944)

The final World War II version of FM 101-10 issued in August 1945[6] contained no new casualty rate tables, nor any revisions to the existing figures. It did finally effectively invalidate the 1932 Battle Casualties table by noting that “the following table has been developed from American experience in active operations and, of course, may not be applicable to a particular situation.” (original emphasis)

NOTES

[1] Albert G. Love, War Casualties, The Army Medical Bulletin, No. 24, (Carlisle Barracks, PA: 1931)

[2] This post is adapted from TDI, Casualty Estimation Methodologies Study, Interim Report (May 2005) (Altarum) (pp. 314-317).

[3] U.S. War Department, Staff Officer’s Field Manual, Part Two: Technical and Logistical Data (Government Printing Office, Washington, D.C., 1932)

[4] U.S. War Department, FM 101-10, Staff Officer’s Field Manual: Organization, Technical and Logistical Data (Washington, D.C., June 15, 1941)

[5] U.S. War Department, FM 101-10, Staff Officer’s Field Manual: Organization, Technical and Logistical Data (Washington, D.C., October 12, 1944)

[6] U.S. War Department, FM 101-10 Staff Officer’s Field Manual: Organization, Technical and Logistical Data (Washington, D.C., August 1, 1945)

C-WAM 2

Here are two C-WAM documents: their rule book and a CAA briefing, both from 2016:

C-WAM’s rule book: https://paxsims.files.wordpress.com/2016/10/c-wam-rules-version-7-29-jul-2016.docx

CAA briefing on C-WAM: https://paxsims.files.wordpress.com/2016/10/mors-wargame-cop-brief-20-apr-16.pptx

A few highlights (rule book):

  1. Grid size from 2 to 10 km, depending on terrain (section 2.2)
    1. Usually 5 km to a grid.
  2. There is an air-to-air combat table based upon force ratios (section 3.6.4).
  3. There is a naval combat table based upon force ratios (section 3.9.4).
  4. There are combat values of ground units (section 3.11.5.B)
  5. There is a ground combat table based upon force ratios (section 3.11.5.E)
  6. There is a “tactics degrade multiplier” which effectively divides one sides’ combat power by up to 4 (section 3.11.5.P).
  7. These tables use different types of dice for probability generation (showing the influence of Gary Gygax on DOD M&S).

A few highlights (briefing)

  1. Executes in 24 or 72 hours time steps (slide 3)
  2. Brigade-level (slide 18)
  3. Breakpoint at 50% strength (can only defend), removed at 30% strength (slide 18 and also rule book, section 5.7.2).

Anyhow, interesting stuff, but still basically an old style board-game, like Avalon Hill or SPI.


Saudi Missile Defense

The Houthi’s in Yemen are lobbing missiles at Saudi Arabia. Saudi Arabia does have a missile defense system (I assume made in America). Apparently they are missing the incoming missiles: http://www.businessinsider.com/saudi-missile-defense-failed-video-2018-3

A few other points:

  1. One interceptor appears to have “pulled a u-turn” and exploded over Riyadh.
    1. This interceptor may have been the source of the Saudi casualties (one dead, two injured)
  2. This could be the largest barrage of missiles fired at Saudi Arabia by the Houthi’s yet.

I wonder what interceptor Saudi Arabia was using. I wonder if failure is common with most missile defense systems (the situation with North Korea comes to mind here).

——————————————————————————————————————-

Update:

This is not the first time we have discussed this problem:

Did The Patriot BMD Miss Again In Saudi Arabia?

C-WAM 1

Linked here is an article about a wargame called C-WAM, the Center for Army Analysis (CAA) Wargaming Analysis Model: https://www.govtechworks.com/how-a-board-game-helps-dod-win-real-battles/#gs.ifXPm5M

A few points:

  1. It is an old-style board game.
  2. Results are feed into RAND’s JICM (Joint Integrated Contingency Model).
    1. Battle attrition is done using CAA’s COSAGE and ATCAL.
  3. Ground combat is brigade-level.

More to come.

‘Evett’s Rates’: British War Office Wastage Tables

Stretcher bearers of the East Surrey Regiment, with a Churchill tank of the North Irish Horse in the background, during the attack on Longstop Hill, Tunisia, 23 April 1943. [Imperial War Museum/Wikimedia]

A friend of TDI queried us recently about a reference in Rick Atkinson’s The Guns at Last Light: The War in Western Europe, 1944-1945 to a British casualty estimation methodology known as “Evett’s Rates.” There are few references to Evett’s Rates online, but as it happens, TDI did find out some details about them for a study on casualty estimation. [1]

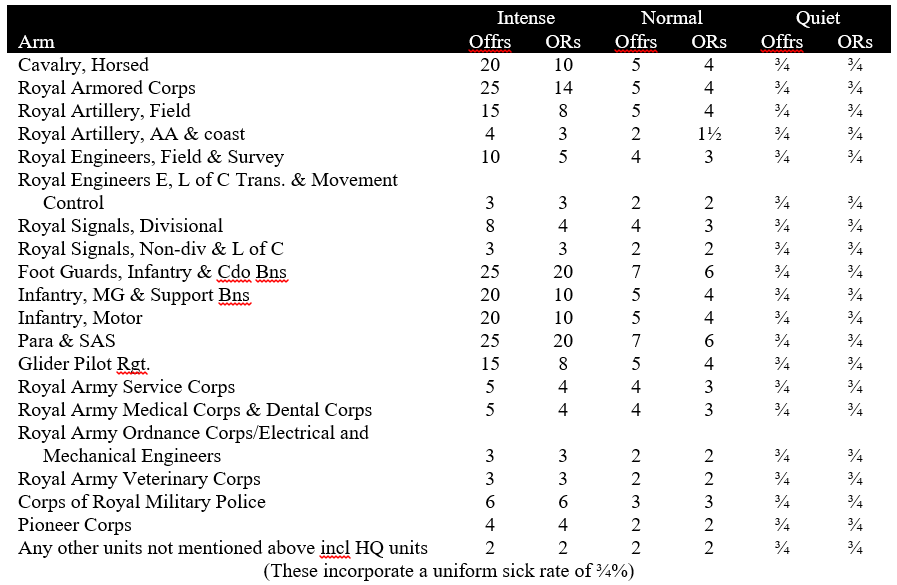
British Army staff officers during World War II and the 1950s used a set of look-up tables which listed expected monthly losses in percentage of strength for various arms under various combat conditions. The origin of the tables is not known, but they were officially updated twice, in 1942 by a committee chaired by Major General Evett, and in 1951-1955 by the Army Operations Research Group (AORG).[2]

The methodology was based on staff predictions of one of three levels of operational activity, “Intense,” “Normal,” and “Quiet.” These could be applied to an entire theater, or to individual divisions. The three levels were defined the same way for both the Evett Committee and AORG rates:

The rates were broken down by arm and rank, and included battle and nonbattle casualties.

Rates of Personnel Wastage Including Both Battle and Non-battle Casualties According to the Evett Committee of 1942. (Percent per 30 days).

The Evett Committee rates were criticized during and after the war. After British forces suffered twice the anticipated casualties at Anzio, the British 21st Army Group applied a “double intense rate” which was twice the Evett Committee figure and intended to apply to assaults. When this led to overestimates of casualties in Normandy, the double intense rate was discarded.

From 1951 to 1955, AORG undertook a study of casualty rates in World War II. Its analysis was based on casualty data from the following campaigns:

  • Northwest Europe, 1944
    • 6-30 June – Beachhead offensive
    • 1 July-1 September – Containment and breakout
    • 1 October-30 December – Semi-static phase
    • 9 February to 6 May – Rhine crossing and final phase
  • Italy, 1944
    • January to December – Fighting a relatively equal enemy in difficult country. Warfare often static.
    • January to February (Anzio) – Beachhead held against severe and well-conducted enemy counter-attacks.
  • North Africa, 1943
    • 14 March-13 May – final assault
  • Northwest Europe, 1940
    • 10 May-2 June – Withdrawal of BEF
  • Burma, 1944-45

From the first four cases, the AORG study calculated two sets of battle casualty rates as percentage of strength per 30 days. “Overall” rates included KIA, WIA, C/MIA. “Apparent rates” included these categories but subtracted troops returning to duty. AORG recommended that “overall” rates be used for the first three months of a campaign.

The Burma campaign data was evaluated differently. The analysts defined a “force wastage” category which included KIA, C/MIA, evacuees from outside the force operating area and base hospitals, and DNBI deaths. “Dead wastage” included KIA, C/MIA, DNBI dead, and those discharged from the Army as a result of injuries.

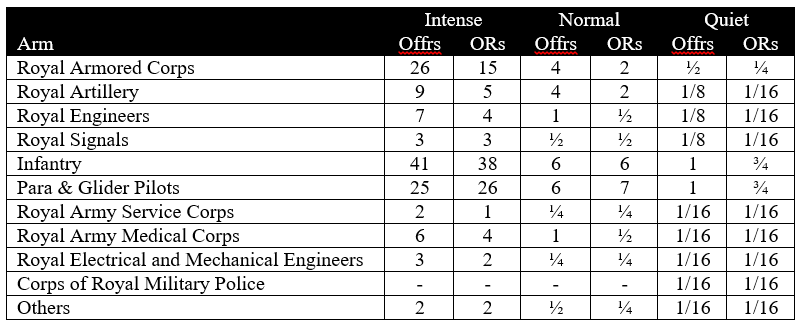
The AORG study concluded that the Evett Committee underestimated intense loss rates for infantry and armor during periods of very hard fighting and overestimated casualty rates for other arms. It recommended that if only one brigade in a division was engaged, two-thirds of the intense rate should be applied, if two brigades were engaged the intense rate should be applied, and if all brigades were engaged then the intense rate should be doubled. It also recommended that 2% extra casualties per month should be added to all the rates for all activities should the forces encounter heavy enemy air activity.[1]

The AORG study rates were as follows:

Recommended AORG Rates of Personnel Wastage. (Percent per 30 days).

If anyone has further details on the origins and activities of the Evett Committee and AORG, we would be very interested in finding out more on this subject.

NOTES

[1] This post is adapted from The Dupuy Institute, Casualty Estimation Methodologies Study, Interim Report (May 2005) (Altarum) (pp. 51-53).

[2] Rowland Goodman and Hugh Richardson. “Casualty Estimation in Open and Guerrilla Warfare.” (London: Directorate of Science (Land), U.K. Ministry of Defence, June 1995.), Appendix A.