Mystics & Statistics

A blog on quantitative historical analysis hosted by The Dupuy Institute

Panzer Battalions in LSSAH in July 1943

I was recently reviewing a book called Germany and the Second World War: The Eastern Front 1943-1944. On page 124 it stated that “[On 12 July] In reality, this [the Adolf Hitler SS Panzer] regiment consisted of only one battalion of three companies, to which a heavy armoured company with four operational Tigers had been attached. The other battalion was back in Germany undergoing conversion to Panthers.”

Now, the LSSAH (Leibstandarte SS Adolf Hitler) Division did send its I Battalion back to convert to Panthers, but I still believe that the tank (panzer) regiment was operating with two battalions and more than three regular panzer companies. They probably had a temporary battalion drawn from elsewhere as had been done for the Das Reich SS Division. The problem is that I do not have a detailed organization chart for the LSSAH Division for June or July 1943. I do have the Das Reich and Totenkopf organization charts for August and July respectively and they both have two battalions with 7 or 8 panzer companies. As the Adolf Hitler SS Division has more tanks than either of them, I assume it also had two panzer battalions. Yet other authors seem to want to imply that somehow the Adolf Hitler SS Panzer Regiment was at half-strength at Prokhorovka, even though it had more tanks than either of the other two SS divisions..

On page 136 of that book it states that “The conclusion is that on 12 July at Prokhorovka 5th Guards Armoured Army fought only against two SS Armoured Infantry Divisions (each with a single armoured battalion), apart from an insignificant skirmish at Rzhavets.”

To start with the LSSAH Division on 4 July had 90 Pz III and IVs, and 9 Pz III Command tanks. There is simply no way to assemble them into a battalion of three companies with a strength of only 22 tanks per company. Even if 5 Pz IIIs are with the 13th Panzer Company (the Tiger company), and another 9 – 13 tanks are with the battalion and regiment headquarters, this leaves at least 81 Pz III and IVs for the II Battalion. With only three companies, they were either operating with 27 or more tanks per company, or there was some other organization. Ribbentrop, the 6th company commander, did state that there were 22 tanks in his company and I don’t recall seeing overstrength tank companies in German organizations before.

So, either the LSSAH had 1) overstrength tank companies, 2) a 4th company in the II Battalion, or 3) a temporary I Battalion.

I do not have an organization chart of LSSAH for June, July or August. I do have the organization chart for the Das Reich on 1 August 1943. There it shows the II Panzer Battalion. In the place of the I Panzer Battalion is an AT Battalion which has three companies reporting to it, a tank company, and two antitank companies (but armed with tanks). It is clear that the Das Reich SS Division had created a temporary I Battalion to handle its tanks. It had done so by I August, and I suspect it had done that before the Battle of Kursk (which started 5 July). If the Das Reich SS Division had done this before Kursk, then I would not be surprised it LSSAH did something similar.

The records I have do reference a I Battalion with the LSSAH on 8 July. In my files is a report from the “Tagesmeldung” for LSSAH for 8/7/43 17.45. It states “Am 8.7.43, 05..00 Uhr, trat verstarktes I.Pz.Rgt.1 aus Prokrowka zum Angriff auf Bol. Majatschki…” (T354, R605, page 577). This was not a simple typo, for the same report is repeated in a “Presentation of Events” that states for 8 July: “05.00 Uhr. Angriff I.Pz:Rgt. “L-SS-AH” gegen Bol. Majatschki.” (T313, R368, note they use the Roman numeral I, which indicates battalion). So, either something or someone was serving as the first battalion of the regiment; or this is an incorrect report broadcast to two sources. This is referenced in my Kursk book on page 622 where the I Battalion of the Adolf Hitler SS Panzer Regiment is attacking at 0500 from Pokrovka towards Bolshiye Mayachki.

Another historian I have been discussing this with has also looked at the LSSAH division history for 1943 by Rudolf Lehmann and mentions an 8th panzer company that may have been created in May/June.

So, we are left with one of three constructs:

1. There are 27 or more Pz III and IVs in each tank company.

     A. This is both unusual and contradicted by Ribbentrop.

2. There is an 8th company in II Panzer Battalion

     A. Also contradicted by Ribbentrop.

3. There is a temporary I Battalion created.

    A. Similar to what Das Reich records on 1 August.

    B. And referenced in two reports on 8 July.


Of course, logic would dictate that the Adolf Hitler SS Division had an arrangement similar to what was done with the Das Reich. If they did not, then it begs the question of how did they command 106 Pz I-IVs with three tank companies. The division had 3 Pz I (one of them a command tank), 4 Pz IIs, 90 Pz IIIs and Pz IVs (79 of them Panzer IV longs), 12 Pz VI and nine Panzer III Command tanks. With 22 tanks per company, and the 12 Tiger tanks in one company, they clearly needed 6 to 8 companies to handle this collection of armor. There are 3 or 4 tank companies in a battalion. On 1 August, the Das Reich SS Division had seven regular tank companies (not counting the Tiger company) which had between them 8 and 21 tanks each, with only one company having as many as 21 tanks (T313, R387). The Totenkopf SS Division had six regular tank companies (T78, R719) throughout this period.

On 15 April I have a status report as of 30 April (not sure how that works) that clearly indicates that LSSAH and DR SS Divisions only have one battalion (see:T313, R366, page 2078). It lists “1 Pz.Abt” for LSSAH and “1 Pz.Abt” and “1 Tiger-Kp.” for DR SS Division. Yet on 1 August the Das Riech SS Division has two battalions, one a temporary battalion created from an AT tank Battalion. I have assumed this was also its organization as of 1 July 1943. At least to me, it makes the argument that both panzer regiments replaced the missing I Battalion with a temporary battalion for Kursk.

The tank status report for Das Reich for 1 May lists the panzer regiment without the 1st Battalion (T313, R387, page 369). The similar tank status report for 1 June lists the panzer regiment but no statement that it is without the 1st Battalion (T313, R387, page 505). Same with the 10 June report (T313, R387, page 560). Is this because something changed? This does lead me to strongly suspect that Das Reich created it temporary I Battalion on or before 1 June. If Das Reich did so, I would assume so to would LSSAH.

So, logic would dictate that the Adolf Hitler SS Panzer Regiment has two battalions, while two similar reports on 8 July 1943 also reference the I Battalion. Is there any documentation I have missed that could further clarify or resolve this issue?

Demographics of China

China is the most populous country/region in the world. In its unified and un-unified forms, it has been forever, so it seems. It certainly has been since the fall of the Roman Empire, although one can argue that the British Empire was larger for a moment. Oddly enough, the pre-eminent position that it has held for over 1,500 years, is about to be surpassed by India. China, in its wisdom brought it population under control decades ago, encouraging smaller families. This has allowed it to further develop and economically grow. Quite simply, if a country’s economic growth is 3% a year, and its population growth is 3% a year, then the average person is basically getting nowhere. This has been the case for many nations in the developing world. China has broken from that pattern.

The population of China (People’s Republic of China) for 2017 is estimated at 1,411 million, or 1.4 billion. This is a staggering figure making it almost five times (4.6 times) as many people as the United States. It is around three times what its population was in 1950. The population in its first official national census taken by the People’s Republic of China in 1953 was 583 million. It was a little hard to determine what the population of China was until the post-war period. Post-war in this case means post-Warlord period, post-Sino-Japanese War, post-World War II and post-Chinese Civil War. The Chinese population was almost four times larger than the United States in 1950/1953, back in the days when we were at war with China in the Korean peninsula. The Chinese population is now growing at a rate of 0.59% percent a year (a half percent a year). This is very low.

The fertility rates in China are 1.62 children per woman (2016) according to National Health and Family Planning Commission (NHFPC) and 1.29 in 2016 according to the National Bureau of Statistics (NBS). Not sure why there is such a difference. Regardless, this is not replacement rate and well below 2.1. It is a birth rate lower that what we see in many developed countries, although China is a still a developing country. This low birth rate was a result of the one-child policy instituted by the Communist Party in 1979. It appears to have not only worked, but it worked too well. In 2015, the government instituted a two-child policy. According to NHFPC, they are expecting the birth rate to grow to 1.8. I guess this is one of the goals of the 13th Five-Year Plan. This is still not replacement rate. China does have some emigration and immigration, but the population is so massive that this does not have a huge impact on population growth rates.

They have classified 91.51% of the population of China as Han Chinese. Still, 8.5% of 1.5 billion creates some significant minorities. This includes the Tibetians, with at least 2.8 million, and the Turkish Uyghurs estimated at 3.6 million. I ate recently at a Uyghur restaurant in Crystal City, VA. I have never seen to one of those before.

Most likely the Chinese population will experience negative population growth by 2030. The United Nations predicts the Chinese population will be 1.36 billion in 2050. This compares to 402 for the United States and 132 for Russian in 2050. Predicting population over 30 years is not that difficult. On the other hand, there is a projection that Chinese population will decline to 1.02 billion by 2100. I would not hang my hat on that last figure.

The population is aging, with its demographic “pyramid” developing a narrowing at the bottom. The demographic “pyramid” from 2015 is below:

These figures do not include Taiwan (Republic of China) or Macau (Macao Special Administrative Region). It does include the city of Hong Kong. Mainland China claims Taiwan is part of China and has had an army posed across the straights ready to invade for almost 70 years. I am guessing if they have not invaded in the last 70 years, they are not going to invade in the next 70, especially as Taiwan is a major trading partner. I do not expect re-unification as long as Taiwan remains democratic (and it has been since 1991/1996) and China remains a communist dictatorship. Taiwan had a population in 2010 of 23.1 million, and it is growing only very slowly. Macau, with a population of 552,300 in the 2010 census, is effectively under Chinese control, as is Hong Kong (7,097,600 in the 2010 census).

U.S. Army Mobile Protected Firepower (MPF) Program Update

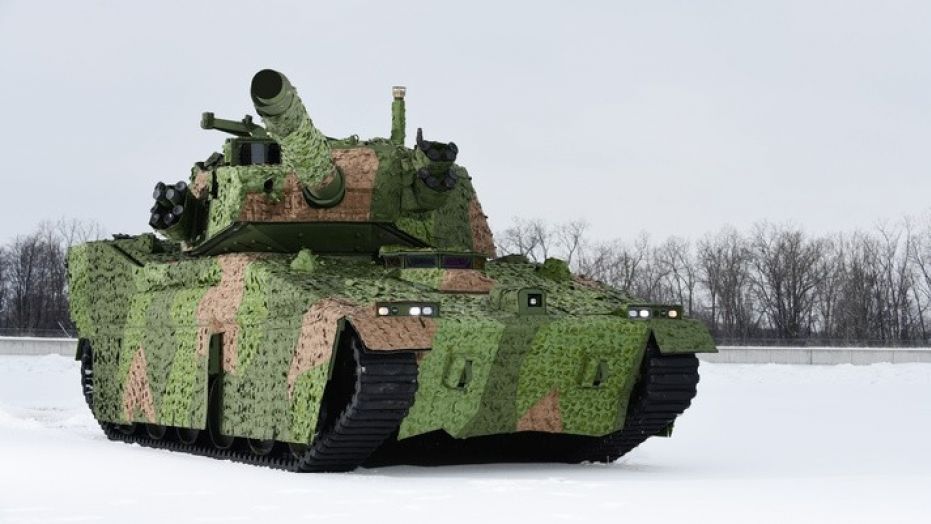
BAE Systems has submitted its proposal to the U.S. Army to build and test the Mobile Protected Firepower (MPF) vehicle [BAE Systems/Fox News]

When we last checked in with the U.S. Army’s Mobile Protected Firepower (MPF) program—an effort to quickly field a new light tank lightweight armored vehicle with a long-range direct fire capability—Request for Proposals (RFPs) were expected by November 2017 and the first samples by April 2018. It now appears the first MPF prototypes will not be delivered before mid-2020 at the earliest.

According to a recent report by Kris Osborn on Warrior Maven, “The service expects to award two Engineering Manufacturing and Development (EMD) deals by 2019 as part of an initial step to building prototypes from multiple vendors, service officials said. Army statement said initial prototypes are expected within 14 months of a contract award.”

Part of the delay appears to stem from uncertainty about requirements. As Osborn reported, “For the Army, the [MPF} effort involves what could be described as a dual-pronged acquisition strategy in that it seeks to leverage currently available or fast emerging technology while engineering the vehicle with an architecture such that it can integrate new weapons and systems as they emerge over time.”

Among the technologies the Army will seek to integrate into the MPF are a lightweight, heavy caliber main gun, lightweight armor composites, active protection systems, a new generation of higher-resolution targeting sensors, greater computer automation, and artificial intelligence.

Osborn noted that

the Army’s Communications Electronics Research, Development and Engineering Center (CERDEC) is already building prototype sensors – with this in mind. In particular, this early work is part of a longer-range effort to inform the Army’s emerging Next-Generation Combat Vehicle (NGCV). The NGCV, expected to become an entire fleet of armored vehicles, is now being explored as something to emerge in the late 2020s or early 2030s.

These evolving requirements are already impacting the Army’s approach to fielding MPF. It originally intended to “do acquisition differently to deliver capability quickly.” MPF program director Major General David Bassett declared in October 2017, “We expect to be delivering prototypes off of that program effort within 15 months of contract award…and getting it in the hands of an evaluation unit six months after that — rapid!

It is now clear the Army won’t be meeting that schedule after all. Stay tuned.

“Quantity Has A Quality All Its Own”: How Robot Swarms Might Change Future Combat

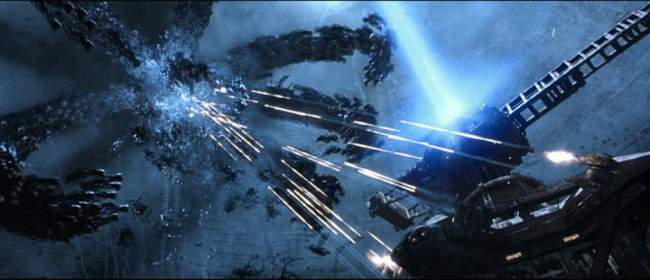
Humans vs. machines in the film Matrix Revolutions (2003) [Screencap by The Matrix Wiki]

Yesterday, Paul Scharre, director of the Technology and National Security Program at the Center for a New American Security, and prolific writer on the future of robotics and artificial intelligence, posted a fascinating argument on Twitter regarding swarms and mass in future combat.

His thread was in response to an article by Shmuel Shmuel posted on War on the Rocks, which made the case that the same computer processing technology enabling robotic vehicles combined with old fashioned kinetic weapons (i.e. anti-aircraft guns) offered a cost-effective solution to swarms.

Scharre agreed that robotic drones are indeed vulnerable to such countermeasures, but made this point in response:

He then went to contend that robotic swarms offer the potential to reestablish the role of mass in future combat. Mass, either in terms of numbers of combatants or volume of firepower, has played a decisive role in most wars. As the aphorism goes, usually credited to Josef Stalin, “mass has a quality all of its own.”

Scharre observed that the United States went in a different direction in its post-World War II approach to warfare, adopting instead “offset” strategies that sought to leverage superior technology to balance against the mass militaries of the Communist bloc.

While effective during the Cold War, Scharre concurs with the arguments that offset strategies are becoming far too expensive and may ultimately become self-defeating.

In order to avoid this fate, Scharre contends that

The entire thread is well worth reading.

Trevor Dupuy would have agreed with much of what Scharre’s asserts. He identified the relationship between increasing weapon lethality and battlefield dispersion that goes back to the 17th century. Dupuy believed that the primary factor driving this relationship was the human response to fear in a lethal environment, with soldiers dispersing in depth and frontage on battlefields in order to survive weapons of ever increasing destructiveness.

TDI Friday Read: Lethality, Dispersion, And Mass On Future Battlefields

Robots might very well change that equation. Whether autonomous or “human in the loop,” robotic swarms do not feel fear and are inherently expendable. Cheaply produced robots might very well provide sufficient augmentation to human combat units to restore the primacy of mass in future warfare.

Demographics of the United States

The United States is the third most populous country in the world, and has been since the collapse of the Soviet Union. It is likely to remain the third most populous country for a long time to come, as it will certainly not catch up to the two countries with over a billion people (China and India) and will not be surpassed by anyone else any time soon (Indonesia, 4th on the list, has a population of around 264 million in 2017 and a growth rate of 1.1% compared to the U.S. growth rate of 0.7%). It appears that we will be the third most populous country in the world for decades to come.

The United States population for 2018 is estimated at 328.3 million. This is more than twice what it was in 1950. It has been growing at 9.7% or higher for every decade since 1790, with the exception of the 1930s (7.3% for that decade). Annual growth rate in 2017 is 0.7%.

The fertility rates in the U.S. is 1.76 children per woman (2017). This is not that much higher than the 1.61 figure that Russia has (see my previous post on demographics). Almost all developed countries in the world now have a birth rate below 2. It needs to be around 2.1 to achieve replacement rate. The U.S. fertility rate dropped below 2.1 in 1972 and has remained below the replacement rate ever since then, except for two years (2006 and 2007). But, the U.S. population continues to grow, and that growth is due to immigration. If it was not for immigration, the U.S. population would be in decline.

The United States is currently 77.7% “white” (in 2013), which is defined by the census bureau as “having origins in any of the original peoples of Europe, the Middle East, or North Africa.” Non-Hispanic “whites” make up 62.6% of the country’s population. The non-Hispanic “white” population is expected to fall below 50% by 2045. Needless to say, this has become a political issue inside the United States, one that I have no interest in discussing on this blog. See: https://www.brookings.edu/blog/the-avenue/2018/03/14/the-us-will-become-minority-white-in-2045-census-projects/

The United Nations predicts the U.S. population will be 402 million in 2050  (compared to their prediction of 132 for Russia in 2050). The U.S. census bureau projects the U.S. population will be 417 million in 2060.

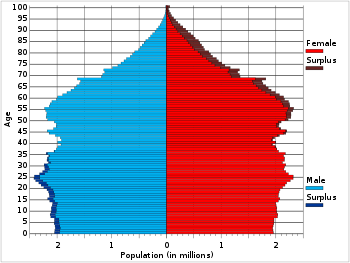
The population has gotten older, with the median age now being 38.1 years. In 1970, at the height of the “youth culture” it was 28.1 years. The demographic “pyramid” from 2015 for the United States is below. This is worth comparing to the Russian “pyramid” in a previous post.

The legal immigration rate of the United States has averaged around 1 million a year from 1989. The legal immigration rate rose to 1.8 million in 1991 and was 1.2 million in 2016. This was very much driven by the Immigration Act of 1990, which raised the cap on immigration. See: https://www.dhs.gov/immigration-statistics/yearbook/2016/table1

The illegal immigration rate is harder to calculate, as some illegal immigrants are deported, some return home and I gather a significant number of them later convert to legal immigrants. It is estimated that there are around 11 million illegal immigrants in this country (2016 estimate). In 1990, it was estimated that there were 3.5 million illegal immigrants. Does that mean that the actual immigration rate from illegal immigration is less than 300,000 a year (as many later become legal immigrants)? It is hard to say exactly, but it appears that our immigration rate is somewhere between 1,300,000 and 1,500,000 a year counting both legal and illegal immigrants.

This is the primary source of our population growth and will probably be so for some time to come. The United States ceased reproducing at replacement rate almost 50 years ago. This is not going to change anytime soon. Some immigration is probably essential to maintain our labor force at current or growing levels (this is as close to a political statement as I am going to get on the subject).

Next to China, India, Japan and Germany.

Destroyed Tanks In Das Reich

Still working on sorting out the events on 6 July 1943 with the Das Reich SS Division at Luchki.

Das Reich’s first reported destroyed tank was at 0235 on 7 July (T354, R605, page 556). It was a Panzer IV. It then provides a map showing 6 tanks destroyed SSW of Luchki (1 Pz III, 2 Pz IVs, 1 Pz VI and 2 T-34s). The map is undated, but is probably between 6 and 9 July. Das Reich took Luchki (south) on 6 July. This map is shown here:

The Das Reich Valley of Death?

There is a 10-day report for 10 July. These are usually the best source for total loss reports. The report total losses as of 10 July as being 1 Pz III long, 1 Pz IV long and 1 StuG (T313, R387, page 6831). There is also a Corps’ quartermaster log, where they report that as of 7/11, there were three tanks totally destroyed: 1 Pz III, 1 Pz IV and 1 StuG III (T354, R607, pg 507). Hard to square these reports up with the map of Luchki showing six tanks destroyed.

It is only until the 28th of July do we get a complete listing for Das Reich of total losses for the period of 5-18 July. There was no 10-day status report for the 20th of July. The 28 July report records for Das Reich total losses of 2 Pz III, 6 Pz IV, 1 Pz VI and 2 StuG (T354, R607, page 629). This is total of 11 tanks, but does not include T-34s, where at least two were totally destroyed. We ended up recording 18 as destroyed based upon multiple sources (see page 1336 of my Kursk book).

The same report also records LSSAH total losses as 1 Pz Ib, 1 Pz III, 9 Pz IV, 1 Pz VI, 3 StuG, and 3 “Pak Sf.” (Marders). Same for Totenkopf SS, where they report 6 Pz IIIs, 7 Pz IVs, 1 Pz VI, 1 StuG and 2 Marders.

Now this was a clean-up report. There were other earlier reports of total losses that indicate less losses. On 23 July there is a report of tanks destroyed by the corps (T354, R605, page 853). It reports for the II SS Panzer Corps 5 Pz III long, 23 Pz IV long, 3 Pz VI and 5 Sturmgeschutz (assault guns). This does not quite match the report on 28 July. On 28 July they report 9 Pz III (+4), 22 Pz IV long (-1), 3 Pz VI and 6 StuG (+1). There was no fighting between 23 and 28 July, 1943 as the SS Panzer Corps was moving to conduct its next offensive.

A few things come to mind here:

  1. According to our accounting, Das Reich lost 129 tanks damaged and 18 destroyed between 4 July and 18 July (see page 1337 of my Kursk book).
  2. They apparently only lost 13-18 tanks destroyed in that period.
  3. It does appears that tanks are being written off as destroyed several days after they were actually damaged, in some cases a week or more later.
  4. Clearly, looking at destroyed tanks only does not really give a full and proper accounting of the actual fighting.

If you really want to know what is going on with combat among the German armored divisions in WWII, you really need to compare and contrast the ready-for-action reports from day-to-day.

Anyhow, not sure I am any closer to determining what happened on the 6th of July, if any significant did happen.

Demographics of Russia

I am far from an expert on demographics, but it something I do occasionally pay attention to. When it comes to measuring long-term military power and world influence, the basic measurement of power is wealth times population. Or, you can simply stack the countries up by GNP. This puts Russia 11th on the list, below Canada. But looking at Russia’s population alone is useful.

As of January 2018 the population of Russia is estimated at 146.9 million people. This does make it the 9th most populous country on the planet. This does include Crimea and Sevastopol, which has 2.4 million people.

The population of Russia was in steady decline from 1991 to 2013. Even in 2017 Russia was only producing 1.61 children per women. This is below the replacement rates of 2.1. The last time the Russian fertility rate was above 2 was in 1989 and that was only for 7 years. It was below 2 for most of the time before that going back to mid-1960s. Low child birth rates and small families rates seem to be very much a part of the culture. I know a lot of Russians that are only children.

Their population is growing ever so slowly due to immigration. For 2017 they had a net migration of 211,878, and a natural population loss of 135,818. This gave them population gains of 76,060, which is a very small annual gain (0.05% gain a year). In 2010, ethnic Russians made up 77% of the total population.

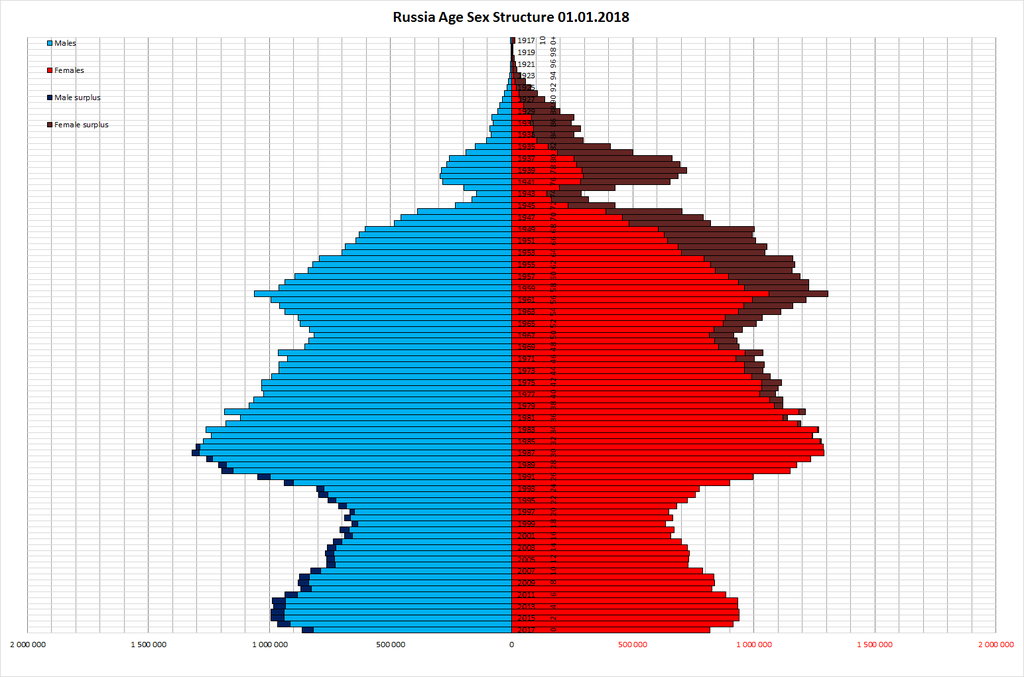
The population of Russia was 147.4 million in 1990, 148.7 million in 1991, and then it declined at a rate of 0.5% a year, dropped to 142.9 million in 2010 and has increased to 146.9 since then by immigration and seizure of Crimea and Sevastopol. In 2006 the Russian government started simplifying immigration laws, encouraging immigration of ethnic Russian from former Soviet republics. There is probably a limit to how many more people this can draw in. Russia also has about 7 million temporary migrant workers (these are 2011 figures). The Russian population tends to be older than most. The demographic “pyramid” is anything but pyramidal in shape.

As of 2018, the UN is still predicting that Russia’s population will fall to 132 million by 2050. See: https://esa.un.org/unpd/wup/Country-Profiles/

Now, lets compare the population of the Soviet Union/Russia to the United States over time:

                Soviet Union/Russia               United States

1951        182.3 million                             151.3 (1950)

1959        209.0                                        179.3 (1960)

1970        241.7                                        203.2

1977        257.7                                        226.5 (1980)

1982        270.0                                        226.5 (1980)

1990        290.9                                        248.7

1991        293.0                                        248.7 (1990)

2002       145.2 (Russia only)                   281.4 (2000)

2010       142.9                                         308.7

2018       146.9                                         328.3 (est.)


So, during the height of the “we will bury you” era the Soviet Union had a population of about 20% larger than the U.S. Russia now has a population less than half the U.S. (and a GDP of less than Canada). It appears that their population will not be growing very fast and may well continue to decline.

Wargaming Thread on Combat Results Tables

Thanks to a comment made on one of our posts, I recently became aware of a 17 page discussion thread on combat results tables (CRT) that is worth reading. It is here:

https://www.boardgamegeek.com/thread/1344914/crts-101/page/1

By default, much of their discussion of data centers around analysis based upon Trevor Dupuy’s writing, the CBD90 database, the Ardennes Campaign Simulation Data Base (ACSDB), the Kursk Data Base (KDB)  and my book War by Numbers. I was not aware of this discussion until yesterday even though the thread was started in 2015 and continues to this year (War by Numbers was published in 2017 so does not appear until the end of page 5 of the thread).

The CBD90 was developed from a Dupuy research effort in the 1980s eventually codified as the Land Warfare Data Base (LWDB). Dupuy’s research was programmed with errors by the government to create the CBD90. A lot of the analysis in my book was based upon a greatly expanded and corrected version of the LWDB. I was the program manager for both the ACSDB and the KDB, and of course, the updated versions of our DuWar suite of combat databases.

http://www.dupuyinstitute.org/dbases.htm

There are about a hundred comments I could make to this thread, some in agreement and some in disagreement, but then I would not get my next book finished, so I will refrain. This does not stop me from posting a link:

Lanchester equations have been weighed….


How Many Confederates Fought At Antietam?

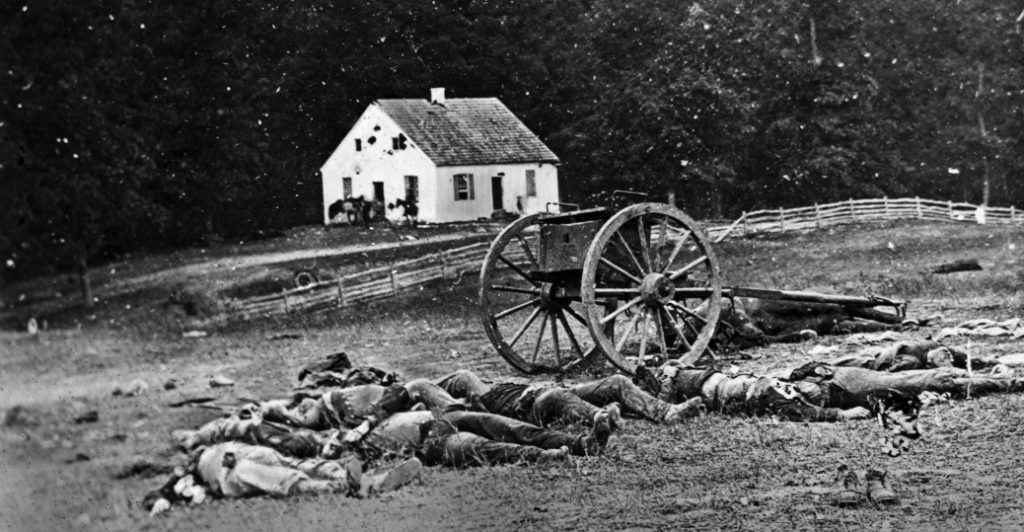
Dead soldiers lying near the Dunker Church on the Antietam battlefield. [History.com]

Numbers matter in war and warfare. Armies cannot function effectively without reliable counts of manpower, weapons, supplies, and losses. Wars, campaigns, and battles are waged or avoided based on assessments of relative numerical strength. Possessing superior numbers, either overall or at the decisive point, is a commonly held axiom (if not a guarantor) for success in warfare.

These numbers of war likewise inform the judgements of historians. They play a large role in shaping historical understanding of who won or lost, and why. Armies and leaders possessing a numerical advantage are expected to succeed, and thus come under exacting scrutiny when they do not. Commanders and combatants who win in spite of inferiorities in numbers are lauded as geniuses or elite fighters.

Given the importance of numbers in war and history, however, it is surprising to see how often historians treat quantitative data carelessly. All too often, for example, historical estimates of troop strength are presented uncritically and often rounded off, apparently for simplicity’s sake. Otherwise careful scholars are not immune from the casual or sloppy use of numbers.

However, just as careless treatment of qualitative historical evidence results in bad history, the same goes for mishandling quantitative data. To be sure, like any historical evidence, quantitative data can be imprecise or simply inaccurate. Thus, as with any historical evidence, it is incumbent upon historians to analyze the numbers they use with methodological rigor.

OK, with that bit of throat-clearing out of the way, let me now proceed to jump into one of the greatest quantitative morasses in military historiography: strengths and losses in the American Civil War. Participants, pundits, and scholars have been arguing endlessly over numbers since before the war ended. And since nothing seems to get folks riled up more than debating Civil War numbers than arguing about the merits (or lack thereof) of Union General George B. McClellan, I am eventually going to add him to the mix as well.

The reason I am grabbing these dual lightning rods is to illustrate the challenges of quantitative data and historical analysis by looking at one of Trevor Dupuy’s favorite historical case studies, the Battle of Antietam (or Sharpsburg, for the unreconstructed rebels lurking out there). Dupuy cited his analysis of the battle in several of his books, mainly as a way of walking readers through his Quantified Judgement Method of Analysis (QJMA), and to demonstrate his concept of combat multipliers.

I have questions about his Antietam analysis that I will address later. To begin, however, I want to look at the force strength numbers he used. On p. 156 of Numbers, Predictions and War, he provided the following figures for the opposing armies at Antietam:The sources he cited for these figures were R. Ernest Dupuy and Trevor N. Dupuy, The Compact History of the Civil War (New York: Hawthorn, 1960) and Thomas L. Livermore, Numbers and Losses of the Civil War (reprint, Bloomington: University of Indiana, 1957).

It is with Livermore that I will begin tracing the historical and historiographical mystery of how many Confederates fought at the Battle of Antietam.

Das Reich Tank Losses on 6 July, 1943

On 6 July 1943, we estimate that the Das Reich SS Division lost 30 tanks damaged and destroyed. We have them starting the battle on the evening of 4 July with the following:

Pz I Command:                1

Pz II:                                 0 (and 1 in repair)

Pz III short (Command):   8

Pz III short:                       1

Pz III long:                       52 (and 11 in repair)

Pz III Observation:            9 (not counted)

Pz III Command:               1

Pz IV long:                       30 (and 2 in repair)

Pz VI:                               12 (and 2 in repair)

StuG III:                            33

Marder II:                           2 (and one in repair)

Marder III 76.2mm:            8

T-34:                                18 (and 9 in repair)


Total                               166 (and 26 in repair)


This is from the Kursk Data Base (KDB).

Tank status report for 5 July from 4th PzA files (T313, R366, page 2209), no time given. It records:

Pz III short: 1

Pz III long: 45

Pz IV: 27

Pz VI: 12

Command: Not reported

StuG: 32


This file was not used. There are some errors in other parts of this report. The file we did use was 5.7.43 19:40 hours from the army files (T313, R368. page 4282), which states:

Pz III short: 1

Pz III long: 52

Pz IV long: 27

Pz VI: 11

T-34: 16

Command: 8

StuG: 21


It took me a while to find all these files, which is why this blog post was so late today.

The next report from Das Reich is at 0235 on 7 July. Not sure why the delay, as the other division’s in the corps were submitting daily reports. They report:

Pz III short: 1

Pz III long: 47

Pz IV: 16

Pz VI: 7

Command: 6

StuG: 14

Total losses: 1 Pz IV.


We assume that this report at 0235 on 7 July is the end of the day report for July 6. That gives us a count of at least 47-48 tanks lost since the start of the offensive. One will note that they claim only one tank completely lost, yet there are six tanks listed destroyed in the gully SSW of Luchki. Is this an indication that they may have been lost on subsequent days and towed there?

The Kursk Data Base records 19 tanks damaged/destroyed on the 5th and 30 tanks damaged/destroyed in the 6th. These counts include T-34 losses. On the 6th this includes 2 Pz III short (Command), 5 Pz III longs, 11 Pz IV longs (one listed as destroyed), 4 Pz VIs, 7 StuG IIIs, and 1 T-34.

The status report for 7 July is probably in the message of 8 July dated at 0830, which list tank status from 6.7.43. This could be a 7 July report and was used as such in the Kursk Data Base. It is from 4th Panzer Army files (T313, R366, page 2251):

Pz III: 43

Pz IV: 25

Pz VI: 6

Command tank: 7

T-34: 14

Stug: 7 (!)


Status report for 8 July (from 4th Panzer Army files, T313, R366, page 2247):

Pz III long: 31

Pz IV long: 14

Pz VI: 0  (hard to read)

Command Tank: 7

T-34: 12

StuG: 21


Report does have a handwritten figure of 45 next to it (31+14 = 45)

The next report of tank status we have for Das Reich is for 9 July. They report:

                           Division      Corps (1830)     Corps (1905)   4th PzA Report (2300)

Pz III short:            0

Pz III long:           31                   33                   31                      38 (31)

Pz IV:                  13                   15                    13                     13

 Pz VI:                   1                     1                      1                       1

Command tank:    7                     7                      7                            (7)

T-34:                     7                     7                      7

Stug:                   26                   26                    26                       26


For the Kursk Data Base, these were the nuts and bolt calculations we did for all nine German panzer and panzer grenadier divisions for all 15 days of the operation. We also did the same for all 10 Soviet tank and mechanized corps. While we may have made a error here and there on a given day, we did try to count and track tank strengths and losses for every single day, even when the records were not cooperating. I believe the KDB is the most accurate accounting of tank losses at the Battle of Kursk.

Anyhow, this is related to this previous post, as I am still trying to sort out what might of occurred near the village of Luchki on 6 July, 1943:

The Das Reich Valley of Death?

With six tanks reported destroyed to the SSW of Luchki, perhaps all on 6 July, and the Das Reich SS Division losing around 30 tanks on 6 July, there may have been a major fight there that is not otherwise documented.