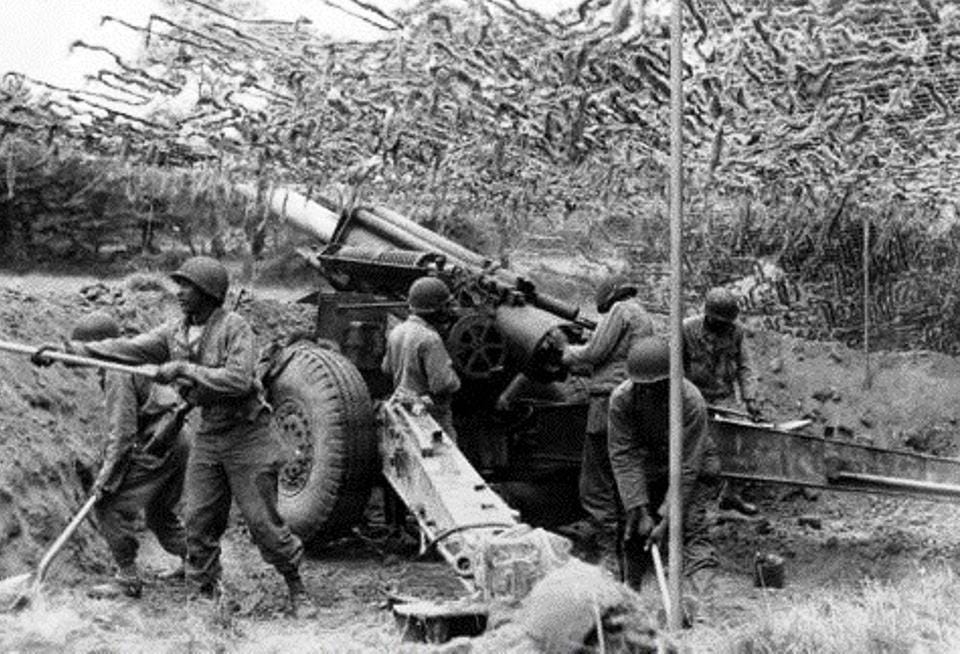
U.S. Army 155mm field howitzer in Normandy. [padresteve.com]
[This series of posts is adapted from the article “Artillery Effectiveness vs. Armor,” by Richard C. Anderson, Jr., originally published in the June 1997 edition of the International TNDM Newsletter.]
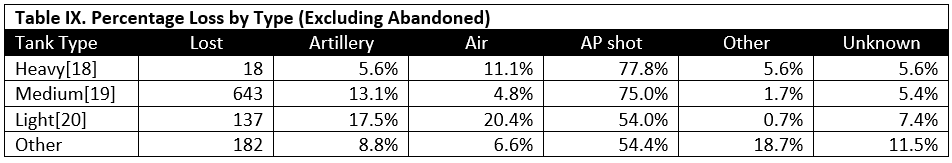
Table IX shows the distribution of cause of loss by type or armor vehicle. From the distribution it might be inferred that better protected armored vehicles may be less vulnerable to artillery attack. Nevertheless, the heavily armored vehicles still suffered a minimum loss of 5.6 percent due to artillery. Unfortunately the sample size for heavy tanks was very small, 18 of 980 cases or only 1.8 percent of the total.
The data are limited at this time to the seven cases.[6] Further research is necessary to expand the data sample so as to permit proper statistical analysis of the effectiveness of artillery versus tanks.
NOTES
[18] Heavy armor includes the KV-1, KV-2, Tiger, and Tiger II.
[19] Medium armor includes the T-34, Grant, Panther, and Panzer IV.
[20] Light armor includes the T-60, T-70. Stuart, armored cars, and armored personnel carriers.
Knocked-out Panthers in Krinkelt, Belgium, Battle of the Bulge, 17 December 1944. [worldwarphotos.info]
[This series of posts is adapted from the article “Artillery Effectiveness vs. Armor,” by Richard C. Anderson, Jr., originally published in the June 1997 edition of the International TNDM Newsletter.]
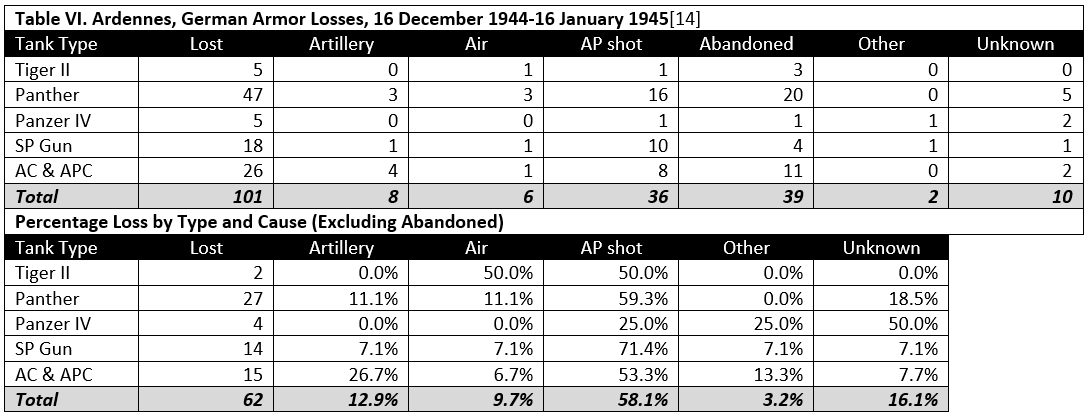
[14] From ORS Joint Report No. 1. A total of an estimated 300 German armor vehicles were found following the battle.
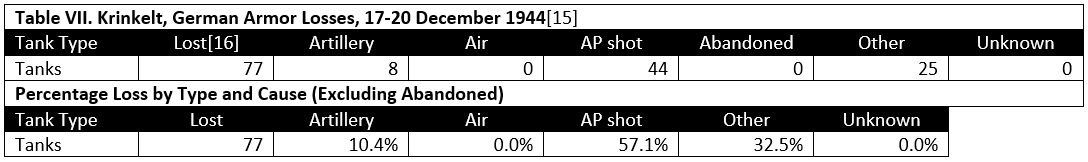
[15] Data from 38th Infantry After Action Report (including “Sketch showing enemy vehicles destroyed by 38th Inf Regt. and attached units 17-20 Dec. 1944″), from 12th SS PzD strength report dated 8 December 1944, and from strengths indicated on the OKW briefing maps for 17 December (1st [circa 0600 hours], 2d [circa 1200 hours], and 3d [circa 1800 hours] situation), 18 December (1st and 2d situation), 19 December (2d situation), 20 December (3d situation), and 21 December (2d and 3d situation).
[16] Losses include confirmed and probable losses.
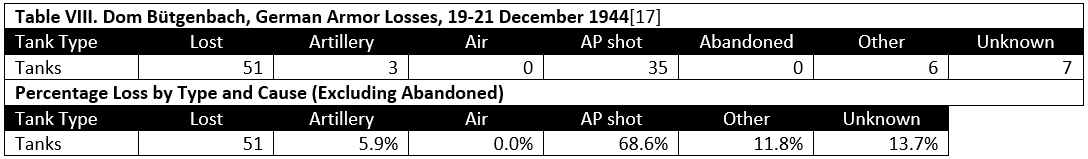
[17] Data from Combat Interview “26th Infantry Regiment at Dom Bütgenbach” and from 12th SS PzD, ibid.
The U.S. Army 333rd Field Artillery Battalion (Colored) in Normandy, July 1944 (US Army Photo/Tom Gregg)
[This series of posts is adapted from the article “Artillery Effectiveness vs. Armor,” by Richard C. Anderson, Jr., originally published in the June 1997 edition of the International TNDM Newsletter.]
[11] Five of the 13 counted as unknown were penetrated by both armor piercing shot and by infantry hollow charge weapons. There was no evidence to indicate which was the original cause of the loss.
[12] From ORS Report No. 17
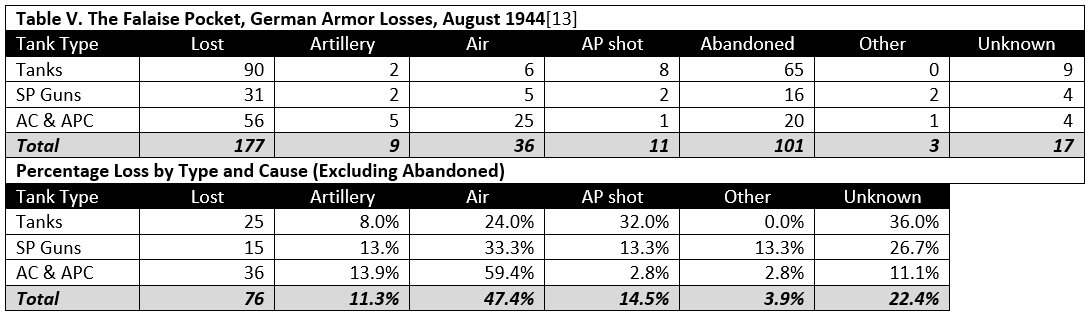
[13] From ORS Report No. 15. The “Pocket” was the area west of the line Falaise-Argentan and east of the line Vassy-Gets-Domfront in Normandy that was the site in August 1944 of the beginning of the German retreat from France. The German forces were being enveloped from the north and south by Allied ground forces and were under constant, heavy air attack.
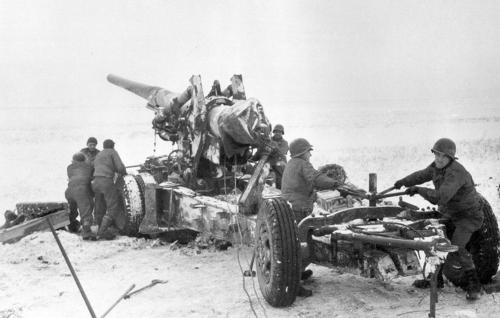
German Army 150mm heavy field howitzer 18 L/29.5 battery. [Panzer DB/Pinterest]
[This series of posts is adapted from the article “Artillery Effectiveness vs. Armor,” by Richard C. Anderson, Jr., originally published in the June 1997 edition of the International TNDM Newsletter.]
Curiously, at Kursk, in the case where the highest percent loss was recorded, the German forces opposing the Soviet 1st Tank Army—mainly the XLVIII Panzer Corps of the Fourth Panzer Army—were supported by proportionately fewer artillery pieces (approximately 56 guns and rocket launchers per division) than the US 1st Infantry Division at Dom Bütgenbach (the equivalent of approximately 106 guns per division)[4]. Nor does it appear that the German rate of fire at Kursk was significantly higher than that of the American artillery at Dom Bütgenbach. On 20 July at Kursk, the 150mm howitzers of the 11th Panzer Division achieved a peak rate of fire of 87.21 rounds per gum. On 21 December at Dom Bütgenbach, the 155mm howitzers of the 955th Field Artillery Battalion achieved a peak rate of fire of 171.17 rounds per gun.[5]
NOTES
[4] The US artillery at Dom Bütgenbach peaked on 21 December 1944 when a total of 210 divisional and corps pieces fired over 10,000 rounds in support of the 1st Division’s 26th Infantry.
[5] Data collected on German rates of fire are fragmentary, but appear to be similar to that of the American Army in World War ll. An article on artillery rates of fire that explores the data in more detail will be forthcoming in a future issue of this newsletter. [NOTE: This article was not completed or published.]
Notes to Table I.
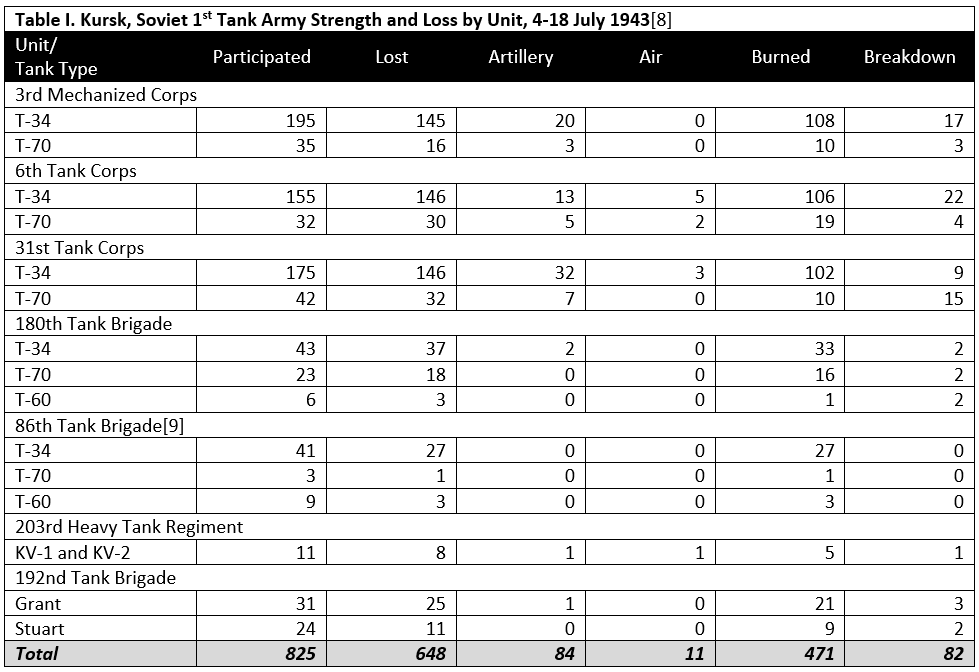
[8] The data were found in reports of the 1st Tank Army (Fond 299, Opis‘ 3070, Delo 226). Obvious math errors in the original document have been corrected (the total lost column did not always agree with the totals by cause). The total participated column evidently reflected the starting strength of the unit, plus replacement vehicles. “Burned'” in Soviet wartime documents usually indicated a total loss, however it appears that in this case “burned” denoted vehicles totally lost due to direct fire antitank weapons. “Breakdown” apparently included both mechanical breakdown and repairable combat damage.
[9] Note that the brigade report (Fond 3304, Opis‘ 1, Delo 24) contradicts the army report. The brigade reported that a total of 28 T-34s were lost (9 to aircraft and 19 to “artillery”) and one T-60 was destroyed by a mine. However, this report was made on 11 July, during the battle, and may not have been as precise as the later report recorded by 1st Tank Army. Furthermore, it is not as clear in the brigade report that “artillery” referred only to indirect fire HE and not simply lo both direct and indirect fire guns.
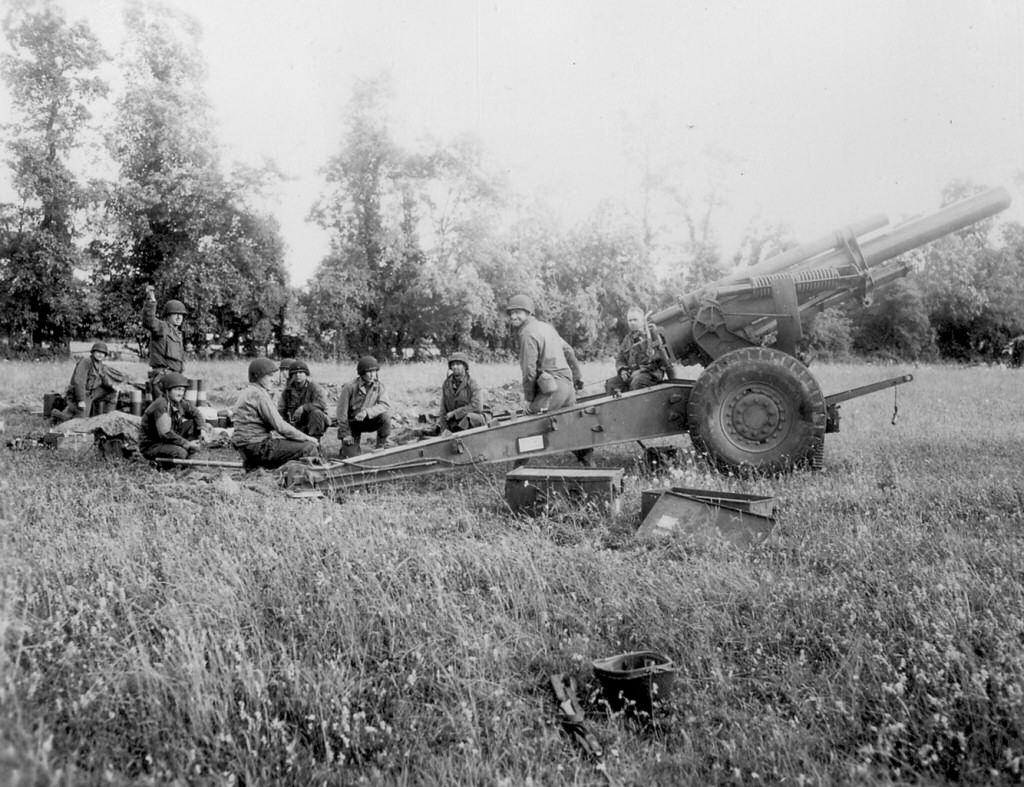
A U.S. M1 155mm towed artillery piece being set up for firing during the Battle of the Bulge, December 1944.
[This series of posts is adapted from the article “Artillery Effectiveness vs. Armor,” by Richard C. Anderson, Jr., originally published in the June 1997 edition of the International TNDM Newsletter.]
The effectiveness of artillery against exposed personnel and other “soft” targets has long been accepted. Fragments and blast are deadly to those unfortunate enough to not be under cover. What has also long been accepted is the relative—if not total—immunity of armored vehicles when exposed to shell fire. In a recent memorandum, the United States Army Armor School disputed the results of tests of artillery versus tanks by stating, “…the Armor School nonconcurred with the Artillery School regarding the suppressive effects of artillery…the M-1 main battle tank cannot be destroyed by artillery…”
This statement may in fact be true,[1] if the advancement of armored vehicle design has greatly exceeded the advancement of artillery weapon design in the last fifty years. [Original emphasis] However, if the statement is not true, then recent research by TDI[2] into the effectiveness of artillery shell fire versus tanks in World War II may be illuminating.
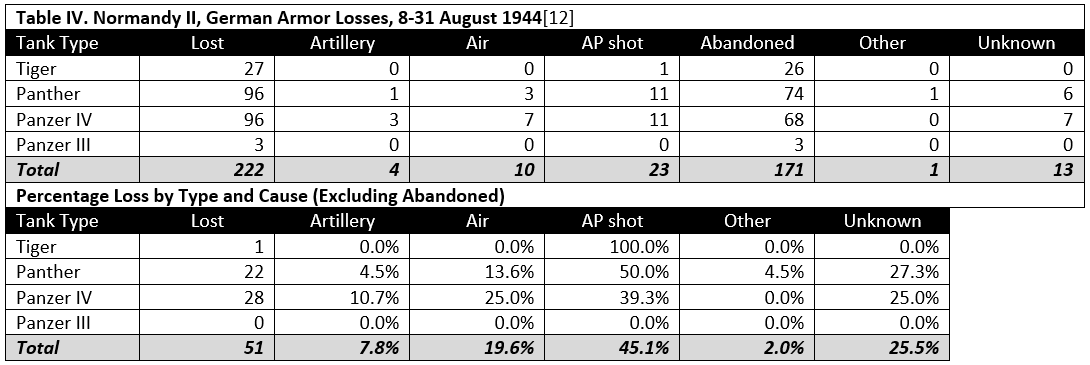
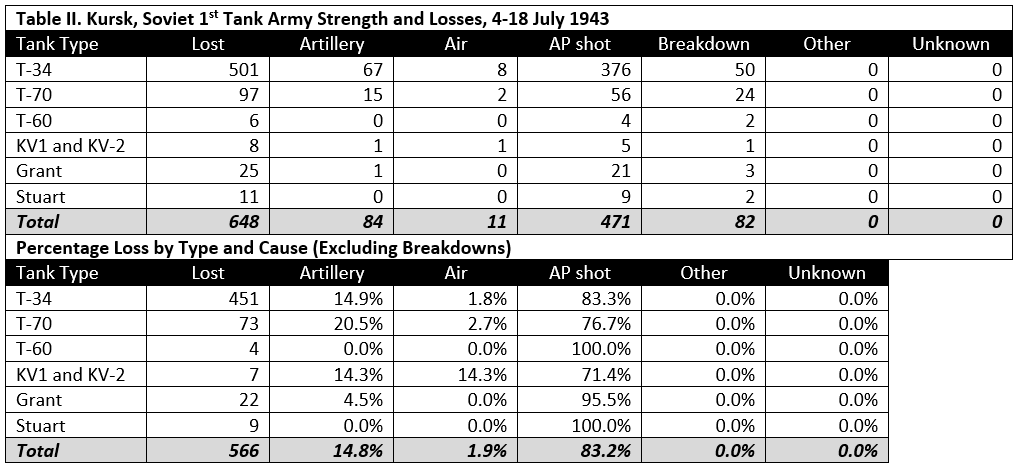
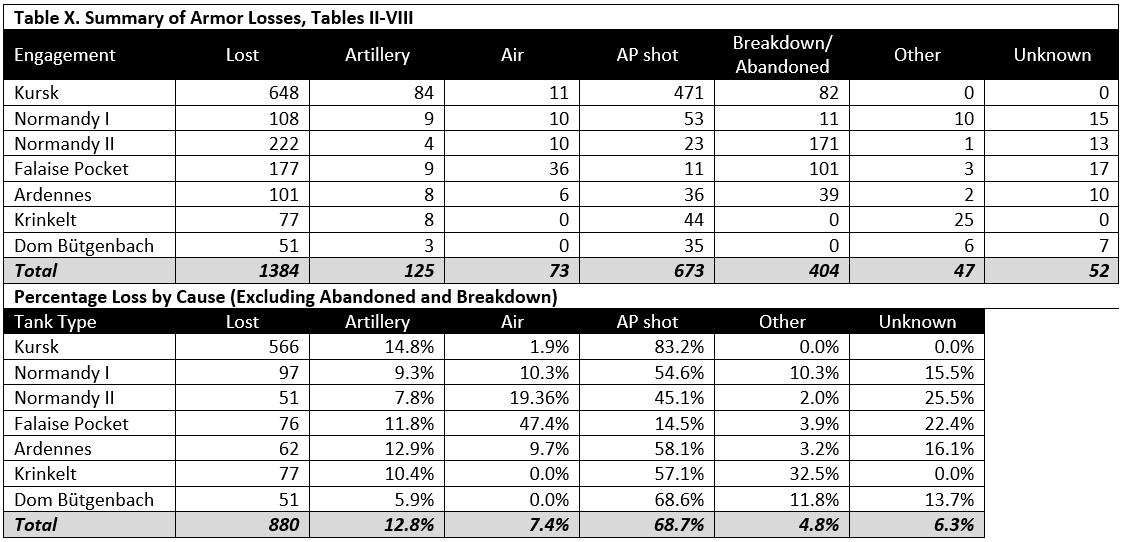
The TDI search found that an average of 12.8 percent of tank and other armored vehicle losses[3] were due to artillery fire in seven eases in World War II where the cause of loss could be reliably identified. The highest percent loss due to artillery was found to be 14.8 percent in the case of the Soviet 1st Tank Army at Kursk (Table II). The lowest percent loss due to artillery was found to be 5.9 percent in the case of Dom Bütgenbach (Table VIII).
The seven cases are split almost evenly between those that show armor losses to a defender and those that show losses to an attacker. The first four cases (Kursk, Normandy l. Normandy ll, and the “Pocket“) are engagements in which the side for which armor losses were recorded was on the defensive. The last three cases (Ardennes, Krinkelt. and Dom Bütgenbach) are engagements in which the side for which armor losses were recorded was on the offensive.
Four of the seven eases (Normandy I, Normandy ll, the “Pocket,” and Ardennes) represent data collected by operations research personnel utilizing rigid criteria for the identification of the cause of loss. Specific causes of loss were only given when the primary destructive agent could be clearly identified. The other three cases (Kursk, Krinkelt, and Dom Bütgenbach) are based upon combat reports that—of necessity—represent less precise data collection efforts.
However, the similarity in results remains striking. The largest identifiable cause of tank loss found in the data was, predictably, high-velocity armor piercing (AP) antitank rounds. AP rounds were found to be the cause of 68.7 percent of all losses. Artillery was second, responsible for 12.8 percent of all losses. Air attack as a cause was third, accounting for 7.4 percent of the total lost. Unknown causes, which included losses due to hits from multiple weapon types as well as unidentified weapons, inflicted 6.3% of the losses and ranked fourth. Other causes, which included infantry antitank weapons and mines, were responsible for 4.8% of the losses and ranked fifth.
NOTES
[1] The statement may be true, although it has an “unsinkable Titanic,” ring to it. It is much more likely that this statement is a hypothesis, rather than a truism.
[2] As pan of this article a survey of the Research Analysis Corporation’s publications list was made in an attempt to locate data from previous operations research on the subject. A single reference to the study of tank losses was found. Group 1 Alvin D. Coox and L. Van Loan Naisawald, Survey of Allied Tank Casualties in World War II, CONFIDENTIAL ORO Report T-117, 1 March 1951.
[3] The percentage loss by cause excludes vehicles lost due to mechanical breakdown or abandonment. lf these were included, they would account for 29.2 percent of the total lost. However, 271 of the 404 (67.1%) abandoned were lost in just two of the cases. These two cases (Normandy ll and the Falaise Pocket) cover the period in the Normandy Campaign when the Allies broke through the German defenses and began the pursuit across France.
I have taken a look in previous posts at how the historical relationship identified by Trevor Dupuy between weapon lethality, battlefield dispersion, and casualty rates argues against this assumption with regard to personnel attrition and tank loss rates. What about artillery loss rates? Will long-range precision fires make ground-based long-range precision fire platforms themselves more vulnerable? Historical research suggests that trend was already underway before the advent of the new technology.
In 1976, Trevor Dupuy and the Historical Evaluation and Research Organization (HERO; one of TDI’s corporate ancestors) conducted a study sponsored by Sandia National Laboratory titled “Artillery Survivability in Modern War.” (PDF) The study focused on looking at historical artillery loss rates and the causes of those losses. It drew upon quantitative data from the 1973 Arab-Israel War, the Korean War, and the Eastern Front during World War II.
Conclusions
1. In the early wars of the 20th Century, towed artillery pieces were relatively invulnerable, and they were rarely severely damaged or destroyed except by very infrequent direct hits.
2. This relative invulnerability of towed artillery resulted in general lack of attention to the problems of artillery survivability through World War II.
3. The lack of effective hostile counter-artillery resources in the Korean and Vietnam wars contributed to continued lack of attention to the problem of artillery survivability, although increasingly armies (particularly the US Army) were relying on self-propelled artillery pieces.
4. Estimated Israeli loss statistics of the October 1973 War suggest that because of size and characteristics, self-propelled artillery is more vulnerable to modern counter-artillery means than was towed artillery in that and previous wars; this greater historical physical vulnerability of self-propelled weapons is consistent with recent empirical testing by the US Army.
5. The increasing physical vulnerability of modern self-propelled artillery weapons is compounded by other modern combat developments, including:
a. Improved artillery counter-battery techniques and resources; b. Improved accuracy of air-delivered munitions; c..increased lethality of modern artillery ammunition; and d. Increased range of artillery and surface-to-surface missiles suitable for use against artillery.
6. Despite this greater vulnerability of self-propelled weapons, Israeli experience in the October war demonstrated that self-propelled artillery not only provides significant protection to cannoneers but also that its inherent mobility permits continued effective operation under circumstances in which towed artillery crews would be forced to seek cover, and thus be unable to fire their weapons. ‘
7. Paucity of available processed, compiled data on artillery survivability and vulnerability limits analysis and the formulation of reliable artillery loss experience tables or formulae.
8. Tentative analysis of the limited data available for this study indicates the following:
a. In “normal” deployment, percent weapon losses by standard weight classification are in the following proportions:
b. Towed artillery losses to hostile artillery (counterbattery) appear in general to very directly with battle intensity (as measured by percent personnel casualties per day), at a rate somewhat less than half of the percent personnel losses for units of army strength or greater; this is a straight-line relationship, or close to it; the stronger or more effective the hostile artillery is, the steeper the slope of the curve;
c. Towed artillery losses to all hostile anti-artillery means appears in general to vary directly with battle intensity at a rate about two-thirds of the-percent personnel losses for units of army strength or greater; the curve rises slightly more rapidly in high intensity combat than in normal or low-intensity combat; the stronger or more effective the hostile anti-artillery means (primarily air and counter-battery), the steeper the slope of the curve;
d. Self-propelled artillery losses appear to be generally consistent with towed losses, but at rates at least twice as great in comparison to battle intensity.
9. There are available in existing records of US and German forces in World war II, and US forces in the Korean and Vietnam Wars, unit records and reports that will permit the formulation of reliable artillery loss experience tables and formulae for those conflicts; these, with currently available and probably improved, data from the Arab-Israeli wars, will permit the formulation of reliable artillery loss experience tables and formulae for simulations of modern combat under current and foreseeable future conditions.
The study caveated these conclusions with the following observations:
Most of the artillery weapons in World War II were towed weapons. By the time the United States had committed small but significant numbers of self-propelled artillery pieces in Europe, German air and artillery counter-battery retaliatory capabilities had been significantly reduced. In the Korean and Vietnam wars, although most American artillery was self-propelled, the enemy had little counter-artillery capability either in the air or in artillery weapons and counter-battery techniques.
It is evident from vulnerability testing of current Army self-propelled weapons, that these weapons–while offering much more protection to cannoneers and providing tremendous advantages in mobility–are much more vulnerable to hostile action than are towed weapons, and that they are much more subject to mechanical breakdowns involving either the weapons mountings or the propulsion elements. Thus there cannot be a direct relationship between aggregated World War II data, or even aggregated Korean war or October War data, and current or future artillery configurations. On the other hand, the body of data from the October war where artillery was self-propelled is too small and too specialized by environmental and operational circumstances to serve alone as a paradigm of artillery vulnerability.
Despite the intriguing implications of this research, HERO’s proposal for follow on work was not funded. HERO only used easily accessible primary and secondary source data for the study. It noted much more primary source data was likely available but that it would require a significant research effort to compile it. (Research is always the expensive tent-pole in quantitative historical analysis. This seems to be why so little of it ever gets funded.) At the time of the study in 1976, no U.S. Army organization could identify any existing quantitative historical data or analysis on artillery losses, classified or otherwise. A cursory search on the Internet reveals no other such research as well. Like personnel attrition and tank loss rates, it would seem that artillery loss rates would be another worthwhile subject for quantitative analysis as part of the ongoing effort to develop the MDB concept.
Images from a Finnish Army artillery salvo fired by towed 130mm howitzers during an exercise in 2013. [Puolustusvoimat – Försvarsmakten – The Finnish Defence Forces/YouTube][This piece was originally posted on 24 August 2017.]
There is probably no obscurity of combat requiring clarification and understanding more urgently than that of suppression… Suppression usually is defined as the effect of fire (primarily artillery fire) upon the behavior of hostile personnel, reducing, limiting, or inhibiting their performance of combat duties. Suppression lasts as long as the fires continue and for some brief, indeterminate period thereafter. Suppression is the most important effect of artillery fire, contributing directly to the ability of the supported maneuver units to accomplish their missions while preventing the enemy units from accomplishing theirs. (p. 251)
Official US Army field artillery doctrine makes a distinction between “suppression” and “neutralization.” Suppression is defined to be instantaneous and fleeting; neutralization, while also temporary, is relatively longer-lasting. Neutralization, the doctrine says, results when suppressive effects are so severe and long-lasting that a target is put out of action for a period of time after the suppressive fire is halted. Neutralization combines the psychological effects of suppressive gunfire with a certain amount of damage. The general concept of neutralization, as distinct from the more fleeting suppression, is a reasonable one. (p. 252)
Despite widespread acknowledgement of the existence of suppression and neutralization, the lack of interest in analyzing its effects was a source of professional frustration for Dupuy. As he commented in 1989,
The British did some interesting but inconclusive work on suppression in their battlefield operations research in World War II. In the United States I am aware of considerable talk about suppression, but very little accomplishment, over the past 20 years. In the light of the significance of suppression, our failure to come to grips with the issue is really quite disgraceful.
This lack of interest is curious, given that suppression and neutralization remain embedded in U.S. Army combat doctrine to this day. The current Army definitions are:
Suppression – In the context of the computed effects of field artillery fires, renders a target ineffective for a short period of time producing at least 3-percent casualties or materiel damage. [Army Doctrine Reference Publication (ADRP) 1-02, Terms and Military Symbols, December 2015, p. 1-87]
Neutralization – In the context of the computed effects of field artillery fires renders a target ineffective for a short period of time, producing 10-percent casualties or materiel damage. [ADRP 1-02, p. 1-65]
A particular source for Dupuy’s irritation was the fact that these definitions were likely empirically wrong. As he argued in Understanding War,
This is almost certainly the wrong way to approach quantification of neutralization. Not only is there no historical evidence that 10% casualties are enough to achieve this effect, there is no evidence that any level of losses is required to achieve the psycho-physiological effects of suppression or neutralization. Furthermore, the time period in which casualties are incurred is probably more important than any arbitrary percentage of loss, and the replacement of casualties and repair of damage are probably irrelevant. (p. 252)
Thirty years after Dupuy pointed this problem out, the construct remains enshrined in U.S. doctrine, unquestioned and unsubstantiated. Dupuy himself was convinced that suppression probably had little, if anything, to do with personnel loss rates.
I believe now that suppression is related to and probably a component of disruption caused by combat processes other than surprise, such as a communications failure. Further research may reveal, however, that suppression is a very distinct form of disruption that can be measured or estimated quite independently of disruption caused by any other phenomenon. (Understanding War, p. 251)
He had developed a hypothesis for measuring the effects of suppression, but was unable to interest anyone in the U.S. government or military in sponsoring a study on it. Suppression as a combat phenomenon remains only vaguely understood.
In my book (page 767) I state that the 6th Panzer Division lost 38 tanks this day. Let us look where those figures came from.
In the Provisional Army Kempf files is a report of “The Tank Situation on 9 July early [morning]. It is file T312, R58, page 4374. They report for the 6th Panzer Division
Ready for Action Lost on 8.7.43
Pz II 7 1
Pz III short —
Pz III long 24
Pz III 75 12 1
Pz IV short —
Pz IV long 14
Command 3
Flame 10
VI —
Assault Gun —
Total 70 2
The next page of the report for 10 July (again “early” as in früh, which I gather means “early” or “early in the morning”).
Ready for Action Lost on 9.7.43
Pz II 0?
Pz III short —
Pz III long 12
Pz III 75 1
Pz IV short —
Pz IV long 7
Command 2
Flame —
VI —
Assault Gun —
Total 22
There is no report on losses for the 9th for the 6th PzD but there are for the other units (including the 19 Tigers lost by the 503rd Heavy Tank Battalion).
So….70 – 22 = 48. Now 5 of the 10 flamepanzers were detached to the 19th Panzer Division, so not sure of their status. If I subtract them out, I end up with 38 tanks lost.
As the first report is early on the 9th and the next report is early on the 10th, then I can only assume that most, if not all losses, were suffered on the 9th.
There was a book page that was copied by one commentator
You will note that it shows 70 tanks on 9 July (9Julam) and 22 tanks of 10 July (10 Julam). I am guessing that “9Julam” means morning of 9 July. If so, this chart appears to have been created from the same data I have and indicates up to 48 losses on 9 July.
Is this issue settled? There are similar reports for the rest of the armor units in Provisional Army Kempf.
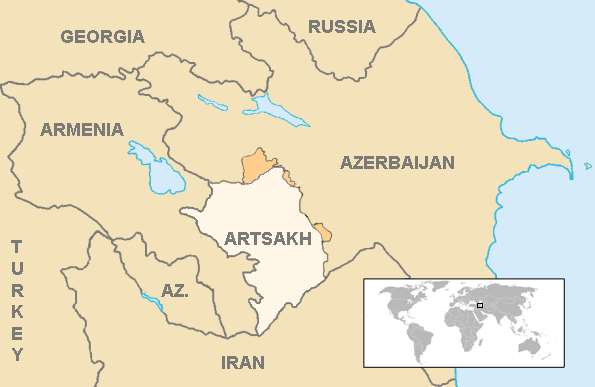
The Soviet Union broke up into 15 separate countries in December 1991. What would a reconstituted Soviet Union/Russian Empire look like, if that is indeed one of the goals of Russian leadership (and some people say it is).
The three Baltic states appear to be out of their grasp, being members of NATO. They are militarily protected by an alliance of 29 members, and their economic growth has been significant. The per capita income of Estonia is $19,840 (IMF 2017), while that of Russia is $10,608. Half of Russia’s GDP is in Moscow, just to drive home what the rest of the country is like.
Some of these countries are united into the Eurasian Economic Union. It consists of five countries: Russia, Armenia, Belarus, Kazakhstan, Kyrgyzstan. It was Ukrainian President Yanukovych’s decision to develop closer economic ties with Russia and the Eurasian Union and back away from an association agreement with the European Union (28 countries) that started the Euromaiden protests in November 2013 that lead to his removal from power in February 2014 (and the Russian seizure of Crimea and the Russian-influenced revolts in Lugansk and Donetsk). The Eurasian Union flag is below. Interesting map choice.
So who would be in a reconstituted Soviet Union/ Russia Empire?
There are the five “stans” in Central Asia (Kazakstan, Uzbekiskan, Kyrgystan, Tajikistan, and Turkmenistan). By the nature of their geography they are somewhat isolated, landlocked, and potentially could be brought back into Russia’s orbit. Two countries are already members of the Russian created Eurasian Union. There is also Belarus, another Eurasian Union member. Belarus does not have a strong history of independence and could be brought back into Russia’s orbit. Belarus might very well rejoin Russia after its dictator Lukaschenko (age 64) moves on to wherever he ends up. These could reconstitute a new force if they could be brought into Russia’s orbit. Some stats:
(2018 est.) (IMF 2017)
Population GDP (millions)
Russia 146,877,088 $1,527,469
Uzbekistan 32,653,900 47,883
Kazakhstan 18,292,700 160,839
Belarus 9,478,200 54,436
Tajikistan 8,931,000 7,234
Kyrgystan 6,309,300 7,061
Turkmenistan 5,851,466 37,926
Sub-Total 228,393,654 1,842,848
This adds up. It is more significant demographically than economically. The per capita income of Uzbekistan is $1,491 per year and Kyrgyzstan and Tajikistan are worse. This recombined country would move from being the 12th richest in the world up to being the 10th richest, ahead of Canada but behind Italy.
Now there are three countries in the Caususus: Georgia, Azerbaijain, and Armenia and four odd political entities (Abkhazia, North Ossetia, Artsakh and Chechnya). Of the three former Soviet countries, Georgia is openly hostile to Russia (and Abkhazia and North Ossetia have been carved from it) and Azerbaijain and Armenia are hostile to each other. They fought a war over the province of Nagorno-Karabakh from 1988-1994, which Armenia won. It is now the Republic of Artsakh.
Only Armenia is a member of the Eurasian Union. It will be difficult for Russia to bring these three nations into its fold for a number of reasons, but again they remain relatively isolated with only Iran and Turkey as the neighbors in the region. So…lets us assume this somehow happens:
Population GDP (millions)
Old Sub-total 228,393,654 1,842,848
Azerbaijain 9,943,226 40,670
Georgia 3,729,600 15,230
Armenia 2,969,800 11,037
Abkhazia 240,705 N/A
Artsakh 145,053 N/A
New sub-total 245,422,038 1,909,785
They are all pretty poor, with Azerbaijan having a per capita income of $4,141 and Georgia and Armenia having similar slightly lower numbers.This really does not get a new Russia Empire back to being a world power. Italy still has a larger GDP.
This now assembles 10 of the original 15 republics together. The three Baltic states are out of reach without a world war, and that leaves only Ukraine and Moldova.
Population GDP
Ukraine 42,248,129 109,321
Moldova 3,550,900 7,945
Transnistria 470,600 N/A
Note that the Ukrainian population figures excludes Crimea and Sevastopol but includes Lugansk and Donetsk. The per capita income of Ukraine is $2,583 and Moldova is $2,280.
It is clear that if one was going to re-constitute the Soviet Union/Russian Empire that Ukraine is the real prize here. Some argue that this is what the conflict in 2013-2014 was about, and is the source of the continued conflict over Crimea, Lugansk and Donetsk.
A 155mm Paladin howitzer with 1st Battery, 10th Field Artillery, 3rd Brigade Combat Team, Task Force Liberty stands ready for a fire mission at forward operating base Gabe April 16, 2005. [U.S. Department of Defense/DVIDS]
Strategic strike? The Army needs to worry about increasing tubes (more than just 155s) and less on fancy munitions. Quantity is a quality all its own in tactical and operational level fires.
— Schrödinger’s Strategist (@barefootboomer) October 1, 2018
@barefootboomer makes a fair point. It appears that the majority of the U.S. Army’s current efforts to improve its artillery capabilities are aimed at increasing lethality and capability of individual systems, but not actually adding additional guns to the force structure.
Are Army combat units undergunned in the era of multi-domain battle? The Mobile Protected Firepower program is intended to provide additional light tanks high-caliber direct fire guns to the Infantry Brigade Combat Teams. In his recent piece at West Point’s Modern War Institute blog, Captain Brandon Morgan recommended increasing the proportion of U.S. corps rocket artillery to tube artillery systems from roughly 1:4 to something closer to the current Russian Army ratio of 3:4.
Should the Army be adding other additional direct or indirect fires systems to its combat forces? What types and at what levels? Direct or indirect fire? More tubes per battery? More batteries? More battalions?
What do you think?
UPDATE: I got a few responses to my queries. The balance reflected this view:
Quantity has a quality all its own until it’s outranged, then it has none at all. The Army shouldn’t seek range, precision, responsiveness, and capacity in isolation, but holistically.
More is always better when it comes to Indirect fires. We’ve shifted to reliance on Joint fires and reduced our organic capability, in number of tubes and battalions. All our potential peer/near-peer adversaries outrange and out gun us. We need to fix that.
— Schrödinger’s Strategist (@barefootboomer) October 5, 2018
There were not many specific suggestions about changes to the existing forces structure, except for this one:
More mortars of all types (light, medium, heavy) at battalion and below.
Are there any other thoughts or suggestions out there about this, or is the consensus that the Army is already pretty much on the right course toward fixing its fires problems?
 The data are limited at this time to the seven cases.[6] Further research is necessary to expand the data sample so as to permit proper statistical analysis of the effectiveness of artillery versus tanks.