Category World War II

The Performance of Armies in Italy, 1943-44


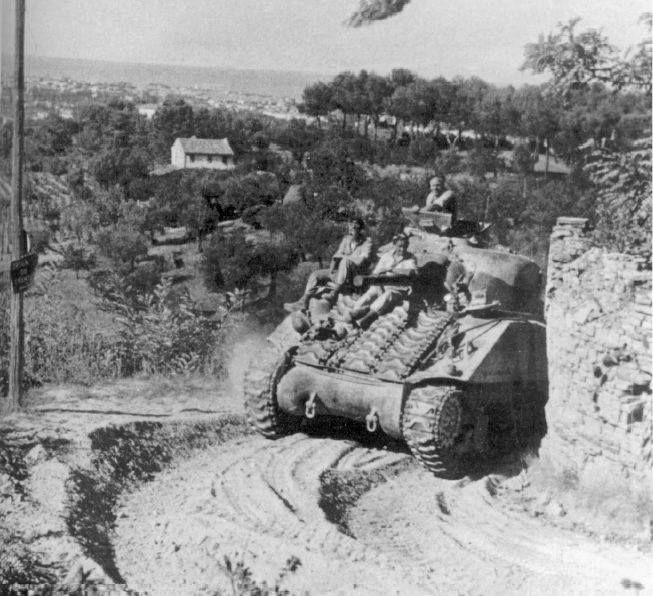
Polish Sherman III after battle on Gothic Line, Italy, September 1944

Having looked at casualty exchanges from my book War by Numbers and in the previous post, it is clear that there are notable differences between the German and Soviet armies, and between the Israeli and Arab armies. These differences show up in the force ratio tables, in the percent of wins, and in the casualty exchange ratios. As shown above, there is also a difference between the German and the U.S. and UK armies in Italy 1943-44, but this difference is no where to the same degree. These differences show up in the casualty exchange ratios. They also will show up in the force ratio comparisons that follow.

The Italian Campaign is an untapped goldmine for research into human factors. In addition to German, American and British armies, there were Brazilian, Canadian, French, French Algerian, French Moroccan, Greek, Indian, Italian, New Zealander, Polish, and South African forces there, among others like the Jewish brigade. There was also an African-American Division and a Japanese-American battalion and regiment actively engaged in this theater. Also the German records are much better than they were in the second half of 1944. So, the primary source data these engagements are built from are better than the engagements from the ETO.

We have 137 engagements from the Italian Campaign. There are 136 from 9 September to 4 June 1944 and one from13-17 September 1944. Of those, 70 consisted of the Americans attacking, 49 consisted of armed forces of the United Kingdom in the offense, and 18 consisted of the Germans attacks, often limited and local counterattacks (eight attacks against the United States and ten attacks against the UK). So, let us compare these based upon force ratios.

American Army attacking the German Army, Italy 1943-44

(70 cases in the complete data set, 62 cases in the culled data set)


Force Ratio……………Percent Attacker Wins………………..Number of Cases

1.22 to 1.49……………………….42%………………………………………..26

    Culled…………………………………48…………………………………………21[1]

1.50 to 1.95………………………..43………………………………………….30

    Culled…………………………………48…………………………………………27[2]

2.02 to 2.23………………………100…………………………………………..4

2.58 to 2.96………………………..71…………………………………………..7

3.04…………………………………100…………………………………………..1

Gap in data

4.11 to 4.25………………………100……………………………………………2


There were seven cases of engagements coded as “limited attacks” and one case of “other”. These eight cases are excluded in the table above on those lines in italics.

Needless to say, this is a fairly good performance by the American Army, with them winning more than 40% the attacks below two-to-one and pretty winning most of them (86%) at odds above two-to-one.


British Army attacking the German Army, Italy 1943-44

(49 cases in the complete data set, 39 cases in the culled data set)


Force Ratio………………..Percent Attacker Wins………………..Number of Cases

0.85………………………………….0%……………………………………………….1

1.17 to 1.41………………………60…………………………………………………5

1.50 to 1.69………………………33…………………………………………………3

2.01 to 2.49………………………50……………………………………………….12

    Culled………………………………..86…………………………………………………7[3]

2.77……………………………….100………………………………………………….1

3.18 to 3.49………………………30………………………………………………..10

    Culled……………………………….43…………………………………………………7[4]

3.50 to 3.73……………………..80…………………………………………………..5

4.23 to 4.99……………………..42…………………………………………………12

    Culled………………………………50…………………………………………………10[5]


There were five cases of limited action and five cases of limited attack. These ten cases are excluded in the table above on those lines in italics.

This again shows the difference in performance between the American Army and the British Army. This is always an uncomfortable comparison, as this author is somewhat of an anglophile with a grandfather from Liverpool; but data is data. In this case they won 44% of the time at attacks below two-to-one, which is similar to what the U.S. Army did. But then, they only won only 63% of the time at odds above two-to-one (using the culled data set). This could just be statistical anomaly as we are only looking at 30 cases, but is does support the results we are seeing from the casualty data.

What is interesting is the mix of attacks. For the American Army 77% of the attacks were at odds below two-to-one, for the British Army only 23% of the attacks were at odds below two-to-one (using the culled data sets). While these 99 cases do not include every engagement in the Italian Campaign at that time, they include many of the major and significant ones. They are probably a good representation. This does probably reflect a little reality here, in that the British tended to be more conservative on the attack then the Americans. This is also demonstrated by the British lower average loss per engagement.[7]

The reverse, which is when the Germans are attacking, does not provide a clear picture.

German Army attacking the American and British Army, Italy 1943-44 – complete data set (18 cases)

Force Ratio…………………..Percent Attacker Wins…………………Number of Cases

0.72 to 0.84………………………….0%………………………………………………7

1.17 to 1.48………………………..50…………………………………………………6

1.89…………………………………….0…………………………………………………1

2.16 to 2.20………………………..50…………………………………………………2

Gap in data

3.12 to 3.24………………………..50…………………………………………………2


The Germans only win in 28% of the cases here. They win in 13% of the engagements versus the U.S. (8 cases) and 40% of the engagements the UK (10 cases). Still, at low odds attacks (1.17 to 1.48-to-1) they are winning 50% of the time. They are conducting 78% of their attacks at odds below two-to-one.

In the end, the analysis here is limited by the number of cases. It is hard to draw any definitive conclusions from only 18 cases of attacks. Clearly the analysis would benefit with a more exhaustive collection of engagements from the Italian Campaign. This would require a significant investment of time (and money).[8]

Regiment de Trois-Rivieres tanks entering the ruins of Regabuto, August 4th, 1943. Source: http://www.sfu.ca/tracesofthepast/wwii_html/it.htm

————————–

[1] There were four limited attacks that resulted in three defender wins and a draw. There was one “other” that was an attacker win.

[2] There three limited attacks that resulted in two defender wins and a draw.

[3] There were four “limited actions” that were defender wins and one “limited attack” that was a defender win.

[4] There as one “limited action” that was a defender win and two “limited attacks” that were defender wins.

[5] There were two “limited attacks” that were defender wins.

[6] The author’s grandfather was born in Liverpool and raised in Liverpool, England and Ryls, Wales. He served in the British merchant marine during World War I and afterwards was part of the British intervention at Murmansk Russia in 1918-1919. See the blog post:

Murmansk

[7] See War by Numbers, pages 25-27. The data shows that for the Americans in those 36 cases where their attack was successful they suffered an average of 353 casualties per engagement. For the 34 American attacks that were not successful they suffered an average of 351 casualties per engagement. For the UK, in the 23 cases where their attack was successful, the UK suffered an average of 213 casualties per engagement. Of the 26 cases where the UK attacks were not successful, they suffered an average of 137 casualties per engagement.

[8] Curt Johnson, the vice-president of HERO, estimated that it took an average of three man-days to create an engagement. He was involved in developing the original database that included about half of the 137 Italian Campaign engagements. My estimation parameter, including the primary source research required to conduct this is more like six days. Regardless, this would mean that just to create this 137 case database took an estimated 411 to 822 man-days, or 1.6 to 3.3 man-years of effort. Therefore, to expand this data set to a more useful number of engagements is going to take several years of effort.

Amphibious and River Crossing Engagements in the Italian Campaign 1943-44

Now, there were a few amphibious operations and major river crossing operations during the Italian Campaign. These are significant enough that we should examine them separately. Among the 141 Italian Campaign engagements there are three amphibious operations and 16 river crossing operations. These are outlined in our previous post:

Amphibious and River Crossing attacks in Italy 1943-44

This is a small number of cases, but does seem to show that the defender has an advantage when defending against amphibious assaults and river crossings. To compare them to the rest of the engagements:


Amphibious Operations Comparison – Italian Campaign 1943-44:

………………………………………………………………..Average..Average

……………………………………………………Percent…Percent…Attacker..Defender

………………………………….……..Cases….Wins…….Advance..Losses…Losses

U.S./UK Attacking – Amphibious…..3……….100………..100………..417……….105

UK Attacking – other RM…………….10………..40………….67…………382………152

U.S. Attacking – other RM…………..20………..65………….80…………341………430


………………………………………….……………Force….Exchange

………………………………….……..Cases…….Ratio…..Ratio

U.S./UK Attacking – Amphibious…..3……………3.45…….3.98-to-1

UK Attacking – other RM…………….10…………..1.94…….2.51-to-1

U.S. Attacking – other RM…………..20…………..1.69…….0.79-to-1


River Crossings Comparison – Italian Campaign 1943-44:

………………………………………………………………..Average..Average

……………………………………………………Percent…Percent…Attacker..Defender

………………………………….……..Cases….Wins…….Advance..Losses…Losses

UK Attacking – River Crossing……8………….63………….67………..169………154

UK Attacking – other FM…………….6………….50………….67………..306………284

U.S. Attacking – River Crossing…..6…………67………….67…………388……..112

U.S. Attacking – Other RM………..17…………59………….76…………374……..477

German Attacking – River Crossing..2……….50………..100…………955………507

German Attacking – Other FM………5………..40………….40…………756………805


………………………………………….……………Force….Exchange

………………………………….……..Cases…….Ratio…..Ratio

UK Attacking – River Crossing……8……………2.20…….1.10-to-1

UK Attacking – other FM…………….6……………1.71…….1.08-to-1

U.S. Attacking – River Crossing…..6…………..1.47…….3.47-to-1

U.S. Attacking – Other RM………..17…………..1.72…….0.78-to-1

German Attacking – River Crossing..2…………1.96…….1.88-to-1

German Attacking – Other FM………5…………1.39……..0.94-to-1


Now this is a very small number of cases for comparison, and just for balance I tried to match it across similar terrain types.[1] Still, even with this very limited data, there appears to be a clear pattern. In every case the exchange ratio more favors the defender. In the case of amphibious operations, this either 2.51-to-1 or 0.79-to-1 compared to 3.98-to-1 for amphibious operations. For river crossings this is 1.08-to-1 compared to 1.10-to-1 for UK river crossings, 0.78-to-1 compared to 3.47-to-1 for U.S. river crossings (or 0.78-to-1 compared to 0.82-to-1 if the two Rapido River engagements are left out), and 0.94-to-1 compared to 1.88-to-1 for German river crossings. Obviously a whole lot more cases would need to be examined to establish anything with certainty, but there are not a lot of amphibious operations over river crossings coded in the ETO or Kursk/Kharkov sections of the database. It would require a significant research effort to assemble such data.

Of course, what this really all points to is that the data needs to be more tightly prescribed and a whole lot more cases need to be assembled.


———

[1] In the case of U.S./UK Attacking – Amphibious, one engagement was done by the U.S. and the other two by the UK. In the case of UK Attacking – River Crossing there were 7 cases in flat mixed terrain and 1 case of rolling mixed terrain. In the case of U.S. Attacking – River Crossing there were 3 cases of rolling mixed terrain, one case of Rugged Mixed, and two cases codes as FB/M, meaning the terrain varied from flat bare to flat mixed. In the case of German Attacking – River Crossing, both engagements were in flat mixed terrain but one was against the U.S. and the other was against the UK. In the case of German Attacking – Other FM two engagements were against the U.S. and three were against the UK.


Amphibious and River Crossing attacks in Italy 1943-44

In a previous post, there is an extended discussion of how much the terrain was influencing the results. One reader asked about amphibious operations and river crossings.

Measuring Human Factors based on Casualty Effectiveness in Italy 1943-1944

Among the 141 Italian Campaign engagements there are three amphibious operations and 16 river crossing operations.

Amphibious Operations – Italian Campaign 1943-44:

…………………………………………..Average..Average

………………………………Percent…Percent…Attacker..Defender

…………………..Cases….Wins…….Advance..Losses…Losses

 UK attacking…3………..100……….100…………417………105

.

…………………………………Force….Exchange

…………………..Cases…….Ratio…..Ratio

UK attacking….3……………3.45…….3.98-to-1


River Crossings – Italian Campaign 1943-44:

…………………………………………..Average..Average

………………………………Percent…Percent…Attacker..Defender

…………………..Cases….Wins…….Advance..Losses…Losses

UK Attacking….8………..63…………67…………169……….154

US Attacking….6………..67…………67…………388……….112

….Less two ……………..100……….100………..122……….150

German………..2…………50……….100………..955……….507

.

…………………………………..Force….Exchange

…………………….Cases…….Ratio…..Ratio

UK Attacking……8…………..2.20…….1.10-to-1

U.S. Attacking….6…………..1.47…….3.47-to-1

….Less two…………………….1.63…….0.82-to-1

German…………..2…………..1.96…….1.88-to-1


The description of the headers is given in the previous post. The “Less two” row is less the two Rapido River engagements by the 36th Infantry Division on the 20th and 21st of January 1944. These were particularly bloody and lopsided engagements (exchange ratios of 12-to-1 and 48-to-1 respectively).

Again, this is a small number of cases, but does seem to show that the defender has an advantage when defending against amphibious assaults and river crossings.

German attacks in Italy by Terrain (1943-44)

In our previous post, there is an extended discussion on how much the terrain was influencing the results.

Measuring Human Factors based on Casualty Effectiveness in Italy 1943-1944

I have done some analysis of the terrain involved. Below are some figures for the German attacks based upon terrain:

Germans Attacking U.S. – Italian Campaign 1943-44:

…………………………………………..Average..Average

………………………………Percent…Percent…Attacker..Defender

…………………..Cases….Wins…….Advance..Losses…Losses

Rugged Mixed…..1………..0…………..0…………..250……….1617

Rolling Mixed……1…………0…………..0…………..769……….525

Flat Mixed………..3…………0…………33…………..647……….672

.

…………………………………Force….Exchange

…………………..Cases…….Ratio…..Ratio

Rugged Mixed…..1…………..0.72…….0.15-to-1

Rolling Mixed……1…………..0.84…….1.46-to-1

Flat Mixed………..3………….1.60……..0.96-to-1

.

Germans Attacking UK – Italian Campaign 1943-44:

……………………………………………………….Average..Average

………………………………Percent…Percent…Attacker..Defender

…………………..Cases….Wins…….Advance..Losses…Losses

Rugged Mixed…..3……….33…………33…………312……….623

Rolling Mixed…….3………..0…………..0………….250……….689

Flat Mixed…………4………75…………75………….938………755

.

……………………………..Force….Exchange

…………………Cases…..Ratio…..Ratio

Rugged Mixed…..3…………0.82…….0.50-to-1

Rolling Mixed…….3………..0.78…….0.36-to-1

Flat Mixed…………4……….1.38……..1.24-to-1


This is material that I am developing for a new book tentatively called More War by Numbers.

Anyhow, the terrain is as defined by Trevor Dupuy. What is interesting to look at is the flat mixed terrain compared to rugged and rolling.

Cases is the number of engagements. Needless to say, the number of cases in each category is way too low to be statistically significant….and this is from a data base of 141 cases (for Italy alone). Percent wins is based upon analyst coding of engagements. Percent advance is based upon a different analyst coding of engagements. In it possible that an engagement can be coded as “Attack Advances” and a “Defender” win. It does not happen in these 15 cases. Average attacker and defender losses is based upon the average losses per day (so losses in a multi-day engagement is divided by the number of days). The force ratio is the total strength of the attackers in all these selected engagements divided by the total strength of the defenders in all these selected engagements. The exchange ratio is the total losses of the attackers in all these selected engagements divided by the total losses of the defender in all these selected engagements.

So, for example, in flat mixed terrain there are three cases of the Germans attacking the Americans. The force ratio is 1.60-to-1 (averaged across these attacks) and the exchange ratio is less than one-to-one (0.96-to-1). On the other hand, in the four cases of the Germans attacking the Americans in flat mixed terrain, the weighted force ratio is 1.38-to-1 and the weighted loss ratio is 1.24-to-1, meaning the German attacker lost more than British defender.

I do have similar data for the Americans. It is also pretty confusing to interpret.

Measuring Human Factors based on Casualty Effectiveness in Italy 1943-1944

Then there is our analysis from the 137 engagements from the Italian Campaign. This was new analysis using the entire current version of the database.

………………………………………………………..Average………Average

Italian Campaign Data……………………………Force Ratio….Loss Ratio

All U.S. Attacks (70 cases)………………………..1.80-to-1………2.41-to-1

U.S. Low-odds Attacks (13 cases)……………….1.35-to-1………3.95-to-1

….1.20- to 1.50-to-1

All UK Attacks (49 cases)…………………………3.00-to-1……….3.17-to-1

UK Low-odds Attacks (7 cases)………………….1.29-to-1……….2.20-to-1

….0.85- to 1.50-to-1

All German Attacks (18 cases)………………….1.44-to-1……….1.14-to-1

German Low-odds Attacks (13 cases)…………1.02-to-1……….0.92-to-1

….0.72- to 1.48-to-1


In this case, when the U.S. was the attacker, they lost more than two men for every one the defending Germans lost. The UK lost about three men in the attack for every German loss. When the Germans attacked they lost about one for one. This was true even though the average force ratio of the U.S. and UK were higher than the German attacks.

The low odds attack data just reinforces this impression. When the Americans attack, they loose four men for every defending German lost. The UK low odds attacks are little better in that they loose two men for every defending German lost. When the Germans attacked at low odds, they lost fewer than one for one (from War by Numbers, pages 42-43).

………………………………………………………..Total…………….Total

Italian Campaign Data…………………………..Force Ratio…..Loss Ratio

All U.S. Attacks (70 cases)………………………1.65-to-1………..1.06-to-1

U.S. Low-odds Attacks (13 cases)……………..1.36-to-1………..1.43-to-1

…..1.20- to 1.50-to-1

All UK Attacks (49 cases)…………………………2.58-to-1………1.63-to-1

UK Low-odds Attacks (7 cases)………………….1.24-to-1………1.92-to-1

….0.85- to 1.50-to-1

All German Attacks (18 cases)…………………..1.27-to-1………0.84-to-1

German Low-odds Attacks (13 cases)………….1.03-to-1………0.63-to-1

….0.72- to 1.48-to-1


The Italian data, based upon weighted averages, show a different picture. Most significant is the casualty effectiveness of the U.S. attacks. The shift in the loss ratio from 2.41-to-1 down to 1.06-to-1 is caused a number of smaller engagements having very lopsided exchange ratios. For example the casualty ratios for one of the Rapido River operations were 48.12 to 1. These engagements clearly skewed the statistics. In fact, there is only one other engagement which has a casualty exchange ratio greater than 10.

Using these weighted statistics, if it harder to discern any difference in casualty effectiveness between the U.S. and the Germans. The U.S. had a 1.06-to-1 loss ratio when they attacked (average force ratio of 1.65-to-1), while the Germans had a 0.84-to-1 loss ratio with lower average odds (1.27-to-1). This supports the contention that combat effectiveness favored the Germans by 20 to 30 percent. These figures show the British slightly worse than the U.S., with a casualty effectiveness ratio some 50% worse than the U.S. (from War by Numbers, pages 44-45).

Force Ratios at Kharkov and Kursk, 1943

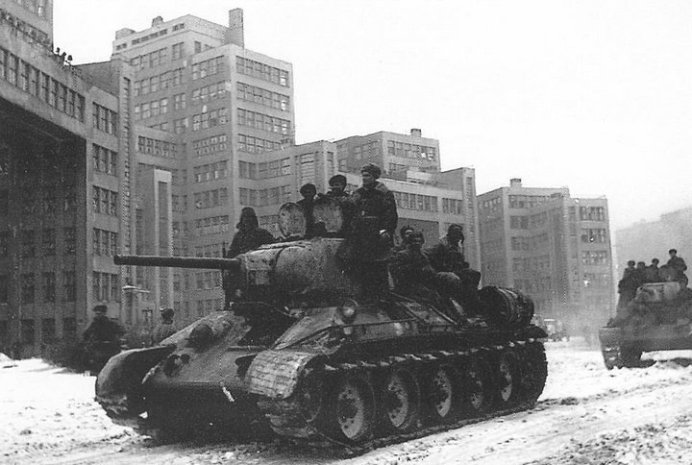
T-34 Tanks near the Derzhprom building during brief Soviet re-occupation of Kharkov, February 1943. Source: https://thecharnelhouse.org/

Now, some of the data provided in the previous posts were muddied by the fact that there were serious differences in the performances of the opposing armies. This is true for the German Army versus the Soviet Army in 1943, the Israeli Army versus the Arab armies in 1956-1973, and for the U.S. Army, USMC and allied armies versus the Iraqi Army in 1991. To a much lesser extent, it is also true for the German Army versus the U.S and UK armies up through the middle of 1944. This is discussed in some depth in my book War by Numbers.

As such, this seems like also a good time to again briefly address this issue. We need to break down the force ratio tables by which nationality is attacking. First let us look at the Eastern Front World War II data:

World War II, Kharkov and Kursk 1943 (180 cases)

German Army attacking the Soviet Army – culled data set (100 cases)

Force Ratio…………………Percent Attacker Wins……………..Number of Cases

0.49………………………………..0%…………………………………………….1

0.58 to 0.95………………………90……………………………………………..10

1.01 to 1.49……………………..100……………………………………………..30

1.52 to 1.96………………………95……………………………………………..19

2.09 to 2.42…………………….100……………………………………………….6

2.57 to 2.87…………………….100……………………………………………….7

3.00 to 3.45…………………….100……………………………………………….8

3.60 to 3.79…………………….100……………………………………………….2

4.31 to 5.85………………………92……………………………………………..13

6.48 to 6.63…………………….100……………………………………………….2

8.60 to 11.41…………………..100……………………………………………….2


In these hundred battles, when the Germans are on the offensive, they win 96% of the time. That is a pretty impressive result. The full data set with another 28 cases that include “limited action” and “limited attack” are listed below.

German Army attacking the Soviet Army – complete data set (128 cases)

Force Ratio………………….Percent Attacker Wins…………………Number of Cases

0.49…………………………………….0%…………………………………………….1

0.58 to 0.95…………………………..47…………………………………………….19

1.01 to 1.49…………………………..88…………………………………………….34

1.52 to 1.96…………………………..77…………………………………………….26

2.09 to 2.42…………………………..86………………………………………………7

2.57 to 2.98…………………………100………………………………………………9

3.00 to 3.45…………………………100………………………………………………8

3.60 to 3.79…………………………100………………………………………………3

4.31 to 5.85…………………………..71…………………………………………….17

6.48 to 6.63…………………………100………………………………………………2

8.60 to 11.41……………………….100………………………………………………2


Out of these 128 battles, when the Germans attack they win 79% of the time. This is still impressive by any standard. Because of the additional cases being “limited action” and “limited attack” there are a lot of drawn engagements in this data set. The “culled” data set has three defender victories and one draw (and 96 attacker wins). This one has five defender victories and 22 drawn engagements. Now, let us look at how the Soviets do in response. These are the opposing forces on the same battlefield, similar terrain, similar weather, and often on the same day

Soviet Army attacking the German Army – culled data set (41 cases)

Force Ratio…………………Percent Attacker Wins…………………Number of Cases

0.40 to 0.43……………………..67%………………………………………………..3

0.51 to 0.99……………………..18…………………………………………………11

1.02 to 1.46……………………..25…………………………………………………16

1.53 to 1.96……………………..50…………………………………………………..4

2.08 to 2.31……………………..50…………………………………………………..4

2.79 to 2.89……………………..33…………………………………………………..3


This is a very different result than what we see for the Germans. Out of the 41 attacks, the Soviets win 13 times or 32%. If I compare the German results of their attacks at odds below three-to-one, I have the Soviets succeeding 32% of the time while the Germans are succeeding 96% of the time (70 out of 73 attacks). Hard to argue that there is not a performance difference as the two armies in 1943 were roughly equivalent in armament and the mix of armaments. Each of the engagements from Kursk are presented in considerable detail in my books on the battle.[1]

The same data, but including “limited action” and “limited attack” is shown below:

Soviet Army attacking the German Army – complete data set (52 cases)

Force Ratio…………………Percent Attacker Wins………………….Number of Cases

0.40 to 0.49……………………..50%…………………………………………………4

0.51 to 0.99……………………..14………………………………………………….14

1.01 to 1.46……………………..19………………………………………………….21

1.53 to 1.96……………………..40……………………………………………………5

2.08 to 2.31……………………..50……………………………………………………4

2.66 to 2.89……………………..25……………………………………………………4


With this data set, out of 52 engagements the attacker still only won 13 times, or 25%.


[1] See Lawrence. Kursk: The Battle of Prokhorovka (2015) and The Battle of Prokhorovka (2019). The first book lays out all 192 engagements from the offensive in the south while the second book provided the detailed data for 76 of the engagements. Each engagement has a separate engagement sheet that lays out the forces involved, their strength and their losses. There is a detail narrative of their operations in the text of the books. If anyone has any questions over the accuracy or interpretation of this data, it is presented in these books, developed primarily from the unit records of both sides (primary sources).

The U.S. Army Three-to-One Rule

Various Three-to-one rules of thumbs have existed in the U.S. Army and in writings possibly as early as the American Civil War (1861-1865). These are fine as “rules of thumb” as long as one does not take them seriously and understands what they really mean. But, unfortunately, we have now seen something that is a loose rule of thumb turned into a codified and quantified rule. This is annoyingly overstating its importance and as given in U.S. Army manuals, is patently false.

The U.S. Army has apparently codified the “three-to-one rule” in its documentation and has given it a value. In the 2014 edition of FM 6-0, paragraph 9-103, it states that “For example, historically, defenders have over a 50 percent probability of defeating an attacking force approximately three times their equivalent strength.” This statement, on the surface, simply is incorrect. For example, the following table from my book War by Numbers is drawn from a series of 116 division-level engagements in France in 1944 against the Germans (see War by Numbers, page 10) They show the following relationship between force ratio and outcome:

European Theater of Operations (ETO) Data, 1944


Force Ratio………………..Result…………………Percent Failure…Number of cases

0.55 to 1.01-to-1.00………Attack Fails…………………..100%……………….5

1.15 to 1.88-to-1.00………Attack usually succeeds……21%………………..48

1.95 to 2.56-to-1.00………Attack usually succeeds……10%………………..21

2.71-to-1.00 and higher…Attacker Advances…………….0%……………….. 42


Now these engagements are from fighting between the U.S., UK and Germany in France and Germany in 1944. These are engagements between forces of roughly equal competence. As can be seen, based upon 42 division-level engagements, in all cases of attacks at three-to-one (more specifically 2.71-to-1 and greater), the attacker advanced. Meaning in all cases of attacks at three-to-one, the attacker won. This directly contradicts the statement in FM 6-0, and contradicts it based upon historical data.

This is supplemented by the following two tables on the next page of War by Numbers. The first table shows the German performance when attacking Soviet units in 1943.

Germans attacking Soviets (Battles of Kharkov and Kursk), 1943


Force Ratio………………..Result………………….Percent Failure…Number of cases

0.63 to 1.06-to-1.00………Attack usually succeeds……..20%……………………..5

1.18 to 1.87-to-1.00………Attack usually succeeds……….6%……………………17

1.91-to-1.00 and higher…Attacker Advances……………….0%……………………21


The next table shows the Soviet performance when attacking German units in 1943:

Soviets attacking Germans (Battles of Kharkov and Kursk), 1943


Force Ratio………………Result…………………..Percent Failure…Number of cases

0.40 to 1.05-to-1…………Attack usually fails…………70%……………………10

1.20 to 1.65-to-1.00…….Attack often fails…………….50%……………………11

1.91 to 2.89-to-1.00…….Attack sometimes fails…….44%……………………..9


These charts are from the fighting around Kharkov in February, March and August of 1943 and the fighting during the Battle of Kursk in July 1943. It is 73 engagements between the German and Soviet armies.

Now, there is a clear performance difference between the German and the Soviet armies at this time. This is discussed in considerable depth in War by Numbers and will not be addressed here. But, what it amounts to is that the German Army has an advantage in the casualty exchange and that advantage also shows up in the outcomes of the battles, as show above. If they attacked at two-to-one odds are greater, they would win. The Soviets attacking at the same odds would win only 56 percent of the time. Clearly, at the division-level, in a unit to unit comparison, the Germans were two or three times better than their Soviet opponents.

Still, even in the worse case, which is the Soviets attacking the Germans, we do not get to the claim made in FM 6-0, which is the defender won 50% of the time when attacked at three-to-one. In fact, the Soviets managed to win 50% of the time when attacking at 1.20 to 1.65-to-1. Something is clearly wrong with the statement in FM 6-0.

Now, at the time I wrote War by Numbers, I was not aware of this sentence planted in FM 6-0 and so therefore did not feel a need to respond to the “three-to-one rule.” It is a rule of thumb, not completely without value, that had been discussed before (see Dupuy, Understanding War, pages 31-37). I thought this issue was properly understood in the U.S. analytical and defense community, therefore I did not feel a need to address it further. It turns out that I do. So, I will take a moment to tap into our databases and properly address this using all the resources at my disposal. This will be in subsequent blog posts.

Losses of the 32nd and 31st Tank Brigades at Prokhorovka

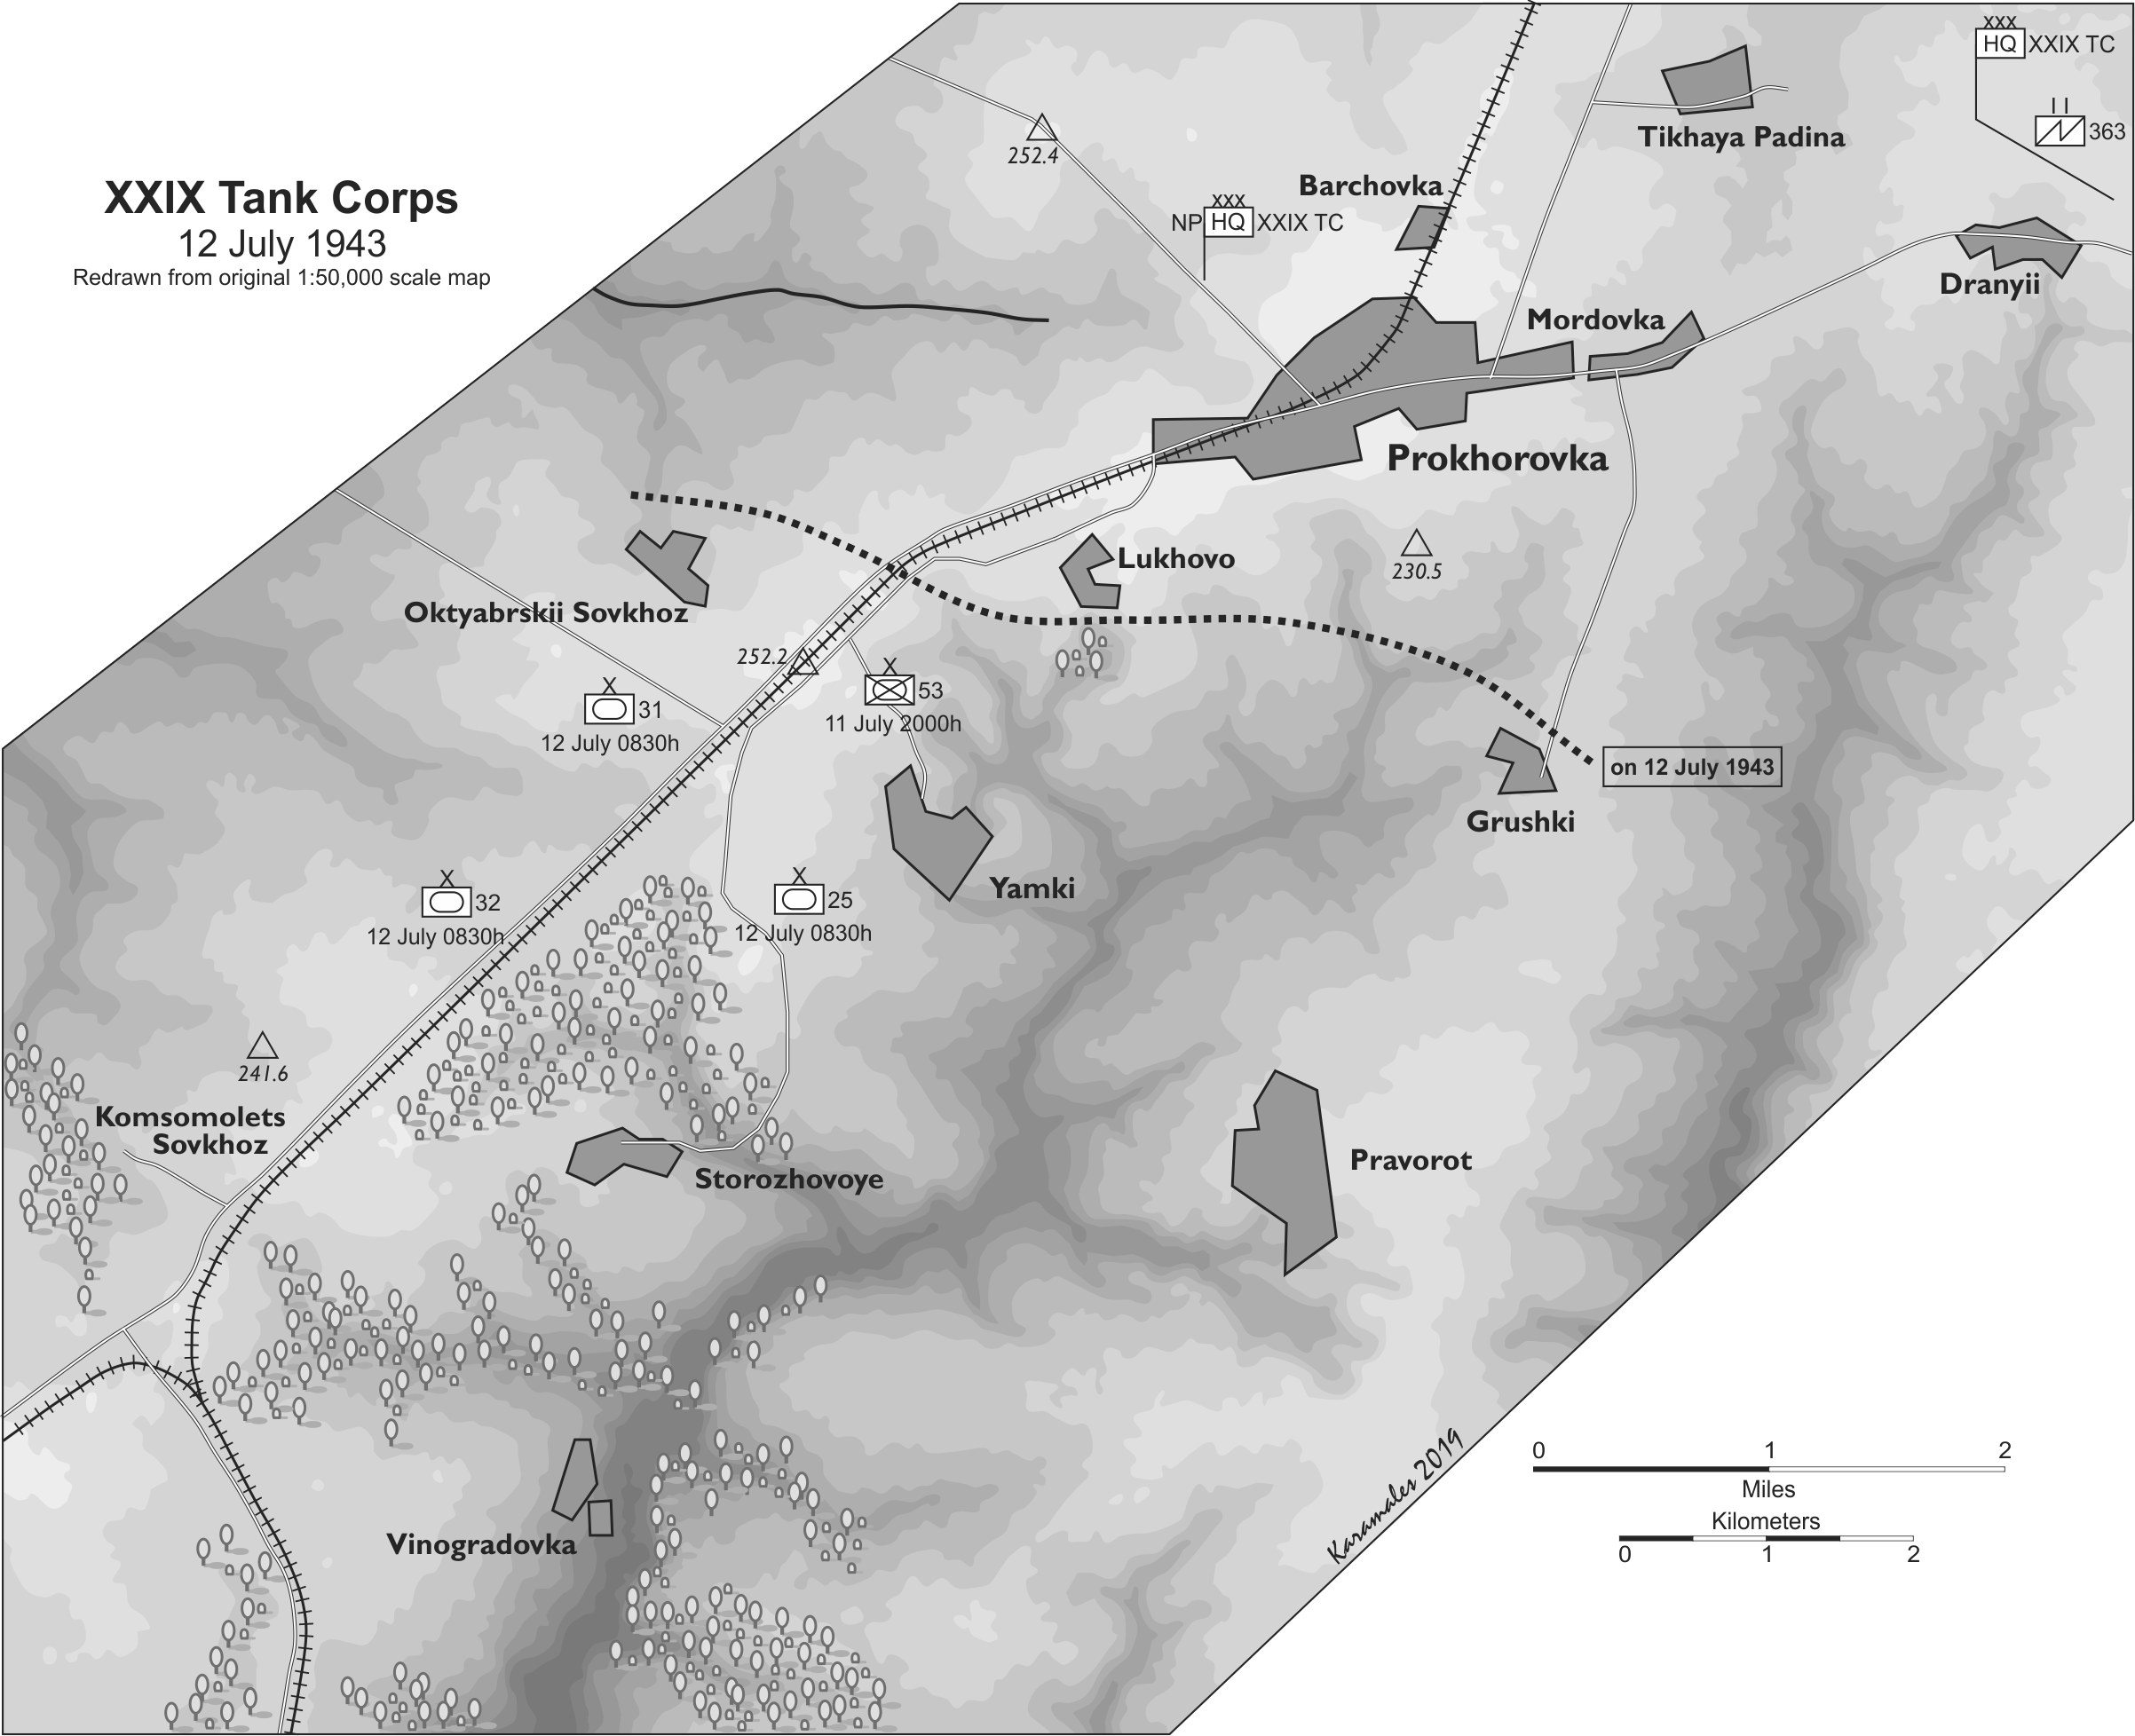
Dr. Wheatley requested me to list out the losses for the 32nd and 31st Tank Brigades on 12 July 1943. They were the two attacking tank brigades on the right flank of the XXIX Tank Corps, with the 32nd Tank Brigade in the first echelon and the 31st in the second echelon. Next to the 32nd Tank Brigade was the 25th Tank Brigade and they were supported by the 53rd Motorized Rifle Brigade. Here are their reports (the text in italics are the direct translations of the reports, done by Dr. Richard Harrison):

Operational Report #90, 0800 July 11, 1943. HQ 29th TC:

Corps material and supply situation:

25th TBde: 32 T-34s, 39 T-70s, 103 cars, 4 45mm guns, 3 37mm guns, 6 82mm mortars

31st TBde: 31 T-34s, 39 T-70s, 103 cars, 4 45mm guns, 2 37mm guns, 6 82mm mortars

32nd TBde: 63-T34s, 102 cars, 4 45mm guns, 2 25mm guns, and 6 82mm mortars

53rd MotRBde: 293 cars, 17 BA-64 armored cars, 12 76mm guns, 12 45mm guns, 30 82mm mortars and 6 120mm mortars.

271st Mortar Rgt: 69 cars and 36 120mm mortars

1446th Self-Propelled ArtRgt: 28 cars, 9 76mm SP guns, 12 122mm howitzers

108th ATArtRgt: 37 cars, 12 76mm guns and 8 45mm guns

75th Motorcycle Bn: 10 BA-64s, 13 cars, 72 motorcycles, and 4 82mm mortars

38th Armored Bn: 7 T-70s, 12 BA-10s, 10 BA-64s and 12 cars

363rd Ind Communications Bn: 74 cars, 10 BA-64s, and 3 T-34s.

193rd Sapper Bn: 31 cars

69th (?) Reconnaissance Bn: 15 cars

72nd (?) Reconnaissance Bn: 10 cars

1st (?) Co: 45 cars

7th (?): 6 cars

Combat Report #73, 1600, July 11, 1943, HQ: 29th TC:

Type……………………….25th TBde…..31st TBde…..32nd TBde…..1446th SP Art Rgt

T-34…………………………31………………29……………….60………………-

T-34 (in repair)…………..1……………….3…………………..4……………….-

T-70………………………..36……………….38………………..-………………..-

T-70 (in repair)…………..3………………..1…………………-…………………-

KV……………………………1………………………………………………………..-

122mm SAU………………1……………………………………………………….11

76mm SAU………………..1………………………………………………………….8

Corps Strength 123 T-34s, 81 T-70s, 11 122mm SAUs, and 8 76mm SAU.

Note that this Corps Strength list does not match the list above in any category. In part because there were 7 T-70s with the 38th Armored Bn and 3 T-34s with the 363rd Ind Communications Bn.

Combat Report #75, 2400, July 12, 1943, HQ 29th TC:

25th Tank Brigade losses: 140 men killed, 180 wounded. 13 T-34s and 10 T-70s were irretrievably lost; 11 T-34s and 10 T-70s were knocked out or hit mines; 7 T-34s and 4 T-70s are out of action due to technical breakdowns.

32nd Tank Brigade losses: 100 men killed and 130 wounded. Overall, 54 T-34s were either burned, knocked out, or are in need of repair.

31st Tank Brigade losses: 20 T-34s and 18 T-70s knocked out and burned. Tanks in line: 3, with the location and condition of the remainder being investigated.

During the night 3 T-34s and 1 122mm SAU were repaired.

The evacuation of knocked-out tanks is being carried out by 3 turretless T-34s and a single M-3 “Grant”. Four brigades are working to restore damaged equipment, with one working to repair self-propelled guns; 2 brigades working to repair 32nd TBdes equipment, and 1 working for 31st TBde.

Note the reference to evacuation of tanks, which does have some definite impact on the photo reconnaissance pictures taken on 16 July and 7 August 1943.

Operational Report #2, 0700, July 13, 1943. HQ 5th Gds Tank Army:

29th TC: Losses: 95 T-34s, 38 T-70s, 8 self-propelled platforms, 240 men killed and 610 wounded.

Combat Report #76, 1300, July 13, 1943, HQ 29th TC:

31st Tank Bde: Material Supply and condition: 8 T-34s and 20 T-70s in line; during the night 8 T-34s were evacuated from the field.

Losses for 12 July: 14 men killed, 27 wounded, and 15 missing. 1 45mm guns wrecked, 1 heavy MG, 2 SMGs and 1 rifle.

25th Tank Bde, consisting of 50th MotRBn, 11 T-70s and 2 guns from an antitank battalion, are defending 1 km east of Storzhevoye.

32nd Tk Bde: Tanks in line: 12 T-34s

1529th Self-Propelled Art Rgt is in Prokhorovka.

Operational Report #91, 0400 July 14, 1943. HQ 29th TC:

25th TBde losses: 40 men killed, 87 wounded, 2 T-70s burns, and 1 knocked out.

53rd MotRBde: Losses for July 12: 517 men killed and missing, and 572 wounded; 16 heavy MGS, 25 AT rifles, 2 45mm guns, 13 light MGs, and 2 cars.

1446th Self-Propelled ArtRgt turned over 2 guns to 25th TBde and 6 to 32nd TBde. Losses for July 12: 19 men killed, 14 wounded; 8 122mm SAUs and 3 76mm SAUs destroyed.

108th ATArtRgt is the corps commander’s reserve without losses

271st Mortar Rgt has been subordinated to 53rd MotRBde. Losses for July 12: 5 men killed and missing, with 4 wounded.

On July 12 1 man was killed and another wounded.

Material Condition:

On hand: 31 T-34s, 40 T-70s, 3 122mm SAUs, and 5 76mm SAUs

Losses: 58 T-34s, 23 T-70s, 8 122mm SAUs, and 3 76mm SAUs

Undetermined location: 18 T-34s and 9 T-70s

Needing major repairs: 11 T-34s and 5 T-70s

Needing lesser repairs: 13 T-34s and 8 T-70s


Operational Report #4, 0700, July 14, 1943. HQ 5th Gds Tank Army:

29th TC: Losses: 3 T-70s, of which 2 were irreplaceable; 40 men killed and 87 wounded. Tanks on hand: 31 T-34s, 40 T-70s.

Operational Report #92, 1600 July 14, 1943. HQ 29th TC:

25th TBde losses: 1 T-70 burns, 1 man killed and 5 wounded.

Equipment Strength:

On hand: 33 T-34s, 39 T-70s, 3 122mm SAUs, and 5 76mm SAUs.


Combat Report #77, 1900, July 14, 1943. HQ 29th TC:

25th TBde: Losses 1 T-70 burned, 1 man killed and 5 wounded.

Operational Report #5, 1900, July 14, 1943. HQ 5th Gds Tank Army:

29th TC: Losses: 1 T-70 burned, 1 man killed and 5 wounded. Tanks on hand: 33 T-34s and 39 T-70s.

Operational Report #6, 0700, July 15, 1943. HQ 5th Gds Tank Army:

29th TC: Tanks in line: 35 T-34s and 40 T-70s

Operational Report #94, 1600 July 15, 1943. HQ 29th TC:

31st TBde: Tanks on hand: 15 T-34s and 20 T-70s. Losses: 1 man killed.

53rd MotRBde: Losses 1 man killed, 17 wounded.

25th TBde: Tanks on hand: 5 T-34s and 19 T-70s. Loses: 1 T-70 knocked out, 1 man killed.

32nd TBde: Tanks on hand: 15 T-34s.

Operational Report #7, 0400, July 16, 1943. HQ 5th Gds Tank Army:

29th TC: Losses: 1 T-70 knocked out, 1 man killed. Tanks in line: 40 T-34s and 45 T-70s.

Combat Report #80, 1900 July 16, 1943 HQ 29th TC:

25th TBde: Losses: none. Material Status: 5 T-34s and 17 T-70s in the line; 4 antitank guns; 5 82mm mortars; 3 37mm AA guns.

31st TBde: Material Status: 16 T-34s and 21 T-70s in the line; 3 45mm guns, 2 37mm guns, 2 MBGs, and 3 82mm guns [probably mortars]

32nd TBde: Losses for July 16: 5 men killed, 5 wounded, 1 T-34. Enemy aircraft, in groups of up to 60 planes, bombed the brigade’s positions 4 times.

One notes that in most wargames, attacking a tank brigade with 120 or more Ju-87s and Fw-190s would probably result in more than 13 casualties (see below).

53rd MotRBde: Losses 2 men wounded. Material status: 11 76mm guns; 7 45mm guns; 51 AT rifles; 19 HMGs, 41 LMGs.

1446th Self-Propelled ArtRgt: Equipment on hand: 4 122mm SAUs and 6 76mm SAUs.

271st Mortar Rgt: Losses: 3 men wounded due to bombing and 3 cars damaged. Material condition: 33 120mm mortars.

108th ATArtRgt: Material status: 12 76mm and 8 45mm guns.

38th Armored Bn: Material status: 7 T-70s, 12 Ba-10s and 10 Ba-64s.

75th Motorcycle Bn: 9 BA-64s and 60 motorcycles.

Operational Report #95, 2400 July 16, 1943. HQ 29th TC:

Losses for July 16: 6 men killed and 19 wounded, 1 T-34, 3 cars knocked out and 3 damaged.’

Material Condition: 42 T-34s, 47 T-70s, 1 KV, 4 122mm SAUs, 6 76mm SAUs, 23 76mm guns, 26 45mm guns, 5 37mm guns, 3 25mm guns, 39 120mm mortars, 44 82mm mortars. By 0600 on July 17 5 T-34s and 3 T-70s will be restored.

Operational Report #96, 2400 July 16, 1943. HQ 29th TC:

Material Status: 42 T-34s, 50 T-70s, 1 KV, 4 122mm SAUs, 6 76mm SAUs, 23 76mm guns, 26 45mm guns, 5 47mm guns, 3 25mm guns, and 44 82mm mortars.

Operational Report #8, 0400, July 17, 1943. HQ 5th Gds Tank Army:

29th TC: Losses: 1 T-34, 5 men killed and 10 wounded. 6 cars smashed or knocked out. Tanks in line: 39 T-34s and 45 T-70s.

XXIX Tank Corps (Fond 332, Opis: 1943, Delo: 80, Pages 2-3):

Information on Equipment Loses and Strengths, July 12-16

Equipment Strength: July 12-16

T-34s: 56

T-70: 52

KV: 1

SU-122: 4

SU-76: 6

Irreplaceable loses (burned)

T-34: 60

T-70: 31

SU-122: 8

SU-76: 3

Transportation Equipment Strength

1.5 tons: 572

2.5-3 tons: 205

Irreplaceable Losses:

1.5 tons: 15

2.5-3 tons: 8

Jeeps: 2

Artillery Strength:

76mm: 23

45mm: 26

37mm AA: 5

25mm AA: 3

120mm Mortar: 39

82mm Mortar: 44

Irreplaceable Artillery Losses:

76mm gun: 1

45mm gun: 1

120mm mortar: 3

82mm mortar: 5

Readiness of Rifle Companies:

25th TBde: 50%

31st TBde: 55%

32nd TBde: 85%

53rd MotRBde: 40%


Note that I had to retype all these entries, and I am ham-fisted, so there might be typo  or two in them.

By the way, reviewing this just reinforces my opinion that the 31st Tank Brigade was in a second echelon position and used as such. May not have ever gotten past Oktyabrskii Sovkhoz.

Did the 170th Tank Brigade get to Ivanovskii Vyiselok?

In Valeri’s Zamulin’s book, the map on the page before page 385 shows the 170th Tank Brigade (XVIII Tank Corps) and the 1/32 Tank Brigade (XXIX Tank Corps) driving all the way to the village of Ivanovskii Vyiselok. I am not sure either of those units got that far. It shows their attack being halted by the 2nd SS Panzer Regiment, which is the Panzer Regiment of the neighboring Das Reich SS Division.

The records I have from the XVIII Tank Corps records has the 170th Tank Brigade by 1200 losing 60% of its equipment, taking Okyabrskii Sovkhoz “despite these losses” and 1200 are fighting along the line “the ravine southeast of Mikhailovka.” As of the Corps’ 1400 daily report the 170th Tank Brigade is still fighting along the line of the ravine southeast of Mikhailovka. ” The records then state that: “the corp’s units, continuing to carry out their mission, by the end of the day had reached the line 200 meters east of the Bororodiskoye church–southern outskirts of Vasilevka-Andreyevka-two windmills at Prelsstnoye–further along the northern slopes of the ravine southeast of Andreyevka–the Okyabrskii Sovkhoz.

Some of the quotes from those records are in this post:

Where were the 181st and 170th Tank Brigades on 12 July 1943?

In the XXIX Tank Corps records I have, there is no mention of this either. For the 1900 report from the corps, they report that the 32nd Tank Brigade “…is attacking the enemy along the line Okyabrskii Sovkhoz, where it was halted by enemy artillery and tank fire, and by his aircraft.” and from the 2400 report they reported that “32nd Tank Brigade, having encountered stubborn enemy resistance, at 1300 forced to go over to the defensive along the line of the Oktyabrskii Sovkhoz.”

The Fifth Guards Tank Army 1900 daily report shows a little more forward movement, with the XVIII Tank Corps reported to have captured Mikhailovka by 1400. It notes that “The Corps’ further advance was contained by the enemy’s powerful artillery and mortar fire from the Greznoye area, and by tank fire from the Bogoroditskoye area.” That same report has the XXIX TAnk Corps by 1400 taking the Komsomolets Sovkhoz and then notes: “…having encountered an enemy counterattack supported by 200 tanks from the Yar Zoslonnyi-Komsomolets Sokhoz, the corps abandoned the Sovkhoz. Units fell back to the line Oktyabrskii Sovkhoz–Storozhevoye, repelling enemy tank counterattacks.”

The Fifth Guards Tank Army’s 0700 13 July report has the XVIII Tank Corps taking the eastern outskirts of Vasilevka by the end of the 12 July, “…but its further advance was halted by the enemy’s artillery and tank fire from the area of the western outskirts of Vasilevka.” The report has the XXIX Tank Corps “…on the line Oktyabrskii Sovkhoz (excl.) Storozhevoye and is repelling enemy counterattacks by a large group of tanks from the Komsomolets Sovkhoz area.”

The Fifth Guards Tank Army’s summary report for 12-24 July has “the 170th and 181st Tank Brigade “…by 1430, after fierce fighting, had taken the Okyabrskii Sovkhoz and had reached Andreyevka and Vasilevka, an advance of 6-7 kilometers (which is putting a good face on a disastrous attack). This is also the report that states “In Andreyevka 181st Tank Brigade met a large column of enemy tanks.” For the XXIX Tank Corps they have “At 1300 32nd and 31st Tank Brigades, following a fiece meeting engagement with enemy tanks along the approaches to the road south of the Oktyabrskii Sovkhoz, were halted by strong enemy tank and AT fire, as well as by aerial bombardment; the brigades went over to the defensive along this line and repulsed four strong tank counterattacks, which resulted in heavy enemy losses.”

So there is simply no mention of such an advance all the way to Ivanovskii Vyiselok in the XVIII Tank Corps records we have, nor in the XXIX Tank Corps records, nor in the Fifth Guards Tank Army records.

I don’t recall the SS records (which are very sparse this day) ever mentioning this.

The Germans have one intelligence map which shows two penetrations. One, probably by the 181st Tank Brigade, on the left flank of the LSSAH Division, and one, probably by the 32nd Motorized Rifle Brigade later in the day at the Storozhevoye woods. I don’t have a convenient version of this map that I can put at the top of this post, but it is on page 950 in my original Kursk book and page 343 in the Prokhorovka book.

I do have a contemporary II Guards Tank Corps map that shows Ivanokskii Vyiselok on 12 July. It shows no action there, although this is not particularly meaningful. As the attacking units were with the XVIII and XXIX Tank Corps, it is not surprising that their operations were not shown on the II Guards Tank Corps maps.

So, where does this claimed attack come from? Well, the only description I know of such an effort is in Zamulin’s book, page 351. He says:

At the same time [1430 or 1600 Moscow time], the forces of the left wing of Bakharov’s corps (the 170th Tank Brigade, part of the 181st Tank Brigade, several tanks from the 31st Tank Brigade mounting infantry from the 32nd Motorized Rifle Brigade) struck out along the gully leading from Andreevka to the southwest in the direction of Hill 241.6. The group attacked resolutely. Taking advantage of the terrain and the dense smoke of the battlefield, the tanks broke through the line of the Leibstandarte’s reconnaissance battalion and unexpectedly burst into the firing positions of the division’s artillery regiment….Within a short time, the 170th Tank Brigade was already fighting in the area of Ivanovskii Vyselok….Hausser immediately concentrated panzer elements from both SS Panzergrenadier Division Leibstandarte and SS Panzergrenadier Division Das Reich against both our tank groups at Komsomolets State Farm and Ivanovskii Vyselok.

So this does put elements of the 170th Tank Brigade at Ivanovskii Vyiselok sometime after 1430. There are a few problems here: First, there are no footnotes on this page. So not sure of the source of this account. Second, it not quite match his map. The map shows the 1/32 Tank Brigade also there, whereas the text on page 351 clearly leaves them stuck in Komsomolets Sovkhoz (“At this moment, the crews of Major Ivanov’s 1st Tank Battalion and the motorized riflemen of Lieutenant Colonel Lipichev’s 53rd Motorized Rifle Brigade from the 29th Tank Corps were still fighting for their lives on the State Farm.”). Third this is a late afternoon attack and a late afternoon penetration of the LSSAH position. This does differ in time from other accounts (as does his putting the Soviet T-34s hitting the tank ditch story after 1300).

Not sure what to make of this account. I assume it is based upon some evidence, but I have no idea what that evidence is.

A Single Four-Company Panzer Battalion in LSSAH?

The LSSAH Tank Regiment on 1 October 1943 (courtesy of Niklas Zetterling)

I am still trying to imagine the composition for a single four medium panzer company and one heavy company panzer battalion in LSSAH on 4 July 1943. The division had 173 tanks, more than the other two SS divisions in the corps. These other two divisions both had two panzer battalions, one created from an antitank battalion. Das Reich had its 166 tanks deployed in 7 medium and light companies and one heavy tank company; while Totenkopf had it 165 tanks in 6 medium and light companies and one heavy tank company. LSSAH may have only had four medium panzer companies (the heavy panzer companies with 12 Tigers and 5 Panzer IIIs are ignored for this discussion).

A German panzer company’s maximum authorized strength was 22 tanks. Rarely do you see overstrength panzer companies. Rarely did you actually see a panzer company at full strength. For example, the Das Reich SS Division with its 7 medium and light panzer companies would have averaged around 14 tanks per company at the start of the offensive. The Totenkopf SS Division with it 6 medium and light panzer companies would have averaged around 17 tanks per company at the start of the offensive. For the four panzer company construct to work the LSSAH, they pretty much have to be at authorized strength. So 4 tank companies = 88 tanks.

The LSSAH had on 4 July: 79 Pz IVs, 9 Pz III Command, 9 Pz III long, 2 Pz III short, 4 Pz IIs and 3 Pz Is.

So 66 Pz IVs in companies 5, 6 and 7 (22 each) and 13 Pz IVs, 3 Pz III Command, 4 Pz III longs and 2 Pz III short in company 8 (22 tanks). This leaves 3 Pz III Command for the battalion command and for the regiment headquarters 3 Pz III Command, 4 Pz IIs and 3 Pz I (and the other 5 Pz III longs are with the Tiger company).

It works. Not sure this is what was done. The problem is that come the evening of 11 July we have LSSAH with 47 Pz IVs, 7 Pz III Command, 4 Pz III long, 1 Pz III short, 4 Pz II and 2 Pz I. Ribbentrop says his 6th company had 7 Pz IVs. So:

Company 5: 18 Pz IVs (guess)

Company 6: 7 Pz IVs

Company 7: 18 Pz IVs (guess)

Company 8: 4 Pz IVs, 1 Pz III Command, 1 Pz III short (guess…with Pz IV losses being proportional to the Pz III losses)

Bn HQ: 3 Pz III Command

Rgt HQ: 3 Pz III Command, 4 Pz II and 2 Pz I

Tiger Company: 4 Pz IIIs (guess) and 4 Pz VIs

I have two issues with this:

  1. Why would you put the weakened 6th company forward (7 tanks) and hold the healthy 5th and 7th companies in the rear?
  2. The division’s Pz IV strength had declined around 40% from 79 to 47.
    1. This means that 6th company lost 70% of its tanks while company 5 and 7 lost 20% or less. This seems odd.
    2. It also appears to put the 8th company with very high losses also (as they lost 4 of their 6 Pz IIIs and I assume a proportional number of Pz IVs).

It is also possible that they had removed all the tanks from the 8th panzer company and put them in the 5th and 7th. I believe this is Ben Wheatley’s claim. This would leave these two companies with 21 tanks and the 6th panzer company with 7.

On the other hand, if the 6th panzer companies losses were in equal proportion to the division’s losses, then a company of 7 tanks started with 12 tanks (79/47 = 1.68 x 7 = 12). If LSSAH had two battalions of 3 panzer companies each with 12-13 tanks then this equal 72-78 tanks. The 9 command tanks are split equally between two battalions and the regiment HQ. This is an organizational arrangement more in line with other two SS divisions.

So, we are back to the construct that either LSSAH had one battalion of four medium panzer companies or two panzer battalions of around six medium panzer companies. But regardless, it does not appear that the LSSAH had just one battalion of three medium panzer companies. It is debatable that there were only three medium panzer companies at Prokhorovka on 12 July 1943.