The Military Conflict Institute (TMCI) decided after a decade of existence that maybe the best use of their time was to write some papers and reports. So this they did over the years, all volunteer (unfunded) work done by some of the “graybeards” of the operations research and combat analysis community.
These three reports are provided here and will be available for as long as this blog exists:
First is called Anatomy of a Combat Model and was written in May 1995 by Lawrence J. Low. It was “prepared as part of a long-term contribution to the field.” It is 81 pages.:
The second paper was from 1997 and is called A Concise Theory of Combat. It was written by Edmund L. DuBois, Wayne P. Hughes, Jr., and Lawrence J. Low “…in collaboration with The Military Conflict Institute.” It is 172 pages.
The third paper was from 2013 and is called A Philosophy of War Its primary authors were Frank Benedict, Rosser Bobbitt, Ted DuBois, Chuck Hawkins, John Honig, Wayne Hughes, John McIver, Roger Mickelson, Clayton Newell, Itzhak Ravid, Russ Vane, Gene Visco and Greg Wilcox. It is 245 pages.
I would also argue that the books Understanding War and Attrition by Trevor Dupuy and my books America’s Modern Wars and War by Numbers are also very much in line with the original mission of TMCI , which Trevor Dupuy co-founded.
Niklas Zetterling’s revised and update version of his excellent book Normandy 1944 is being re-issued. According to Amazon.com it will be available January 10, 2020. The link is here: Normandy 1944
It is set up to “look inside” so you can get some idea what is in there. It is of course, not another war story but a two part discussion on “Campaign Analysis” and “German Combat Formations.”
The “look inside” feature did not include an ability to search the text, so I was not able to check the really important stuff, like how many times Trevor Dupuy and I are mentioned in the book. I am graciously acknowledged in the introduction (as is Richard Anderson). Now, I did write an appendix for the original book. Always the gentleman, Niklas did ask my permission to remove it from this edition.
The book does include a discussion of the relative combat efficiency of the German forces compared to British and U.S. units, always a sensitive subject. We have never invested a lot of time in analyzing Normandy. Most of our analysis of this subject is from Italy 1943-44, Ardennes (Battle of the Bulge) 1944-45 and Kharkov and Kursk 1943 (and shown in War by Numbers). So this is a nice independent look at the subject using additional data from a different campaign by a different scholar.
As a result of a comment by Tom from Cornwall, we ended up adding three posts to this discussion that looked at terrain and amphibious operations and river crossings in Italy:
The previous posts on this discussion on force ratios are presented here. These were the posts examining the erroneous interpretation of the three-to-one rule as presented in Army FM 6-0 and other publications:
We are going to end this discussion for now. There is some additional data from the European Theater of Operations (ETO) and Ardennes that we have assembled, but it presents a confusing picture. This is discussed in depth in War by Numbers (pages 32-48).
I am assembling these discussions on force ratios and terrain into the opening chapters for a follow-on book to War by Numbers.
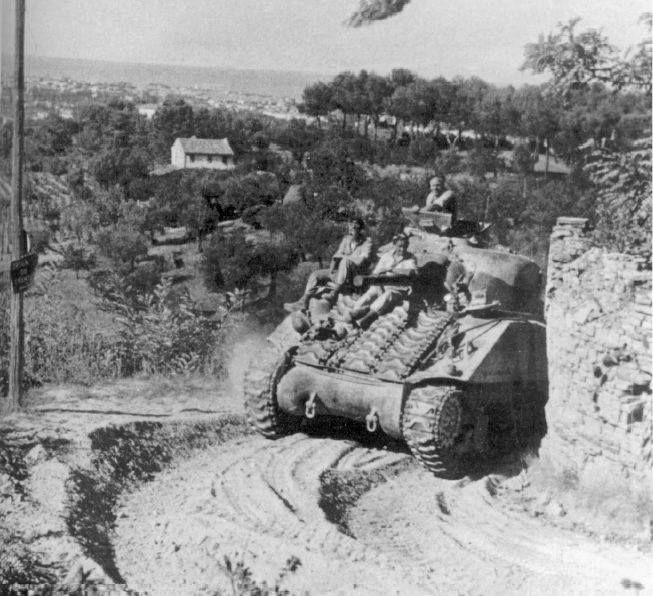
Polish Sherman III after battle on Gothic Line, Italy, September 1944
Having looked at casualty exchanges from my book War by Numbers and in the previous post, it is clear that there are notable differences between the German and Soviet armies, and between the Israeli and Arab armies. These differences show up in the force ratio tables, in the percent of wins, and in the casualty exchange ratios. As shown above, there is also a difference between the German and the U.S. and UK armies in Italy 1943-44, but this difference is no where to the same degree. These differences show up in the casualty exchange ratios. They also will show up in the force ratio comparisons that follow.
The Italian Campaign is an untapped goldmine for research into human factors. In addition to German, American and British armies, there were Brazilian, Canadian, French, French Algerian, French Moroccan, Greek, Indian, Italian, New Zealander, Polish, and South African forces there, among others like the Jewish brigade. There was also an African-American Division and a Japanese-American battalion and regiment actively engaged in this theater. Also the German records are much better than they were in the second half of 1944. So, the primary source data these engagements are built from are better than the engagements from the ETO.
We have 137 engagements from the Italian Campaign. There are 136 from 9 September to 4 June 1944 and one from13-17 September 1944. Of those, 70 consisted of the Americans attacking, 49 consisted of armed forces of the United Kingdom in the offense, and 18 consisted of the Germans attacks, often limited and local counterattacks (eight attacks against the United States and ten attacks against the UK). So, let us compare these based upon force ratios.
American Army attacking the German Army, Italy 1943-44
(70 cases in the complete data set, 62 cases in the culled data set)
Force Ratio……………Percent Attacker Wins………………..Number of Cases
There were seven cases of engagements coded as “limited attacks” and one case of “other”. These eight cases are excluded in the table above on those lines in italics.
Needless to say, this is a fairly good performance by the American Army, with them winning more than 40% the attacks below two-to-one and pretty winning most of them (86%) at odds above two-to-one.
British Army attacking the German Army, Italy 1943-44
(49 cases in the complete data set, 39 cases in the culled data set)
Force Ratio………………..Percent Attacker Wins………………..Number of Cases
There were five cases of limited action and five cases of limited attack. These ten cases are excluded in the table above on those lines in italics.
This again shows the difference in performance between the American Army and the British Army. This is always an uncomfortable comparison, as this author is somewhat of an anglophile with a grandfather from Liverpool; but data is data. In this case they won 44% of the time at attacks below two-to-one, which is similar to what the U.S. Army did. But then, they only won only 63% of the time at odds above two-to-one (using the culled data set). This could just be statistical anomaly as we are only looking at 30 cases, but is does support the results we are seeing from the casualty data.
What is interesting is the mix of attacks. For the American Army 77% of the attacks were at odds below two-to-one, for the British Army only 23% of the attacks were at odds below two-to-one (using the culled data sets). While these 99 cases do not include every engagement in the Italian Campaign at that time, they include many of the major and significant ones. They are probably a good representation. This does probably reflect a little reality here, in that the British tended to be more conservative on the attack then the Americans. This is also demonstrated by the British lower average loss per engagement.[7]
The reverse, which is when the Germans are attacking, does not provide a clear picture.
German Army attacking the American and British Army, Italy 1943-44 – complete data set (18 cases)
Force Ratio…………………..Percent Attacker Wins…………………Number of Cases
0.72 to 0.84………………………….0%………………………………………………7
1.17 to 1.48………………………..50…………………………………………………6
1.89…………………………………….0…………………………………………………1
2.16 to 2.20………………………..50…………………………………………………2
Gap in data
3.12 to 3.24………………………..50…………………………………………………2
The Germans only win in 28% of the cases here. They win in 13% of the engagements versus the U.S. (8 cases) and 40% of the engagements the UK (10 cases). Still, at low odds attacks (1.17 to 1.48-to-1) they are winning 50% of the time. They are conducting 78% of their attacks at odds below two-to-one.
In the end, the analysis here is limited by the number of cases. It is hard to draw any definitive conclusions from only 18 cases of attacks. Clearly the analysis would benefit with a more exhaustive collection of engagements from the Italian Campaign. This would require a significant investment of time (and money).[8]
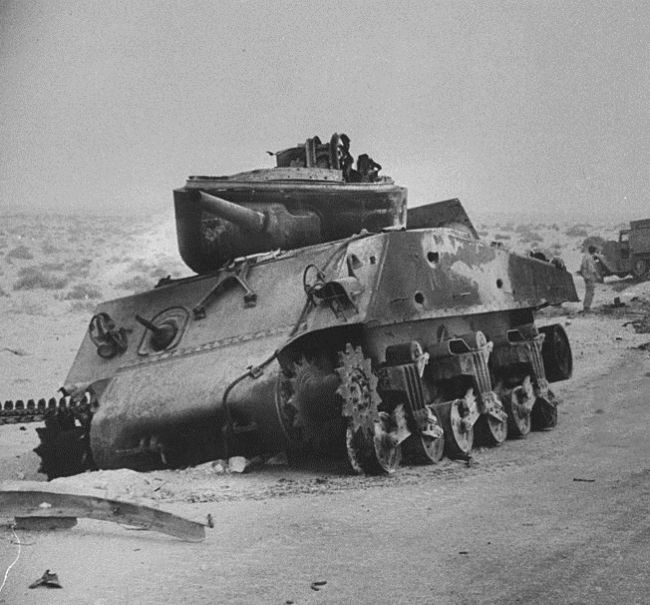
Regiment de Trois-Rivieres tanks entering the ruins of Regabuto, August 4th, 1943. Source: http://www.sfu.ca/tracesofthepast/wwii_html/it.htm
————————–
[1] There were four limited attacks that resulted in three defender wins and a draw. There was one “other” that was an attacker win.
[2] There three limited attacks that resulted in two defender wins and a draw.
[3] There were four “limited actions” that were defender wins and one “limited attack” that was a defender win.
[4] There as one “limited action” that was a defender win and two “limited attacks” that were defender wins.
[5] There were two “limited attacks” that were defender wins.
[6] The author’s grandfather was born in Liverpool and raised in Liverpool, England and Ryls, Wales. He served in the British merchant marine during World War I and afterwards was part of the British intervention at Murmansk Russia in 1918-1919. See the blog post:
[7] See War by Numbers, pages 25-27. The data shows that for the Americans in those 36 cases where their attack was successful they suffered an average of 353 casualties per engagement. For the 34 American attacks that were not successful they suffered an average of 351 casualties per engagement. For the UK, in the 23 cases where their attack was successful, the UK suffered an average of 213 casualties per engagement. Of the 26 cases where the UK attacks were not successful, they suffered an average of 137 casualties per engagement.
[8] Curt Johnson, the vice-president of HERO, estimated that it took an average of three man-days to create an engagement. He was involved in developing the original database that included about half of the 137 Italian Campaign engagements. My estimation parameter, including the primary source research required to conduct this is more like six days. Regardless, this would mean that just to create this 137 case database took an estimated 411 to 822 man-days, or 1.6 to 3.3 man-years of effort. Therefore, to expand this data set to a more useful number of engagements is going to take several years of effort.
Now, there were a few amphibious operations and major river crossing operations during the Italian Campaign. These are significant enough that we should examine them separately. Among the 141 Italian Campaign engagements there are three amphibious operations and 16 river crossing operations. These are outlined in our previous post:
This is a small number of cases, but does seem to show that the defender has an advantage when defending against amphibious assaults and river crossings. To compare them to the rest of the engagements:
Amphibious Operations Comparison – Italian Campaign 1943-44:
UK Attacking – River Crossing……8………….63………….67………..169………154
UK Attacking – other FM…………….6………….50………….67………..306………284
U.S. Attacking – River Crossing…..6…………67………….67…………388……..112
U.S. Attacking – Other RM………..17…………59………….76…………374……..477
German Attacking – River Crossing..2……….50………..100…………955………507
German Attacking – Other FM………5………..40………….40…………756………805
………………………………………….……………Force….Exchange
………………………………….……..Cases…….Ratio…..Ratio
UK Attacking – River Crossing……8……………2.20…….1.10-to-1
UK Attacking – other FM…………….6……………1.71…….1.08-to-1
U.S. Attacking – River Crossing…..6…………..1.47…….3.47-to-1
U.S. Attacking – Other RM………..17…………..1.72…….0.78-to-1
German Attacking – River Crossing..2…………1.96…….1.88-to-1
German Attacking – Other FM………5…………1.39……..0.94-to-1
Now this is a very small number of cases for comparison, and just for balance I tried to match it across similar terrain types.[1] Still, even with this very limited data, there appears to be a clear pattern. In every case the exchange ratio more favors the defender. In the case of amphibious operations, this either 2.51-to-1 or 0.79-to-1 compared to 3.98-to-1 for amphibious operations. For river crossings this is 1.08-to-1 compared to 1.10-to-1 for UK river crossings, 0.78-to-1 compared to 3.47-to-1 for U.S. river crossings (or 0.78-to-1 compared to 0.82-to-1 if the two Rapido River engagements are left out), and 0.94-to-1 compared to 1.88-to-1 for German river crossings. Obviously a whole lot more cases would need to be examined to establish anything with certainty, but there are not a lot of amphibious operations over river crossings coded in the ETO or Kursk/Kharkov sections of the database. It would require a significant research effort to assemble such data.
Of course, what this really all points to is that the data needs to be more tightly prescribed and a whole lot more cases need to be assembled.
———
[1] In the case of U.S./UK Attacking – Amphibious, one engagement was done by the U.S. and the other two by the UK. In the case of UK Attacking – River Crossing there were 7 cases in flat mixed terrain and 1 case of rolling mixed terrain. In the case of U.S. Attacking – River Crossing there were 3 cases of rolling mixed terrain, one case of Rugged Mixed, and two cases codes as FB/M, meaning the terrain varied from flat bare to flat mixed. In the case of German Attacking – River Crossing, both engagements were in flat mixed terrain but one was against the U.S. and the other was against the UK. In the case of German Attacking – Other FM two engagements were against the U.S. and three were against the UK.
In a previous post, there is an extended discussion of how much the terrain was influencing the results. One reader asked about amphibious operations and river crossings.
Among the 141 Italian Campaign engagements there are three amphibious operations and 16 river crossing operations.
Amphibious Operations – Italian Campaign 1943-44:
…………………………………………..Average..Average
………………………………Percent…Percent…Attacker..Defender
…………………..Cases….Wins…….Advance..Losses…Losses
UK attacking…3………..100……….100…………417………105
.
…………………………………Force….Exchange
…………………..Cases…….Ratio…..Ratio
UK attacking….3……………3.45…….3.98-to-1
River Crossings – Italian Campaign 1943-44:
…………………………………………..Average..Average
………………………………Percent…Percent…Attacker..Defender
…………………..Cases….Wins…….Advance..Losses…Losses
UK Attacking….8………..63…………67…………169……….154
US Attacking….6………..67…………67…………388……….112
….Less two ……………..100……….100………..122……….150
German………..2…………50……….100………..955……….507
.
…………………………………..Force….Exchange
…………………….Cases…….Ratio…..Ratio
UK Attacking……8…………..2.20…….1.10-to-1
U.S. Attacking….6…………..1.47…….3.47-to-1
….Less two…………………….1.63…….0.82-to-1
German…………..2…………..1.96…….1.88-to-1
The description of the headers is given in the previous post. The “Less two” row is less the two Rapido River engagements by the 36th Infantry Division on the 20th and 21st of January 1944. These were particularly bloody and lopsided engagements (exchange ratios of 12-to-1 and 48-to-1 respectively).
Again, this is a small number of cases, but does seem to show that the defender has an advantage when defending against amphibious assaults and river crossings.
I have done some analysis of the terrain involved. Below are some figures for the German attacks based upon terrain:
Germans Attacking U.S. – Italian Campaign 1943-44:
…………………………………………..Average..Average
………………………………Percent…Percent…Attacker..Defender
…………………..Cases….Wins…….Advance..Losses…Losses
Rugged Mixed…..1………..0…………..0…………..250……….1617
Rolling Mixed……1…………0…………..0…………..769……….525
Flat Mixed………..3…………0…………33…………..647……….672
.
…………………………………Force….Exchange
…………………..Cases…….Ratio…..Ratio
Rugged Mixed…..1…………..0.72…….0.15-to-1
Rolling Mixed……1…………..0.84…….1.46-to-1
Flat Mixed………..3………….1.60……..0.96-to-1
.
Germans Attacking UK – Italian Campaign 1943-44:
……………………………………………………….Average..Average
………………………………Percent…Percent…Attacker..Defender
…………………..Cases….Wins…….Advance..Losses…Losses
Rugged Mixed…..3……….33…………33…………312……….623
Rolling Mixed…….3………..0…………..0………….250……….689
Flat Mixed…………4………75…………75………….938………755
.
……………………………..Force….Exchange
…………………Cases…..Ratio…..Ratio
Rugged Mixed…..3…………0.82…….0.50-to-1
Rolling Mixed…….3………..0.78…….0.36-to-1
Flat Mixed…………4……….1.38……..1.24-to-1
This is material that I am developing for a new book tentatively called More War by Numbers.
Anyhow, the terrain is as defined by Trevor Dupuy. What is interesting to look at is the flat mixed terrain compared to rugged and rolling.
Cases is the number of engagements. Needless to say, the number of cases in each category is way too low to be statistically significant….and this is from a data base of 141 cases (for Italy alone). Percent wins is based upon analyst coding of engagements. Percent advance is based upon a different analyst coding of engagements. In it possible that an engagement can be coded as “Attack Advances” and a “Defender” win. It does not happen in these 15 cases. Average attacker and defender losses is based upon the average losses per day (so losses in a multi-day engagement is divided by the number of days). The force ratio is the total strength of the attackers in all these selected engagements divided by the total strength of the defenders in all these selected engagements. The exchange ratio is the total losses of the attackers in all these selected engagements divided by the total losses of the defender in all these selected engagements.
So, for example, in flat mixed terrain there are three cases of the Germans attacking the Americans. The force ratio is 1.60-to-1 (averaged across these attacks) and the exchange ratio is less than one-to-one (0.96-to-1). On the other hand, in the four cases of the Germans attacking the Americans in flat mixed terrain, the weighted force ratio is 1.38-to-1 and the weighted loss ratio is 1.24-to-1, meaning the German attacker lost more than British defender.
I do have similar data for the Americans. It is also pretty confusing to interpret.
Then there is our analysis from the 137 engagements from the Italian Campaign. This was new analysis using the entire current version of the database.
………………………………………………………..Average………Average
Italian Campaign Data……………………………Force Ratio….Loss Ratio
All U.S. Attacks (70 cases)………………………..1.80-to-1………2.41-to-1
U.S. Low-odds Attacks (13 cases)……………….1.35-to-1………3.95-to-1
….1.20- to 1.50-to-1
All UK Attacks (49 cases)…………………………3.00-to-1……….3.17-to-1
UK Low-odds Attacks (7 cases)………………….1.29-to-1……….2.20-to-1
….0.85- to 1.50-to-1
All German Attacks (18 cases)………………….1.44-to-1……….1.14-to-1
German Low-odds Attacks (13 cases)…………1.02-to-1……….0.92-to-1
….0.72- to 1.48-to-1
In this case, when the U.S. was the attacker, they lost more than two men for every one the defending Germans lost. The UK lost about three men in the attack for every German loss. When the Germans attacked they lost about one for one. This was true even though the average force ratio of the U.S. and UK were higher than the German attacks.
The low odds attack data just reinforces this impression. When the Americans attack, they loose four men for every defending German lost. The UK low odds attacks are little better in that they loose two men for every defending German lost. When the Germans attacked at low odds, they lost fewer than one for one (from War by Numbers, pages 42-43).
………………………………………………………..Total…………….Total
Italian Campaign Data…………………………..Force Ratio…..Loss Ratio
All U.S. Attacks (70 cases)………………………1.65-to-1………..1.06-to-1
U.S. Low-odds Attacks (13 cases)……………..1.36-to-1………..1.43-to-1
…..1.20- to 1.50-to-1
All UK Attacks (49 cases)…………………………2.58-to-1………1.63-to-1
UK Low-odds Attacks (7 cases)………………….1.24-to-1………1.92-to-1
….0.85- to 1.50-to-1
All German Attacks (18 cases)…………………..1.27-to-1………0.84-to-1
German Low-odds Attacks (13 cases)………….1.03-to-1………0.63-to-1
….0.72- to 1.48-to-1
The Italian data, based upon weighted averages, show a different picture. Most significant is the casualty effectiveness of the U.S. attacks. The shift in the loss ratio from 2.41-to-1 down to 1.06-to-1 is caused a number of smaller engagements having very lopsided exchange ratios. For example the casualty ratios for one of the Rapido River operations were 48.12 to 1. These engagements clearly skewed the statistics. In fact, there is only one other engagement which has a casualty exchange ratio greater than 10.
Using these weighted statistics, if it harder to discern any difference in casualty effectiveness between the U.S. and the Germans. The U.S. had a 1.06-to-1 loss ratio when they attacked (average force ratio of 1.65-to-1), while the Germans had a 0.84-to-1 loss ratio with lower average odds (1.27-to-1). This supports the contention that combat effectiveness favored the Germans by 20 to 30 percent. These figures show the British slightly worse than the U.S., with a casualty effectiveness ratio some 50% worse than the U.S. (from War by Numbers, pages 44-45).
This issue was addressed in multiple chapters of my book War by Numbers, so we will just present a few tables related to casualty effectiveness drawn from that book. They are simple comparisons of the average force ratios for attacks compared to the average loss ratios for these attacks. First, table compares the Soviet Union versus the German Army.
……………………………………………………….Average…………..Average
……………………………………………………….Force Ratio………Loss Ratio
All Soviet Attacks (18 cases)……………………..1.42-to-1…………..5.63-to-1
All German Attacks (31 cases)…………………..1.66-to-1………….0.30-to-1
German Low-odds Attacks (21 cases)…………..0.93-to-1………….0.41-to-1
….0.63- to 1.42-to-1
This shows a very significant casualty effectiveness advantage on the part of the Germans. When the Soviets attacked, they lost an average of 5.63 men for every German lost. When the Germans attacked, the lost .30 men for every man the Soviets lost, or inflicted 3.33 casualties for every 1 they lost. The difference between the effectiveness of the Germans when attacking versus defending is probably explained by the advantages of defense, terrain, etc. When the “odds are even,” which is roughly approximated by the low odds attacks, the Soviets attacked at an average odds of 1-to-1, yet lost almost five men for every one the Germans lost. The Germans attacks at less than 1-to-1, and caused almost 2.5 losses per one of their own (from War by Numbers, page 42)
Now these calculations were based on taking an average of the force ratios and the loss ratios (killed, wounded and missing). One can also sum up the total force ratios for all these attacks and compare them to the total losses for all these attacks. In the table below, the force ratio is the sum of the strength of all the cases, compared to the sum of the strength of the opposing forces, while the losses are the total losses for each side, compared to the losses on the opposing side.
………………………………………………………Total……………Total
Kursk Campaign Data…………………………..Force Ratio……Loss Ratio
All Soviet Attacks (18 cases)……………………..1.43-to-1………6.04-to-1
All German Attacks (31 cases)………………….1.34-to-1……….0.30-to-1
German Low-odds Attacks (21 cases)…………0.99-to-1……….0.27-to-1
…..0.63- to 1.42-to-1
Notice that using the “weighted averages” did not change the numbers much. These figures still support the contention that there is a casualty effectiveness difference between the Germans and the Soviet of around 4 to 1 (from War by Numbers, page 44).
The 51 division-level engagements from the Arab-Israeli fighting show the following relationship:
………………………………………………………..Average………..Average
………………………………………………………..Force Ratio……Loss Ratio
All Israeli Attacks (33 cases)………………………1.29-to-1……….0.46-to-1
All Arab Attacks (18 cases)……………………….3.02-to-1………2.81-to-1
Arab Low-odds Attacks (2 cases)………………..0.95-to-1………3.87-to-1
….0.87 to 1.47 to 1
Now, there are probably performance differences between the Egyptian, Syrian, Jordanian, Iraqi and Palestinian forces, but for the sake of simplicity, all the Arab armies were lumped together. All the Arab attacks, with the exception of Mitla Pass in 1967, are from the 1973 war.
This fighting has the advantage that technologically there was not much difference between the opposing forces. The units were well armed and both sides had considerable armor. The Israeli’s had air superiority although in 1973, the Egyptians had very good air defense. It would appear that the major difference between the two armies was combat effectiveness.
One cannot help but note that the relative combat performance of the Israeli and the Arabs in 1956-1973 was similar in disparity to that between the Germans and the Soviets in 1943. This is not to say that the Germans and the Israelis performed at similar levels, as the only thing we are measuring is the relative combat performance between the two opposing forces. The German army in 1943 could have been superior to the Israeli Army of 1956-1973 and this would have meant that the Soviet Army in 1943 was also superior to the Arab armies in 1956-1973. We do not know if this is the case.
Trevor Dupuy’s analysis, using his model structure, but much of the same data, came to the conclusion that:
“The average Israeli combat effectiveness value (CEV) with respect to the Egyptians in 1967 was found to be 1.75; in other words, a combat effectiveness superiority of almost two-to-one. Following an identical procedure for the 1973 war, the average Israeli CEV with respect to the Egyptians for that war was 1.98…”[1]
As Trevor Dupuy’s combat effectiveness value is a force multiplier in his model of the combat power, then it is not directly comparable to exchange ratios, although it is related. In general, a force multiplier of two in his models will produce a casualty exchange rate of greater than two.[2] For all practical purposes, we are showing the same effect and the same results at roughly the same values.
Still these are forces that are at least competent or motivated enough to engage each other in a back-and-forth conventional engagement. There are many examples of truly one-sided results, like the 1991 Gulf War, and this seems to be typical of lots of operations of the post-World War II world (from War by Numbers, pages 50-51).
[1] Colonel T. N. Dupuy, Elusive Victory: The Arab-Israeli Wars 1947-1974 (HERO Books, Fairfax, VA., 1984), page 598.
[2] See the discussion in Chapter 16, “A New Square Law” in Col. T. N. Dupuy, Understanding War: History and Theory of Combat (Paragon House Publishers, New York, 1987), pages 221-235.
We see a similar disparity in results between the Israeli Army and the various Arab armies they engaged. The Arab armies include Egyptian, Syrian, Jordanian and Iraqi. To simplify we have just lumped the engagements involving these four armies together, although we are certain that there differences between these various armies. The data includes two engagements from 1956, 16 from 1967, one from 1968 and 32 from 1973 for a total of 51 division-level engagements. None of the engagements were coded as “limited action” or “limited attack.”
This database of only 51 engagements has 33 Israeli attacks and 18 attacks by Arab armies. It produces similar lop-sided results:
Israeli Army attacking the Arab armies (33 cases)
Force Ratio………………….Percent Attacker Wins ………………..Number of Cases
0.54 to 0.97………………………81%……………………………………………..16
1.00 to 1.47………………………90………………………………………………..10
1.51 to 1.99…………………….100………………………………………………….2
2.04 to 2.17…………………….100………………………………………………….2
2.90……………………………….100………………………………………………….1
Gap in data
3.50 to 3.96………………………..0………………………………………………….1
4.11 to 5.87………………………..0………………………………………………….1
As can be seen, the Israeli’s are wining 81% of the time that they attack at odds of less the one-to-one. Out of the 33 engagements where they are the attackers, they lose four and draw two. They are winning 82% of the time. Most of their attacks (79% of them) are at low odds, between 0.54- to 1.47-to-one. They win these attacks 80% to 90% of the time. They have two defeats at high odds, but in both cases, they advanced during the battle. At Jebel Libni in June 1967 they attacked at 3.60-to-one odds and advanced five kilometers. The engagement is coded as a draw because the Egyptian forces were able to successfully withdraw, as they were intending, while the Israeli forces had to rest and regroup. Both sides claimed victory. At Abu Ageila in October 1956, thee Israelis attacked at 4.57 odds and advanced 15 kilometers. This three-day engagement was coded as a defeat because the Israeli mission was to advance to Port Suez to support the Anglo-French operations there, and they were effective delayed by the Egyptians. The outcome of the engagement was coded as “attack advances” even though is a defender victory based upon the mission accomplishment scoring. The data in these tables could change slightly depending on how one chooses to code or interpret the outcome of the engagements.
When the Arab armies attacked, the results were very different.
Arab armies attacking the Israeli Army (18 cases)
Force Ratio…………………….Percent Attacker Wins…………………Number of Cases
0.87……………………………………..0%………………………………………………..1
1.05……………………………………..0…………………………………………………..1
1.75 to 1.80…………………………..0…………………………………………………..2
2.22 to 2.25…………………………..0…………………………………………………..2
Gap in data
3.03 to 3.49…………………………..0…………………………………………………..2
3.50 to 3.96…………………………33…………………………………………………..3
4.11 to 5.87…………………………50…………………………………………………..4
6.06………………………………….100…………………………………………………..1
8.12 to 12.18……………………..100…………………………………………………..2
One notes that the Arab armies lose all engagements below 3.94-to-1. This is some ten of the 18 engagements. Overall, they win only one-third of the time (six engagements out of 18). All victories are at roughly four-to-one odds or higher and even then they win 71% of time. This cannot more sharply demonstrate the performance differences between some armies. This was also examined in my previous book, primarily looking at casualty exchange ratios.
Finally, there is a 1991 Gulf War, where the differences in the performance between the two armies were far greater than either the German army versus the Soviet Union in 1943, or the Israeli Army versus the various Arab armies. We have 11 engagements from the odds of 0.64- to 3.26-to-one. The U.S., UK and French win them all. We have four Iraq attacks from odds of 0.21- to 3.00-to-1. All the Iraqi attacks fail. The Gulf War is a very unusual case.