Category War by Numbers

The Combat Value of Surprise

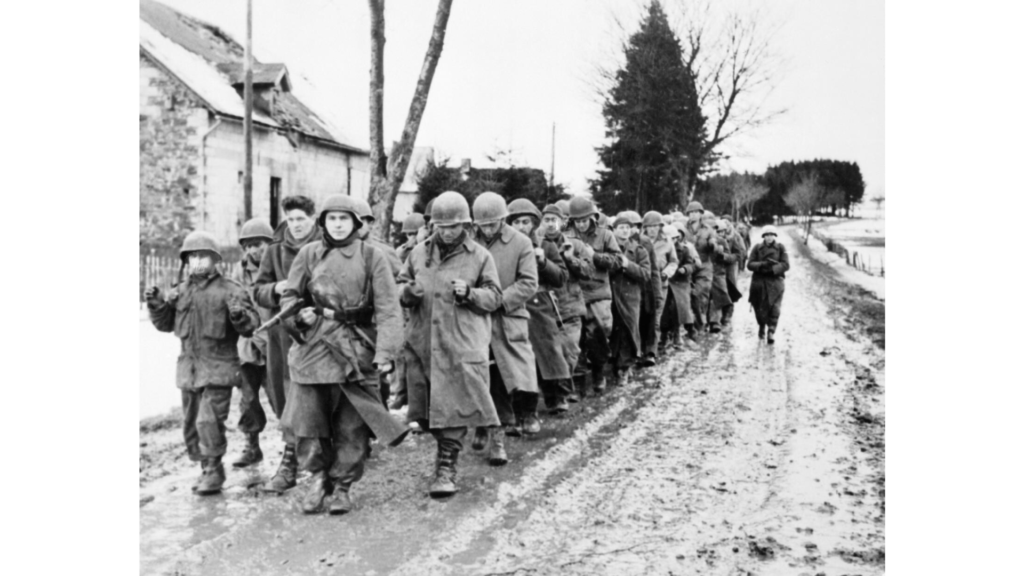
American soldiers being marched down a road after capture by German troops in the Ardennes, December 1944.

[This article was originally posted on 1 December 2016]

In his recent analysis of the role of conventional armored forces in Russian hybrid warfare, U.S. Army Major Amos Fox noted an emphasis on tactical surprise.

Changes to Russian tactics typify the manner in which Russia now employs its ground force. Borrowing from the pages of military theorist Carl von Clausewitz, who stated, “It is still more important to remember that almost the only advantage of the attack rests on its initial surprise,” Russia’s contemporary operations embody the characteristic of surprise. Russian operations in Georgia and Ukraine demonstrate a rapid, decentralized attack seeking to temporally dislocate the enemy, triggering the opposing forces’ defeat.

Tactical surprise enabled by electronic, cyber, information and unconventional warfare capabilities, combined with mobile and powerful combined arms brigade tactical groups, and massive and lethal long-range fires provide Russian Army ground forces with formidable combat power.

Trevor Dupuy considered the combat value of surprise to be important enough to cite it as one of his “timeless verities of combat.”

Surprise substantially enhances combat power. Achieving surprise in combat has always been important. It is perhaps more important today than ever. Quantitative analysis of historical combat shows that surprise has increased the combat power of military forces in those engagements in which it was achieved. Surprise has proven to be the greatest of all combat multipliers. It may be the most important of the Principles of War; it is at least as important as Mass and Maneuver.

In addition to acting as combat power multiplier, Dupuy observed that surprise decreases the casualties of a surprising force and increases those of a surprised one. Surprise also enhances advance rates for forces that achieve it.

In his combat models, Dupuy categorized tactical surprise as complete, substantial, and minor; defining the level achieved was a matter of analyst judgement. The combat effects of surprise in battle would last for three days, declining by one-third each day.

He developed two methods for applying the effects of surprise in calculating combat power, each yielding the same general overall influence. In his original Quantified Judgement Model (QJM) detailed in Numbers, Predictions and War: The Use of History to Evaluate and Predict the Outcome of Armed Conflict (1977), factors for surprise were applied to calculations for vulnerability and mobility, which in turn were applied to the calculation of overall combat power. The net value of surprise on combat power ranged from a factor of about 2.24 for complete surprise to 1.10 for minor surprise.

For a simplified version of his combat power calculation detailed in Attrition: Forecasting Battle Casualties and Equipment Losses in Modern War (1990), Dupuy applied a surprise combat multiplier value directly to the calculation of combat power. These figures also ranged between 2.20 for complete surprise and 1.10 for minor surprise.

Dupuy established these values for surprise based on his judgement of the difference between the calculated outcome of combat engagements in his data and theoretical outcomes based on his models. He never validated them back to his data himself. However, TDI President Chris Lawrence recently did conduct substantial tests on TDI’s expanded combat databases in the context of analyzing the combat value of situational awareness. The results are described in detail in his forthcoming book, War By Numbers: Understanding Conventional Combat.

Urban Combat in War by Numbers

So our work on urban warfare ended in 2005 with the Stalingrad contract being cancelled because of the weather. It was a pretty significant body of work, but the Army’s interest shifted to insurgencies and so did our work. From 2005 through 2009, our major work was on insurgencies, which is summarized in my book America’s Modern Wars.

When things finally got quiet enough for me to consider writing books, I briefly considered doing a book on urban warfare. But, the subject had fallen out of fashion. I therefore decided to try to summarize all our conventional warfare work into a single book, War by Numbers.

Our urban warfare work is described in a half dozen earlier posts. It is covered in much more depth in two chapters of my book War by Numbers. Chapter 16: Urban Legends, cover the three phases of this work (Phase I = ETO, II = Kharkov, III = Manila and post-WWII). The chapter is called “urban legends,” because so much of the work on urban warfare in the time immediately preceding our work overemphasized the intensity, casualties, fatigue and actions that would occur in urban warfare. They had, mistakenly, created a mythology about urban warfare, based upon looking at a few extreme case studies. This discussion on urban warfare flowed into the next chapter, Chapter 17: Use of Case Studies. As I pointed out at the start of that chapter (pages 265-266):

Unfortunately, military history is often the study of exceptions…..What often gets lost is the norm, or what is typical….we at the Dupuy Institute are not averse to using case studies; we simply prefer not to use them as our only analytical tool….We look for the norms and the typical situation and use case studies only as part of a further examination of the study.

The rest of the chapter is based upon the outstanding work that Richard C. Anderson did looking at a number individual division’s operations in a variety of cities (in particular Brest, Aachen, Cherbourg and Manila). More than six different case studies. The most significant one was the work done on urban operations and combat stress, or battle fatigue (it is in our Phase I report, which is on line). This was the work that caused RAND to revise their work and prepare a report that paralleled our research effort.

Chapter 16 is 59 pages long, while Chapter 17 is 20 pages.


P.S. Source of picture (Berlin 1945): https://www.moddb.com/groups/tanks/images/urban-warfare-in-berlin


Measuring the Effects of Combat in Cities, Phase III – part 3

Am 25.10.1941 konnte die faschistische deutsche Wehrmacht mit überlegenen Kräften Charkow, die Hauptstadt der Ukraine erobern.
UBz.: Panzer und Infanterie bei Strassenkämpfen in der Stadt

Description: Street fighting at Kharkov on 25 October 1941: infantry advancing covered by a StuG III assault gun and Sd.Kfz. 250 halftrack(Bundesarchiv Bild 183-L20582)

So, in our three phases of urban warfare study, taking place over three years, how much urban warfare did we examine? Well by count of engagements, we looked at 304 urban cases, division-level and battalion-level. Mostly what this means is one division or battalion-level engagement per day. Still, this is not insignificant.

We did assemble back in 2003 a listing of all the significant urban engagements we had identified since 1904. There are not all that common. We counted 117 of them in conventional combat between 1904 and 2003 (they are listed on pages 3-7 of the Phase III report). Of those 117, we had examined 22 of them (18.8 percent). We considered that 38 or so of them were major urban battles (division-level or larger). Of those, we examined 17 (44.7%). Only three of the remaining 21 major urban battles are known to have good data for both sides. The biggest remaining untapped source of data was the Battle of Stalingrad, which could yield over a hundred division-level engagements. This led us to make four points (page 10-11 of the report):

We suggest that there remain a number of ways in which we can broaden and deepen or knowledge of the effects of urban warfare.

  1. Conduct a detailed study of the Battle of Stalingrad. Stalingrad may also represent one of the most intense examples of urban combat, so may provide some clues to the causes of the urban outliers.
  2. Conduct a detailed study of battalion/brigade-level urban combat. This would begin with an analysis of battalion-level actions from the first two phases of this study (European Theater of Operations and Eastern Front), added to the battalion-level actions completed in this third phase of the study. Additional battalion-level engagements would be added as needed.
  3. Conduct a detailed study of the outliers in an attempt to discover the causes for the atypical nature of these urban battles.
  4. Conduct a detailed study of urban warfare in an unconventional warfare setting.

Anyhow, it was clear that our next step was Stalingrad. You will also note that in 2003/2004 we were also suggesting we study urban warfare in an unconventional warfare setting. This suggestion seemed to get no attention.


Measuring the Effects of Combat in Cities, Phase III – part 2.1

I forgot a cool graphic from these charts I posted in the Phase III – part 2 discussion:

This is on page 61 of the Phase III report. It is also on page 260 of my book War by Numbers.

There is some explanatory text for this chart on pages 60-61 (and pages 259-261 of my book War by Numbers). The text from the report is below:

Over time one may note that the average weighted percent-loss-per-day in urban operations from 1943 to 2003 – a 60-year time span – ranges from 0.50 to 0.71 if Soviet attacks are excluded. In contrast, the average weighted percent-loss-per-day in non-urban terrain ranges from 0.76 to 1.27 if the Soviet attacks and Tet are excluded.

These data can be plotted over time by simply inserting the various percentage-loss-per-day for each of the engagements under the appropriate year. To do so we have eliminated the Eastern Front Soviet attacks (urban and non-urban) and Tet Offensive non-urban outliers and have normalized the intervening years where there are no data points. The result is interesting and clearly establishes that that over the last 60 years urban warfare has remained less intense than non-urban warfare (at least at the division-level and as measured as a percent-loss-per-day).

It is notable that the sole point at which the two lines intersect – during the 1973 Arab-Israeli War may actually shed some light upon why the belief that urban warfare is more costly and/or intense than that in other types of terrain exists. Quite simply, the urban case in the 1973 War – the Battle of Suez City – is one unique engagement fought during that entire war and is just one of 32 engagements from that war that was fought in urban terrain. And it is one of the few cases that we have found where division-level urban combat was as intense as the average non-urban combat during the same campaign. Overall in just seven of the 31 non-urban engagements in the 1973 War was the attacker percent-per-day loss higher than 1.57 percent found at Suez City, and in only two of those were the attackers Israeli. Nor were the Israeli armor losses extraordinary at Suez City, they amounted to only about 11 tanks, for a loss rate of just 4.6 percent-per-day. This may be contrasted to the 11.43 percent-per-day armor loss that the Israelis averaged in the nine non-urban attacks they made against the Egyptians in the 1973 War.[1]

That Suez City stands out as unique should hardly be surprising. What is surprising is that it – and the few other possible outliers we have found – has become identified as the “typical” urban battle rather than as a unique case. In that respect Suez City and the other outliers may provide copious lessons to be learned for future battles in urban terrain, but they should not be accepted as the norm. On that note however, it is somewhat depressing to see that many lessons of urban warfare apparently learned by the different combatants in World War II apparently were forcibly relearned in later wars. That the mistakes made in earlier urban battles are repeated over and over again in later wars – such as avoiding sending unsupported armor into built-up areas – is more than somewhat perplexing. Worse, we have been unable to find any example in World War II of the misemployment of armor in an urban environment that mirrors the foolishness exhibited by the attackers at Suez City or Grozny. Thus it could be supposed that any benefit of technological evolution in warfare over time might be counterbalanced in part by the simple failure to draw adequate lessons from the past.

[1] The highest rate was at Chinese Farm I when the Israelis armor loss was 24.40 percent-per-day.


Measuring the Effects of Combat in Cities, Phase III – part 1

Now comes Phase III of this effort. The Phase I report was dated 11 January 2002 and covered the European Theater of Operations (ETO). The Phase II report [Part I and Part II] was dated 30 June 2003 and covered the Eastern Front (the three battles of Kharkov). Phase III was completed in 31 July 2004 and covered the Battle of Manila in the Pacific Theater, post-WWII engagements, and battalion-level engagements. It was a pretty far ranging effort.

In the case of Manila, this was the first time that we based our analysis using only one-side data (U.S. only). In this case, the Japanese tended to fight to almost the last man. We occupied the field of combat after the battle and picked up their surviving unit records. Among the Japanese, almost all died and only a few were captured by the U.S. So, we had fairly good data from the U.S. intelligence files. Regardless, the U.S. battle reports for Japanese data was the best data available. This allowed us to work with one-sided data. The engagements were based upon the daily operations of the U.S. Army’s 37th Infantry Division and the 1st Cavalry Division.

Conclusions (from pages 44-45):

The overall conclusions derived from the data analysis in Phase I were as follows, while those from this Phase III analysis are in bold italics.

  1. Urban combat did not significantly influence the Mission Accomplishment (Outcome) of the engagements. Phase III Conclusion: This conclusion was further supported.
  2. Urban combat may have influenced the casualty rate. If so, it appears that it resulted in a reduction of the attacker casualty rate and a more favorable casualty exchange ratio compared to non-urban warfare. Whether or not these differences are caused by the data selection or by the terrain differences is difficult to say, but regardless, there appears to be no basis to the claim that urban combat is significantly more intense with regards to casualties than is non-urban warfare. Phase III Conclusion: This conclusion was further supported. If urban combat influenced the casualty rate, it appears that it resulted in a reduction of the attacker casualty rate and a more favorable casualty exchange ratio compared to non-urban warfare. There still appears to be no basis to the claim that urban combat is significantly more intense with regards to casualties than is non-urban warfare.
  3. The average advance rate in urban combat should be one-half to one-third that of non-urban combat. Phase III Conclusion: There was strong evidence of a reduction in the advance rates in urban terrain in the PTO data. However, given that this was a single extreme case, then TDI still stands by its original conclusion that the average advance rate in urban combat should be about one-half to one-third that of non-urban combat/
  4. Overall, there is little evidence that the presence of urban terrain results in a higher linear density of troops, although the data does seem to trend in that direction. Phase III Conclusion: The PTO data shows the highest densities found in the data sets for all three phases of this study. However, it does not appear that the urban density in the PTO was significantly higher than the non-urban density. So it remains difficult to tell whether or not the higher density was a result of the urban terrain or was simply a consequence of the doctrine adopted to meet the requirements found in the Pacific Theater.
  5. Overall, it appears that the loss of armor in urban terrain is the same as or less than that found in non-urban terrain, and in some cases is significantly lower. Phase III Conclusion: This conclusion was further supported.
  6. Urban combat did not significantly influence the Force Ratio required to achieve success or effectively conduct combat operations. Phase III Conclusion: This conclusion was further supported.
  7. Nothing could be determined from an analysis of the data regarding the Duration of Combat (Time) in urban versus non-urban terrain. Phase III Conclusion: Nothing could be determined from an analysis of the data regarding the Duration of Combat (Time) in urban versus non-urban terrain.

So, in Phase I we compared 46 urban and conurban engagements in the ETO to 91 non-urban engagements. In Phase II, we compared 51 urban and conurban engagements in an around Kharkov to 49 non-urban Kursk engagements. On Phase III, from Manila we compared 53 urban and conurban engagements to 41 non-urban engagements mostly from Iwo Jima, Okinawa and Manila. The next blog post on urban warfare will discuss our post-WWII data.

P.S. The picture is an aerial view of the destroyed walled city of Intramuros taken on May 1945

Measuring the Effects of Combat in Cities, Phase II – part 1

Our first urban warfare report that we did had a big impact. It clearly showed that the intensity of urban warfare was not what some of the “experts” out there were claiming. In particular, it called into question some of the claims being made by RAND. But, the report was based upon Aachen, Cherbourg, and a collection of mop-up operations along the Channel Coast. Although this was a good starting point because of the ease of research and availability of data, we did not feel that this was a fully representative collection of cases. We also did not feel that it was based upon enough cases, although we had already assembled more cases than most “experts” were using. We therefore convinced CAA (Center for Army Analysis) to fund a similar effort for the Eastern Front in World War II.

For this second phase, we again assembled a collection of Eastern Front urban warfare engagements in our DLEDB (Division-level Engagement Data Base) and compared it to Eastern Front non-urban engagements. We had, of course, a considerable collection of non-urban engagements already assembled from the Battle of Kursk in July 1943. We therefore needed a good urban engagement nearby. Kharkov is the nearest major city to where these non-urban engagements occurred and it was fought over three times in 1943. It was taken by the Red Army in February, it was retaken by the German Army in March, and it was taken again by the Red Army in August. Many of the units involved were the same units involved in the Battle of Kursk. This was a good close match. It has the additional advantage that both sides were at times on the offense.

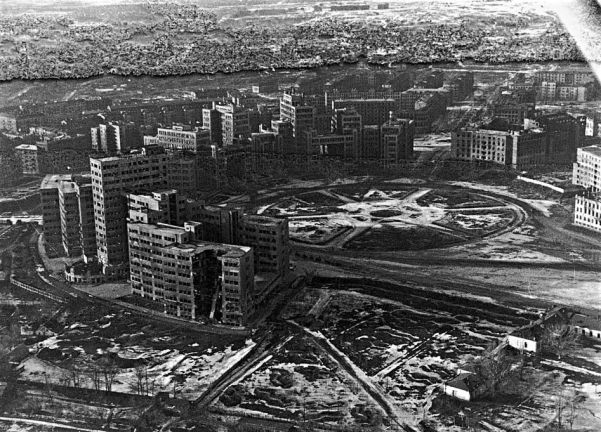
Furthermore, Kharkov was a big city. At the time it was the fourth biggest city in the Soviet Union, being bigger than Stalingrad (as measured by pre-war population). A picture of its Red Square in March 1943, after the Germans retook it, is above.

We did have good German records for 1943 and we were able to get access to Soviet division-level records from February, March and August from the Soviet military archives in Podolsk. Therefore, we were able to assembled all the engagements based upon the unit records of both sides. No secondary sources were used, and those that were available were incomplete, usually one-sided, sometimes biased and often riddled with factual errors.

So, we ended up with 51 urban and conurban engagements from the fighting around Kharkov, along with 65 non-urban engagements from Kursk (we have more now).

The Phase II effort was completed on 30 June 2003. The conclusions of Phase II (pages 40-41) were similar to Phase I:

.Phase II Conclusions:

  1. Mission Accomplishment: This [Phase I] conclusion was further supported. The data does show a tendency for urban engagements not to generate penetrations.
  2. Casualty Rates: This [Phase I] conclusion was further supported. If urban combat influenced the casualty rate, it appears that it resulted in a reduction of the attacker casualty rate and a more favorable casualty exchange ratio compared to nonurban warfare. There still appears to be no basis to the claim that urban combat is significantly more intense with regards to casualties than is nonurban warfare.
  3. Advance Rates: There is no strong evidence of a reduction in the advance rates in urban terrain in the Eastern Front data. TDI still stands by its original conclusion that the average advance rate in urban combat should be one-half to one-third that of nonurban combat.
  4. Linear Density: Again, there is little evidence that the presence of urban terrain results in a higher linear density of troops, but unlike the ETO data, the data did not show a tendency to trend in that direction.
  5. Armor Losses: This conclusion was further supported (Phase I conclusion was: Overall, it appears that the loss of armor in urban terrain is the same as or less than that found in nonurban terrain, and in some cases is significantly lower.)
  6. Force Ratios: The conclusion was further supported (Phase I conclusion was: Urban combat did not significantly influence the Force Ratio required to achieve success or effectively conduct combat operations).
  7. Duration of Combat: Nothing could be determined from an analysis of the data regarding the Duration of Combat (Time) in urban versus nonurban terrain.

There is a part 2 to this effort that I will pick up in a later post.

The (Missing) Urban Warfare Study

[This post was originally published on 13 December 2017]

And then…..we discovered the existence of a significant missing study that we wanted to see.

Around 2000, the Center for Army Analysis (CAA) contracted The Dupuy Institute to conduct an analysis of how to represent urban warfare in combat models. This was the first work we had ever done on urban warfare, so…….we first started our literature search. While there was a lot of impressionistic stuff gathered from reading about Stalingrad and watching field exercises, there was little hard data or analysis. Simply no one had ever done any analysis of the nature of urban warfare.

But, on the board of directors of The Dupuy Institute was a grand old gentleman called John Kettelle. He had previously been the president of Ketron, an operations research company that he had founded. Kettelle had been around the business for a while, having been an office mate of Kimball, of Morse and Kimbell fame (the people who wrote the original U.S. Operations Research “textbook” in 1951: Methods of Operations Research). He is here: https://www.adventfuneral.com/services/john-dunster-kettelle-jr.htm?wpmp_switcher=mobile

John had mentioned several times a massive study on urban warfare that he had done  for the U.S. Army in the 1970s. He had mentioned details of it, including that it was worked on by his staff over the course of several years, consisted of several volumes, looked into operations in Stalingrad, was pretty extensive and exhaustive, and had a civil disturbance component to it that he claimed was there at the request of the Nixon White House. John Kettelle sold off his company Ketron in the 1990s and was now semi-retired.

So, I asked John Kettelle where his study was. He said he did not know. He called over to the surviving elements of Ketron and they did not have a copy. Apparently significant parts of the study were classified. In our review of the urban warfare literature around 2000 we found no mention of the study or indications that anyone had seen or drawn any references from it.

This was probably the first extensive study ever done on urban warfare. It employed at least a half-dozen people for multiple years. Clearly the U.S. Army spent several million of our hard earned tax dollars on it…..yet is was not being used and could not be found. It was not listed in DTIC, NTIS, on the web, nor was it in Ketron’s files, and John Kettelle did not have a copy of it. It was lost !!!

So, we proceeded with our urban warfare studies independent of past research and ended up doing three reports on the subject. Theses studies are discussed in two chapters of my book War by Numbers.

All three studies are listed in our report list: http://www.dupuyinstitute.org/tdipub3.htm

The first one is available on line at:  http://www.dupuyinstitute.org/pdf/urbanwar.pdf

As the Ketron urban warfare study was classified, there were probably copies of it in classified U.S. Army command files in the 1970s. If these files have been properly retired then these classified files may exist in the archives. At some point, they may be declassified. At some point the study may be re-discovered. But……the U.S. Army after spending millions for this study, preceded to obtain no benefit from the study in the late 1990s, when a lot of people re-opened the issue of urban warfare. This would have certainly been a useful study, especially as much of what the Army, RAND and others were discussing at the time was not based upon hard data and was often dead wrong.

This may be a case of the U.S. Army having to re-invent the wheel because it has not done a good job of protecting and disseminating its studies and analysis. This seems to particularly be a problem with studies that were done by contractors that have gone out of business. Keep in mind, we were doing our urban warfare work for the Center for Army Analysis. As a minimum, they should have had a copy of it.

Measuring The Effects Of Combat In Cities, Phase I

“Catalina Kid,” a M4 medium tank of Company C, 745th Tank Battalion, U.S. Army, drives through the entrance of the Aachen-Rothe Erde railroad station during the fighting around the city viaduct on Oct. 20, 1944. [Courtesy of First Division Museum/Daily Herald]

In 2002, TDI submitted a report to the U.S. Army Center for Army Analysis (CAA) on the first phase of a study examining the effects of combat in cities, or what was then called “military operations on urbanized terrain,” or MOUT. This first phase of a series of studies on urban warfare focused on the impact of urban terrain on division-level engagements and army-level operations, based on data drawn from TDI’s DuWar database suite.

This included engagements in France during 1944 including the Channel and Brittany port cities of Brest, Boulogne, Le Havre, Calais, and Cherbourg, as well as Paris, and the extended series of battles in and around Aachen in 1944. These were then compared to data on fighting in contrasting non-urban terrain in Western Europe in 1944-45.

The conclusions of Phase I of that study (pp. 85-86) were as follows:

The Effect of Urban Terrain on Outcome

The data appears to support a null hypothesis, that is, that the urban terrain had no significantly measurable influence on the outcome of battle.

The Effect of Urban Terrain on Casualties

Overall, any way the data is sectioned, the attacker casualties in the urban engagements are less than in the non-urban engagements and the casualty exchange ratio favors the attacker as well. Because of the selection of the data, there is some question whether these observations can be extended beyond this data, but it does not provide much support to the notion that urban combat is a more intense environment than non-urban combat.

The Effect of Urban Terrain on Advance Rates

It would appear that one of the primary effects of urban terrain is that it slows opposed advance rates. One can conclude that the average advance rate in urban combat should be one-half to one-third that of non-urban combat.

The Effect of Urban Terrain on Force Density

Overall, there is little evidence that combat operations in urban terrain result in a higher linear density of troops, although the data does seem to trend in that direction.

The Effect of Urban Terrain on Armor

Overall, it appears that armor losses in urban terrain are the same as, or lower than armor losses in non-urban terrain. And in some cases it appears that armor losses are significantly lower in urban than non-urban terrain.

The Effect of Urban Terrain on Force Ratios

Urban terrain did not significantly influence the force ratio required to achieve success or effectively conduct combat operations.

The Effect of Urban Terrain on Stress in Combat

Overall, it appears that urban terrain was no more stressful a combat environment during actual combat operations than was non-urban terrain.

The Effect of Urban Terrain on Logistics

Overall, the evidence appears to be that the expenditure of artillery ammunition in urban operations was not greater than that in non-urban operations. In the two cases where exact comparisons could be made, the average expenditure rates were about one-third to one-quarter the average expenditure rates expected for an attack posture in the European Theater of Operations as a whole.

The evidence regarding the expenditure of other types of ammunition is less conclusive, but again does not appear to be significantly greater than the expenditures in non-urban terrain. Expenditures of specialized ordnance may have been higher, but the total weight expended was a minor fraction of that for all of the ammunition expended.

There is no evidence that the expenditure of other consumable items (rations, water or POL) was significantly different in urban as opposed to non-urban combat.

The Effect of Urban Combat on Time Requirements

It was impossible to draw significant conclusions from the data set as a whole. However, in the five significant urban operations that were carefully studied, the maximum length of time required to secure the urban area was twelve days in the case of Aachen, followed by six days in the case of Brest. But the other operations all required little more than a day to complete (Cherbourg, Boulogne and Calais).

However, since it was found that advance rates in urban combat were significantly reduced, then it is obvious that these two effects (advance rates and time) are interrelated. It does appear that the primary impact of urban combat is to slow the tempo of operations.

This in turn leads to a hypothetical construct, where the reduced tempo of urban operations (reduced casualties, reduced opposed advance rates and increased time) compared to non-urban operations, results in two possible scenarios.

The first is if the urban area is bounded by non-urban terrain. In this case the urban area will tend to be enveloped during combat, since the pace of battle in the non-urban terrain is quicker. Thus, the urban battle becomes more a mopping-up operation, as it historically has usually been, rather than a full-fledged battle.

The alternate scenario is that created by an urban area that cannot be enveloped and must therefore be directly attacked. This may be caused by geography, as in a city on an island or peninsula, by operational requirements, as in the case of Cherbourg, Brest and the Channel Ports, or by political requirements, as in the case of Stalingrad, Suez City and Grozny.

Of course these last three cases are also those usually included as examples of combat in urban terrain that resulted in high casualty rates. However, all three of them had significant political requirements that influenced the nature, tempo and even the simple necessity of conducting the operation. And, in the case of Stalingrad and Suez City, significant geographical limitations effected the operations as well. These may well be better used to quantify the impact of political agendas on casualties, rather than to quantify the effects of urban terrain on casualties.

The effects of urban terrain at the operational level, and the effect of urban terrain on the tempo of operations, will be further addressed in Phase II of this study.

My Response To My 1997 Article

Shawn likes to post up on the blog old articles from The International TNDM Newsletter. The previous blog post was one such article I wrote in 1997 (he posted it under my name…although he put together the post). This is the first time I have read it since say….1997. A few comments:

  1. In fact, we did go back in systematically review and correct all the Italian engagements. This was primarily done by Richard Anderson from German records and UK records. All the UK engagements were revised as were many of the other Italian Campaign records. In fact, we ended up revising at least half of the WWII engagements in the Land Warfare Data Base (LWDB).
  2. We did greatly expand our collection of data, to over 1,200 engagements, including 752 in a division-level engagement database. Basically we doubled the size of the database (and placed it in Access).
  3. Using this more powerful data collection, I then re-shot the analysis of combat effectiveness. I did not use any modeling structure, but simply just used basic statistics. This effort again showed a performance difference in combat in Italy between the Germans, the Americans and the British. This is discussed in War by Numbers, pages 19-31.
  4. We did actually re-validate the TNDM. The results of this validation are published in War by Numbers, pages 299-324. They were separately validated at corps-level (WWII), division-level (WWII) and at Battalion-level (WWI, WWII and post-WWII).
  5. War by Numbers also includes a detailed discussion of differences in casualty reporting between nations (pages 202-205) and between services (pages 193-202).
  6. We have never done an analysis of the value of terrain using our larger more robust databases, although this is on my short-list of things to do. This is expected to be part of War by Numbers II, if I get around to writing it.
  7. We have done no significant re-design of the TNDM.

Anyhow, that is some of what we have been doing in the intervening 20 years since I wrote that article.

General McInerney

Lt. General Thomas McInerney has been in the news lately, mostly for saying things that are getting him kicked off of news shows:

https://en.wikipedia.org/wiki/Thomas_McInerney

It is my understanding that he was the person who was responsible for making sure that DACM (Dupuy Air Combat Model) was funded by AFSC. He then retired from the Air Force in 1994. We completed the demonstration phase of the DACM and quite simply, there was no one left in the Air Force who was interested in funding it. So, work stopped. I never met General McInerney and was not involved in the marketing of the initial effort.

The Dupuy Institute Air Model Historical Data Study

The Dupuy Air Campaign Model (DACM)

But, this is typical of the problems with doing business with the Pentagon, where an officer will take an interest in your work, generate funding for it, but by the time the first steps are completed, that officer has moved on to another assignment. This has happened to us with other projects. One of these efforts was a joint research project that was done by TDI and former Army surgeon on casualty rates. It was for J-4 of the Joint Staff. The project officer there was extremely interested and involved in the work, but then moved to another assignment. By the time we got original effort completed, the division was headed by an Air Force Colonel who appeared to be only interested in things that flew. Therefore, the project died (except that parts of it were used for Chapter 15: Casualties, pages 193-198, in War by Numbers).

Our experience in dealing with the U.S. defense establishment is that sometimes research efforts that takes longer than a few months will die……because the people interested in it have moved on. This sometimes leads to simple, short-term analysis and fewer properly funded long-term projects.