Category Urban Warfare

Other TDI Data Bases

What we have listed in the previous articles is what we consider the six best databases to use for validation. The Ardennes Campaign Simulation Data Base (ACSDB) was used for a validation effort by CAA (Center for Army Analysis). The Kursk Data Base (KDB) was never used for a validation effort but was used, along with Ardennes, to test Lanchester equations (they failed).

The Use of the Two Campaign Data Bases

The Battle of Britain Data Base to date has not been used for anything that we are aware of. As the program we were supporting was classified, then they may have done some work with it that we are not aware of, but I do not think that is the case.

The Battle of Britain Data Base

Our three battles databases, the division-level data base, the battalion-level data base and the company-level data base, have all be used for validating our own TNDM (Tactical Numerical Deterministic Model). These efforts have been written up in our newsletters (here: http://www.dupuyinstitute.org/tdipub4.htm) and briefly discussed in Chapter 19 of War by Numbers. These are very good databases to use for validation of a combat model or testing a casualty estimation methodology. We have also used them for a number of other studies (Capture Rate, Urban Warfare, Lighter-Weight Armor, Situational Awareness, Casualty Estimation Methodologies, etc.). They are extremely useful tools analyzing the nature of conflict and how it impacts certain aspects. They are, of course, unique to The Dupuy Institute and for obvious business reasons, we do keep them close hold.

The Division Level Engagement Data Base (DLEDB)

Battalion and Company Level Data Bases

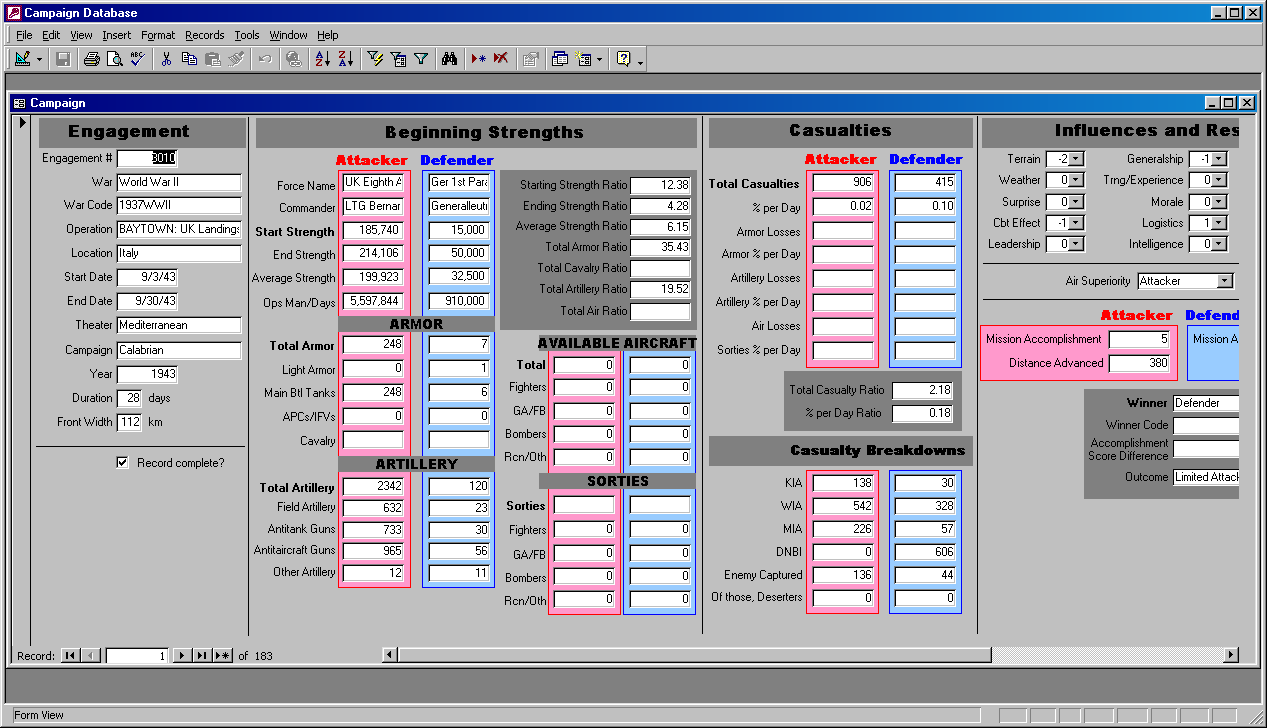
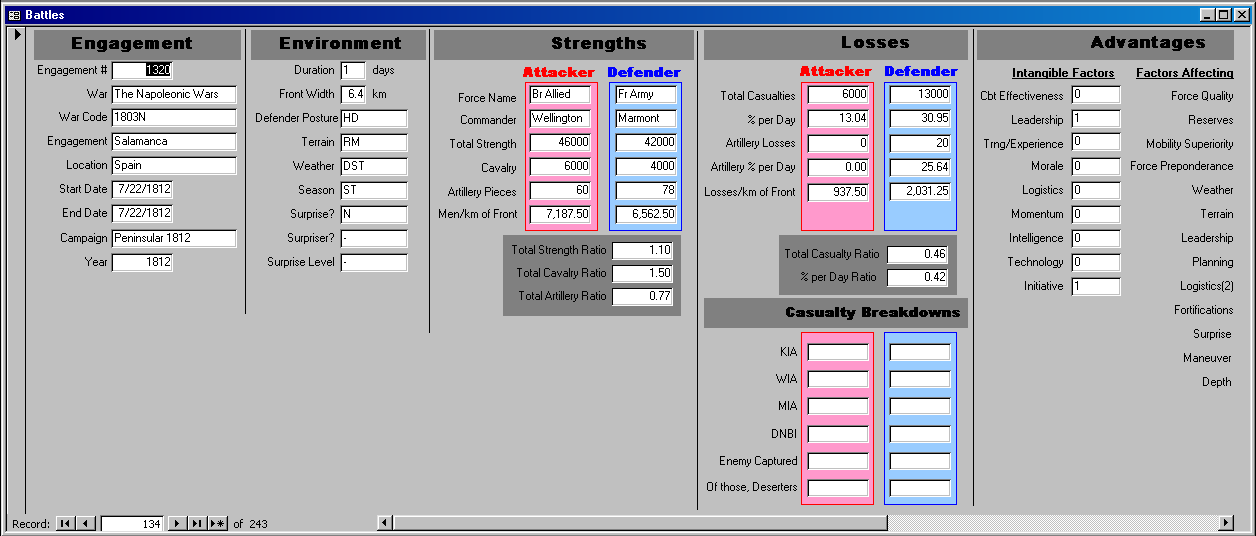
We do have a number of other database that have not been used as much. There is a list of 793 conflicts from 1898-1998 that we have yet to use for anything (the WACCO – Warfare, Armed Conflict and Contingency Operations database). There is the Campaign Data Base (CaDB) of 196 cases from 1904 to 1991, which was used for the Lighter Weight Armor study. There are three databases that are mostly made of cases from the original Land Warfare Data Base (LWDB) that did not fit into our division-level, battalion-level, and company-level data bases. They are the Large Action Data Base (LADB) of 55 cases from 1912-1973, the Small Action Data Base (SADB) of 5 cases and the Battles Data Base (BaDB) of 243 cases from 1600-1900. We have not used these three database for any studies, although the BaDB is used for analysis in War by Numbers.

Finally, there are three databases on insurgencies, interventions and peacekeeping operations that we have developed. This first was the Modern Contingency Operations Data Base (MCODB) that we developed to use for Bosnia estimate that we did for the Joint Staff in 1995. This is discussed in Appendix II of America’s Modern Wars. It then morphed into the Small Scale Contingency Operations (SSCO) database which we used for the Lighter Weight Army study. We then did the Iraq Casualty Estimate in 2004 and significant part of the SSCO database was then used to create the Modern Insurgency Spread Sheets (MISS). This is all discussed in some depth in my book America’s Modern Wars.

None of these, except the Campaign Data Base and the Battles Data Base (1600-1900), are good for use in a model validation effort. The use of the Campaign Data Base should be supplementary to validation by another database, much like we used it in the Lighter Weight Armor study.

Now, there have been three other major historical validation efforts done that we were not involved in. I will discuss their supporting data on my next post on this subject.

TDI Friday Read: Measuring The Effects of Combat in Cities

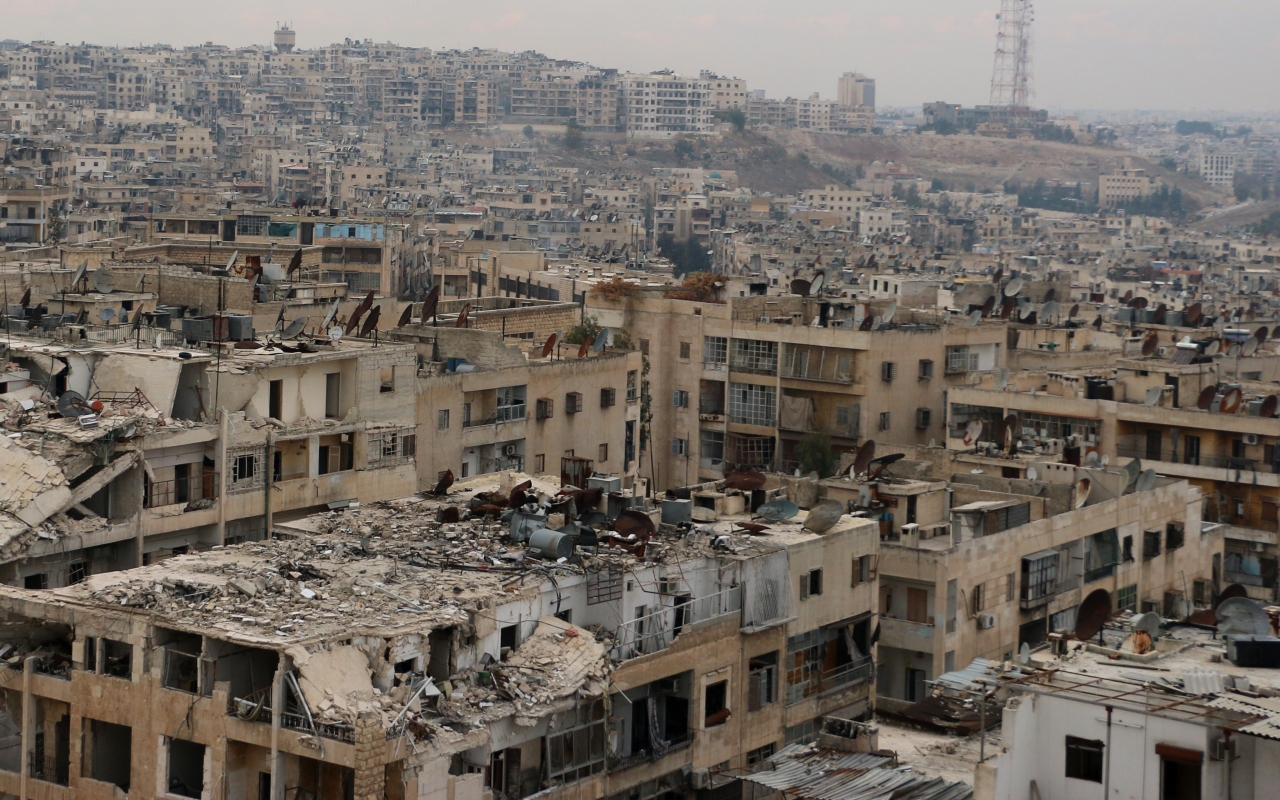
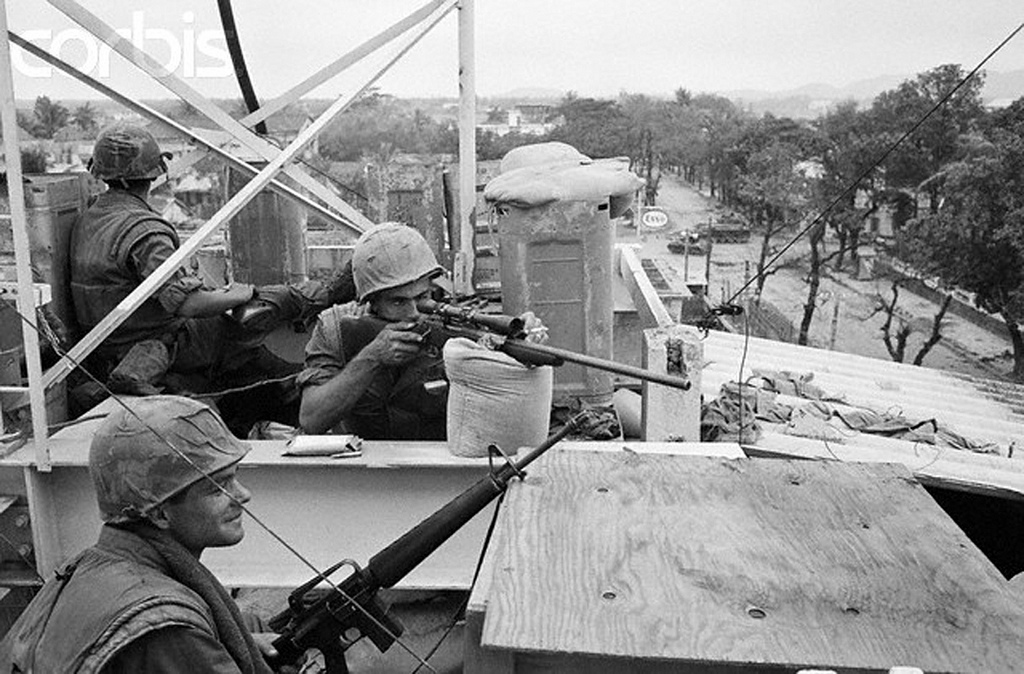
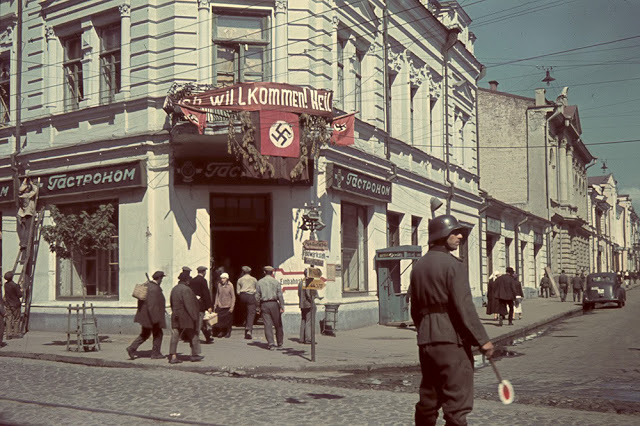
Between 2001 and 2004, TDI undertook a series of studies on the effects of urban combat in cities for the U.S. Army Center for Army Analysis (CAA). These studies examined a total of 304 cases of urban combat at the divisional and battalion level that occurred between 1942 and 2003, as well as 319 cases of concurrent non-urban combat for comparison.

The primary findings of Phases I-III of the study were:

  • Urban terrain had no significantly measurable influence on the outcome of battle.
  • Attacker casualties in the urban engagements were less than in the non-urban engagements and the casualty exchange ratio favored the attacker as well.
  • One of the primary effects of urban terrain is that it slowed opposed advance rates. The average advance rate in urban combat was one-half to one-third that of non-urban combat.
  • There is little evidence that combat operations in urban terrain resulted in a higher linear density of troops.
  • Armor losses in urban terrain were the same as, or lower than armor losses in non-urban terrain. In some cases it appears that armor losses were significantly lower in urban than non-urban terrain.
  • Urban terrain did not significantly influence the force ratio required to achieve success or effectively conduct combat operations.
  • Overall, it appears that urban terrain was no more stressful a combat environment during actual combat operations than was non-urban terrain.
  • Overall, the expenditure of ammunition in urban operations was not greater than that in non-urban operations. There is no evidence that the expenditure of other consumable items (rations; water; or fuel, oil, or lubricants) was significantly different in urban as opposed to non-urban combat.
  • Since it was found that advance rates in urban combat were significantly reduced, then it is obvious that these two effects (advance rates and time) were interrelated. It does appear that the primary impact of urban combat was to slow the tempo of operations.

In order to broaden and deepen understanding of the effects of urban combat, TDI proposed several follow-up studies. To date, none of these have been funded:

  1. Conduct a detailed study of the Battle of Stalingrad. Stalingrad may also represent one of the most intense examples of urban combat, so may provide some clues to the causes of the urban outliers.
  2. Conduct a detailed study of battalion/brigade-level urban combat. This would begin with an analysis of battalion-level actions from the first two phases of this study (European Theater of Operations and Eastern Front), added to the battalion-level actions completed in this third phase of the study. Additional battalion-level engagements would be added as needed.
  3. Conduct a detailed study of the outliers in an attempt to discover the causes for the atypical nature of these urban battles.
  4. Conduct a detailed study of urban warfare in an unconventional warfare setting.

Details of the Phase I-III study reports and conclusions can be found below:

Measuring The Effects Of Combat In Cities, Phase I

Measuring the Effects of Combat in Cities, Phase II – part 1

Measuring the Effects of Combat in Cities, Phase II – part 2

Measuring the Effects of Combat in Cities, Phase III – part 1

Measuring the Effects of Combat in Cities, Phase III – part 2

Measuring the Effects of Combat in Cities, Phase III – part 2.1

Measuring the Effects of Combat in Cities, Phase III – part 3

Urban Phase IV – Stalingrad

Urban Combat in War by Numbers

Back To The Future: The Return Of Sieges To Modern Warfare

Ruins of the northern Syrian city of Aleppo, which was besieged by Syrian government forces from July 2012 to December 2016. [Getty Images]

U.S. Army Major Amos Fox has published a very intriguing analysis in the Association of the U.S. Army’s Institute of Land Warfare Landpower Essay series, titled “The Reemergence of the Siege: An Assessment of Trends in Modern Land Warfare.” Building upon some of his previous work (here and here), Fox makes a case that sieges have again become a salient feature in modern warfare: “a brief survey of history illustrates that the siege is a defining feature of the late 20th and early 21st centuries; perhaps today is the siege’s golden era.”

Noting that neither U.S. Army nor joint doctrine currently addresses sieges, Fox adopts the dictionary definition: “A military blockade of a city or fortified place to compel it to surrender, or a persistent or serious attack.” He also draws a distinction between a siege and siege warfare; “siege warfare implies a way of battle, whereas a siege implies one tool of many in the kitbag of warfare.” [original emphasis]

He characterizes modern sieges thusly:

The contemporary siege is a blending of the traditional definition with concentric attacks. The modern siege is not necessarily characterized by a blockade, but more by an isolation of an adversary through encirclement while maintaining sufficient firepower against the besieged to ensure steady pressure. The modern siege can be terrain-focused, enemy-focused or a blending of the two, depending on the action of the besieged and the goal of the attacker. The goal of the siege is either to achieve a decision, whether politically or militarily, or to slowly destroy the besieged.

He cites the siege of Sarajevo (1992-1996) as the first example of the modern phenomenon. Other cases include Grozny (1999-2000); Aleppo, Ghouta, Kobani, Raqaa, and Deir Ezzor in Syria (2012 to 2018); Mosul (2016-2017); and Ilovaisk, Second Donetsk Airport, and Debal’tseve in the Ukraine (2014-present).

Fox notes that employing sieges carries significant risk. Most occur in urban areas. The restrictive nature of this terrain serves as a combat multiplier for inferior forces, allowing them to defend effectively against a much larger adversary. This can raise the potential military costs of conducting a siege beyond what an attacker is willing or able to afford.

Modern sieges also risk incurring significant political costs through collateral civilian deaths or infrastructure damage that could lead to a loss of international credibility or domestic support for governments that attempt them.

However, Fox identifies a powerful incentive that can override these disadvantages: when skillfully executed, a siege affords an opportunity for an attacker to contain and tie down defending forces, which can then be methodically destroyed. Despite the risks, he believes the apparent battlefield decisiveness of recent sieges means they will remain part of modern warfare.

Given modern sieges’ destructiveness and sharp impact on the populations on which they are waged, almost all actors (to include the United States) demonstrate a clear willingness—politically and militarily—to flatten cities and inflict massive suffering on besieged populations in order to capitalize on the opportunities associated with having their adversaries centralized.

Fox argues that sieges will be a primary tactic employed by proxy military forces, which are currently being used effectively by a variety of state actors in the Eastern Europe and the Middle East. “[A]s long as intermediaries are doing the majority of fighting and dying within a siege—or holding the line for the siege—it is a tactic that will continue to populate current and future battlefields.”

This is an excellent analysis. Go check it out.

Urban Combat in War by Numbers

So our work on urban warfare ended in 2005 with the Stalingrad contract being cancelled because of the weather. It was a pretty significant body of work, but the Army’s interest shifted to insurgencies and so did our work. From 2005 through 2009, our major work was on insurgencies, which is summarized in my book America’s Modern Wars.

When things finally got quiet enough for me to consider writing books, I briefly considered doing a book on urban warfare. But, the subject had fallen out of fashion. I therefore decided to try to summarize all our conventional warfare work into a single book, War by Numbers.

Our urban warfare work is described in a half dozen earlier posts. It is covered in much more depth in two chapters of my book War by Numbers. Chapter 16: Urban Legends, cover the three phases of this work (Phase I = ETO, II = Kharkov, III = Manila and post-WWII). The chapter is called “urban legends,” because so much of the work on urban warfare in the time immediately preceding our work overemphasized the intensity, casualties, fatigue and actions that would occur in urban warfare. They had, mistakenly, created a mythology about urban warfare, based upon looking at a few extreme case studies. This discussion on urban warfare flowed into the next chapter, Chapter 17: Use of Case Studies. As I pointed out at the start of that chapter (pages 265-266):

Unfortunately, military history is often the study of exceptions…..What often gets lost is the norm, or what is typical….we at the Dupuy Institute are not averse to using case studies; we simply prefer not to use them as our only analytical tool….We look for the norms and the typical situation and use case studies only as part of a further examination of the study.

The rest of the chapter is based upon the outstanding work that Richard C. Anderson did looking at a number individual division’s operations in a variety of cities (in particular Brest, Aachen, Cherbourg and Manila). More than six different case studies. The most significant one was the work done on urban operations and combat stress, or battle fatigue (it is in our Phase I report, which is on line). This was the work that caused RAND to revise their work and prepare a report that paralleled our research effort.

Chapter 16 is 59 pages long, while Chapter 17 is 20 pages.


P.S. Source of picture (Berlin 1945): https://www.moddb.com/groups/tanks/images/urban-warfare-in-berlin


Urban Phase IV – Stalingrad

So in 2005 the Center for Army Analysis (CAA) decided to award us a contract to do Stalingrad based upon our recommendations at the end of the Phase III effort (see the previous post) and our proposal of dated 31 August 2004. We noted in our proposal that we had looked at 304 urban engagements and compared them to 319 non-urban engagements.

This is certainly the most comprehensive collection of urban combat data collected. Still, it is not definitive. In almost all cases, the defender is in a losing battle and is being enveloped. While this is the norm for urban warfare, one is left to wonder if the results for the first three phases of the analysis changes if the urban terrain is part of the front line and part of a set piece attack.

So we ended up proposing to create around 60 division-level urban engagements from the Battle of Stalingrad and compare them to 120 or more non-urban engagements from Kursk.

As we noted in our proposal “Assuming a contract award of 31 March 2005, The Dupuy Institute intends to complete the effort by the end of December 2005.”

Well, the contract was not awarded quite as quick as we liked. But it was in the government contracting office in August 2005, and fully funded. We had our Russian research team ready to go. They had access to the Soviet unit records. We had a staff of researchers in place (including me and Shawn). We had our German and Russian translators lined up. We were ready to start work in October 2005.

Then Hurricane Katrina hit New Orleans. It was 29 August 2005. In early September the tragedy was so significant and the U.S. rescue and recovery efforts were so overwhelmed, that the U.S. military was called in to help. No additional funding was provided for this, so the military had to pay for it from existing funds. The DOD then decided to fund the rescue effort by grabbing all non-essential funds from any contract not awarded, and this included ours. So come October 1st, instead of us starting work on a new contract, we discovered, on rather short notice, that it was no longer funded. Instead I had to hand out pink slips.


P.S. We later assembled most of the Russian unit records we needed for this project, but were never able to convince CAA to fund this fourth phase of our urban study effort.

Measuring the Effects of Combat in Cities, Phase III – part 3

Am 25.10.1941 konnte die faschistische deutsche Wehrmacht mit überlegenen Kräften Charkow, die Hauptstadt der Ukraine erobern.
UBz.: Panzer und Infanterie bei Strassenkämpfen in der Stadt

Description: Street fighting at Kharkov on 25 October 1941: infantry advancing covered by a StuG III assault gun and Sd.Kfz. 250 halftrack(Bundesarchiv Bild 183-L20582)

So, in our three phases of urban warfare study, taking place over three years, how much urban warfare did we examine? Well by count of engagements, we looked at 304 urban cases, division-level and battalion-level. Mostly what this means is one division or battalion-level engagement per day. Still, this is not insignificant.

We did assemble back in 2003 a listing of all the significant urban engagements we had identified since 1904. There are not all that common. We counted 117 of them in conventional combat between 1904 and 2003 (they are listed on pages 3-7 of the Phase III report). Of those 117, we had examined 22 of them (18.8 percent). We considered that 38 or so of them were major urban battles (division-level or larger). Of those, we examined 17 (44.7%). Only three of the remaining 21 major urban battles are known to have good data for both sides. The biggest remaining untapped source of data was the Battle of Stalingrad, which could yield over a hundred division-level engagements. This led us to make four points (page 10-11 of the report):

We suggest that there remain a number of ways in which we can broaden and deepen or knowledge of the effects of urban warfare.

  1. Conduct a detailed study of the Battle of Stalingrad. Stalingrad may also represent one of the most intense examples of urban combat, so may provide some clues to the causes of the urban outliers.
  2. Conduct a detailed study of battalion/brigade-level urban combat. This would begin with an analysis of battalion-level actions from the first two phases of this study (European Theater of Operations and Eastern Front), added to the battalion-level actions completed in this third phase of the study. Additional battalion-level engagements would be added as needed.
  3. Conduct a detailed study of the outliers in an attempt to discover the causes for the atypical nature of these urban battles.
  4. Conduct a detailed study of urban warfare in an unconventional warfare setting.

Anyhow, it was clear that our next step was Stalingrad. You will also note that in 2003/2004 we were also suggesting we study urban warfare in an unconventional warfare setting. This suggestion seemed to get no attention.


Measuring the Effects of Combat in Cities, Phase III – part 2.1

I forgot a cool graphic from these charts I posted in the Phase III – part 2 discussion:

This is on page 61 of the Phase III report. It is also on page 260 of my book War by Numbers.

There is some explanatory text for this chart on pages 60-61 (and pages 259-261 of my book War by Numbers). The text from the report is below:

Over time one may note that the average weighted percent-loss-per-day in urban operations from 1943 to 2003 – a 60-year time span – ranges from 0.50 to 0.71 if Soviet attacks are excluded. In contrast, the average weighted percent-loss-per-day in non-urban terrain ranges from 0.76 to 1.27 if the Soviet attacks and Tet are excluded.

These data can be plotted over time by simply inserting the various percentage-loss-per-day for each of the engagements under the appropriate year. To do so we have eliminated the Eastern Front Soviet attacks (urban and non-urban) and Tet Offensive non-urban outliers and have normalized the intervening years where there are no data points. The result is interesting and clearly establishes that that over the last 60 years urban warfare has remained less intense than non-urban warfare (at least at the division-level and as measured as a percent-loss-per-day).

It is notable that the sole point at which the two lines intersect – during the 1973 Arab-Israeli War may actually shed some light upon why the belief that urban warfare is more costly and/or intense than that in other types of terrain exists. Quite simply, the urban case in the 1973 War – the Battle of Suez City – is one unique engagement fought during that entire war and is just one of 32 engagements from that war that was fought in urban terrain. And it is one of the few cases that we have found where division-level urban combat was as intense as the average non-urban combat during the same campaign. Overall in just seven of the 31 non-urban engagements in the 1973 War was the attacker percent-per-day loss higher than 1.57 percent found at Suez City, and in only two of those were the attackers Israeli. Nor were the Israeli armor losses extraordinary at Suez City, they amounted to only about 11 tanks, for a loss rate of just 4.6 percent-per-day. This may be contrasted to the 11.43 percent-per-day armor loss that the Israelis averaged in the nine non-urban attacks they made against the Egyptians in the 1973 War.[1]

That Suez City stands out as unique should hardly be surprising. What is surprising is that it – and the few other possible outliers we have found – has become identified as the “typical” urban battle rather than as a unique case. In that respect Suez City and the other outliers may provide copious lessons to be learned for future battles in urban terrain, but they should not be accepted as the norm. On that note however, it is somewhat depressing to see that many lessons of urban warfare apparently learned by the different combatants in World War II apparently were forcibly relearned in later wars. That the mistakes made in earlier urban battles are repeated over and over again in later wars – such as avoiding sending unsupported armor into built-up areas – is more than somewhat perplexing. Worse, we have been unable to find any example in World War II of the misemployment of armor in an urban environment that mirrors the foolishness exhibited by the attackers at Suez City or Grozny. Thus it could be supposed that any benefit of technological evolution in warfare over time might be counterbalanced in part by the simple failure to draw adequate lessons from the past.

[1] The highest rate was at Chinese Farm I when the Israelis armor loss was 24.40 percent-per-day.


Measuring the Effects of Combat in Cities, Phase III – part 2

U.S. Army troops in Hue, South Vietnam monitor the streets below during the Tet Offensive, 1968. [Bettmann/CORBIS]

Another part of our Phase III effort was to look at post-World War II cases. This is, by its nature, invariably one-sided data. Maybe at some point we will get the Chinese, North Koreans, Vietnamese, Syrians, etc. to open up their archives to us researchers, but, except for possibly Vietnam, I don’t think that is going to happen any time in the near future. So, we ended up building our post-World War II cases primarily from U.S. data.

We added 10 engagements from the Inchon/Seoul operation in 1950. For Vietnam we added  65 division-level urban engagements from the Tet Offensive in 1968 and 57 division-level non-urban engagements. We also added 56 battalion-level urban engagements from the Tet Offensive (all in Hue). We had 14 division-level urban engagements and 65 division-level non-urban engagements from various contingencies and conventional operations from 1944 to 2003. This included ELAS Insurgency, Arab-Isreali Wars, Panama, Mogadishu, the 1991 Gulf War and Baghdad in 2003. We also added 9 battalion-level urban cases, mostly from Beirut 1982-1984.

To add it all up this was:

                                                 Urban       Non-urban

Phase I (ETO)                              46              91

Phase II (Kharkov/Kursk)             51              65

Phase III (Manila/PTO)                53              41

Post-WWII – Division-level           89            123

Post-WWII – Battalion-level          65               0

                                                   ——-         ——

Total cases                                 304           319

This is a lot of cases for comparisons.

Just to show how they match up (from page 28 of the report):

Attackers in Division-Level Engagements:

Urban

PTO Kor Tet Oth ETO EF (Ger Atk) EF (Sov Atk)
Avg Str/day 12,099 28,304 6,294 10,903 34,601 17,080 17,001
Avg Cas 78 30 94 254 178 86 371
Avg Cas/day 78 30 39 59 169 86 371
Avg % Loss/day 0.63 0.71 0.78 0.56 0.50 0.49 1.95
Wgt % Loss/day 0.65 0.71 0.62 0.54 0.49 0.50 2.18


Non-urban

PTO Tet Oth ETO EF (Ger Atk) EF (Sov Atk)
Avg Str/day 17,445 13,232 18,991 21,060 27,083 27,044
Avg Cas 663 44 377 469 276 761
Avg Cas/day 221 22 191 237 206 653
Avg % Loss/day 0.83 0.19 1.56 1.09 1.00 2.39
Wgt % Loss/day 1.27 0.17 1.01 1.13 0.76 2.41

I will pick up more on the Phase III effort in a subsequent posting (a part 3 to this series). These charts are also on page 238 of War by Numbers.


P.S. The blog the image was taken from (it is a collection of pictures taken from the fighting in Hue): https://vulep-photo.blogspot.com/2013/01/hue-1968-tet-mau-than_3410.html


Measuring the Effects of Combat in Cities, Phase III – part 1

Now comes Phase III of this effort. The Phase I report was dated 11 January 2002 and covered the European Theater of Operations (ETO). The Phase II report [Part I and Part II] was dated 30 June 2003 and covered the Eastern Front (the three battles of Kharkov). Phase III was completed in 31 July 2004 and covered the Battle of Manila in the Pacific Theater, post-WWII engagements, and battalion-level engagements. It was a pretty far ranging effort.

In the case of Manila, this was the first time that we based our analysis using only one-side data (U.S. only). In this case, the Japanese tended to fight to almost the last man. We occupied the field of combat after the battle and picked up their surviving unit records. Among the Japanese, almost all died and only a few were captured by the U.S. So, we had fairly good data from the U.S. intelligence files. Regardless, the U.S. battle reports for Japanese data was the best data available. This allowed us to work with one-sided data. The engagements were based upon the daily operations of the U.S. Army’s 37th Infantry Division and the 1st Cavalry Division.

Conclusions (from pages 44-45):

The overall conclusions derived from the data analysis in Phase I were as follows, while those from this Phase III analysis are in bold italics.

  1. Urban combat did not significantly influence the Mission Accomplishment (Outcome) of the engagements. Phase III Conclusion: This conclusion was further supported.
  2. Urban combat may have influenced the casualty rate. If so, it appears that it resulted in a reduction of the attacker casualty rate and a more favorable casualty exchange ratio compared to non-urban warfare. Whether or not these differences are caused by the data selection or by the terrain differences is difficult to say, but regardless, there appears to be no basis to the claim that urban combat is significantly more intense with regards to casualties than is non-urban warfare. Phase III Conclusion: This conclusion was further supported. If urban combat influenced the casualty rate, it appears that it resulted in a reduction of the attacker casualty rate and a more favorable casualty exchange ratio compared to non-urban warfare. There still appears to be no basis to the claim that urban combat is significantly more intense with regards to casualties than is non-urban warfare.
  3. The average advance rate in urban combat should be one-half to one-third that of non-urban combat. Phase III Conclusion: There was strong evidence of a reduction in the advance rates in urban terrain in the PTO data. However, given that this was a single extreme case, then TDI still stands by its original conclusion that the average advance rate in urban combat should be about one-half to one-third that of non-urban combat/
  4. Overall, there is little evidence that the presence of urban terrain results in a higher linear density of troops, although the data does seem to trend in that direction. Phase III Conclusion: The PTO data shows the highest densities found in the data sets for all three phases of this study. However, it does not appear that the urban density in the PTO was significantly higher than the non-urban density. So it remains difficult to tell whether or not the higher density was a result of the urban terrain or was simply a consequence of the doctrine adopted to meet the requirements found in the Pacific Theater.
  5. Overall, it appears that the loss of armor in urban terrain is the same as or less than that found in non-urban terrain, and in some cases is significantly lower. Phase III Conclusion: This conclusion was further supported.
  6. Urban combat did not significantly influence the Force Ratio required to achieve success or effectively conduct combat operations. Phase III Conclusion: This conclusion was further supported.
  7. Nothing could be determined from an analysis of the data regarding the Duration of Combat (Time) in urban versus non-urban terrain. Phase III Conclusion: Nothing could be determined from an analysis of the data regarding the Duration of Combat (Time) in urban versus non-urban terrain.

So, in Phase I we compared 46 urban and conurban engagements in the ETO to 91 non-urban engagements. In Phase II, we compared 51 urban and conurban engagements in an around Kharkov to 49 non-urban Kursk engagements. On Phase III, from Manila we compared 53 urban and conurban engagements to 41 non-urban engagements mostly from Iwo Jima, Okinawa and Manila. The next blog post on urban warfare will discuss our post-WWII data.

P.S. The picture is an aerial view of the destroyed walled city of Intramuros taken on May 1945

Measuring the Effects of Combat in Cities, Phase II – part 2

There was actually supposed to be a part 2 to this Phase II contract, which was analysis of urban combat at the army-level based upon 50 operations, of which a half-dozen would include significant urban terrain. This effort was not funded.

On the other hand, the quantitative analysis of battles of Kharkov only took up the first 41 pages of the report. A significant part of the rest of the report was a more detailed analysis and case study of the three fights over Kharkov in February, March and August of 1943. Kharkov was a large city, according to the January 1939 census, it has a population of 1,344,200, although a Soviet-era encyclopedia gives the pre-war population as 840,000. We never were able to figure out why there was a discrepancy. The whole area was populated with many villages. The January 1939 gives Kharkov Oblast (region) a population of 1,209,496. This is in addition to the city, so the region had a total population of 2,552,686. Soviet-era sources state that when the city was liberated in August 1943, the remaining population was only 190,000. Kharkov was a much larger city than any of the others ones covered in Phase I effort (except for Paris, but the liberation of that city was hardly a major urban battle).

The report then does a day-by-day review of the urban fighting in Kharkov. Doing a book or two on the battles of Kharkov is on my short list of books to write, as I have already done a lot of the research. We do have daily logistical expenditures of the SS Panzer Corps for February and March (tons of ammo fired, gasoline used and diesel used). In March when the SS Panzer Corps re-took Kharkov, we noted that the daily average for the four days of urban combat from 12 to 15 March was 97.25 tons of ammunition, 92 cubic meters of gasoline and 10 cubic meters of diesel. For the previous five days (7-11 March) the daily average was 93.20 tons of ammunition, 145 cubic meters of gasoline and 9 cubic meters of diesel. Thus it does not produce a lot of support for the idea that–as has sometimes been expressed (for example in RAND’s earlier reports on the subject)–that ammunition and other supplies will be consumed at a higher rate in urban operations.

We do observe from the three battles of Kharkov that (page 95):

There is no question that the most important lesson found in the three battles of Kharkov is that one should just bypass cities rather than attack them. The Phase I study also points out that the attacker is usually aware that faster progress can be made outside the urban terrain, and that the tendency is to weight one or both flanks and not bother to attack the city until it is enveloped. This is indeed what happened in two of the three cases at Kharkov and was also the order given by the Fourth Panzer Army that was violated by the SS Panzer Corps in March.

One must also note that since this study began the United States invaded Iraq and conducted operations in some major urban areas, albeit against somewhat desultory and ineffective opposition. In the southern part of Iraq the two major port cities Umm Qasar and Basra were first enveloped before any forces were sent in to clear them. In the case of Baghdad, it could have been enveloped if sufficient forces were available. As it was, it was not seriously defended. The recent operations in Iraq again confirmed that observations made in the two phases of this study.

P.S. The picture is of Kharkov in 1942, when it was under German occupation.