Category U.S. Military Doctrine

“Our enemies generally shoot first 80 percent of the time”

Someone just asked me about a quote in the following article:
https://breakingdefense.com/2020/11/army-wants-smaller-brigades-stronger-divisions-lots-of-robots/

The quote is:

“Historical data on direct-fire engagements “shows that our enemies generally shoot first 80 percent of the time,” Sando said. “We don’t like those odds, [so] we want to avoid the close fight if we can. If we can’t avoid it, we want to enter it under conditions that are favorable to us.”

The question was: did this statistic come from us or do we know where it came from? Well, it definitely did not come from our work or Trevor Dupuy’s work. I have never heard of such a claim before.

Does anyone know where this came from? Is there some study or piece of quantitative historical analysis that this claim is based upon. I have my doubts about the accuracy of this claim.

If the data was drawn from unconventional (recent) warfare scenarios, then by nature of those conflicts, the insurgents initiate engagements more often than the counterinsurgents do. Not sure it would be as high as 4-to-1.

If it was drawn from conventional war scenarios, then by their nature it should be 50/50, unless you are always the attacker. Even then I am not it would be as high as 4-to-1.


Force Ratios at Kharkov and Kursk, 1943

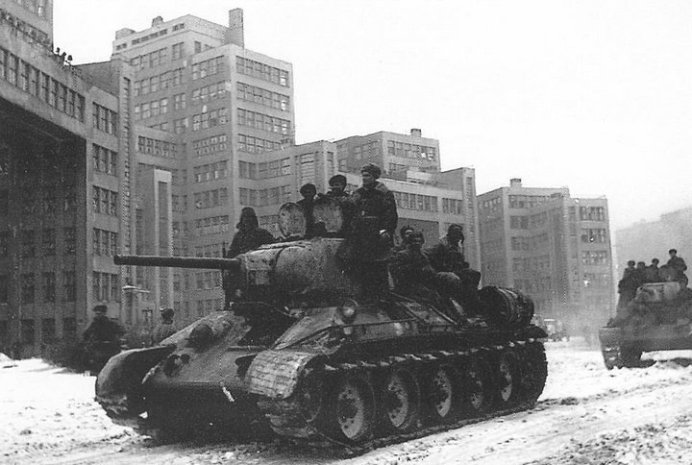
T-34 Tanks near the Derzhprom building during brief Soviet re-occupation of Kharkov, February 1943. Source: https://thecharnelhouse.org/

Now, some of the data provided in the previous posts were muddied by the fact that there were serious differences in the performances of the opposing armies. This is true for the German Army versus the Soviet Army in 1943, the Israeli Army versus the Arab armies in 1956-1973, and for the U.S. Army, USMC and allied armies versus the Iraqi Army in 1991. To a much lesser extent, it is also true for the German Army versus the U.S and UK armies up through the middle of 1944. This is discussed in some depth in my book War by Numbers.

As such, this seems like also a good time to again briefly address this issue. We need to break down the force ratio tables by which nationality is attacking. First let us look at the Eastern Front World War II data:

World War II, Kharkov and Kursk 1943 (180 cases)

German Army attacking the Soviet Army – culled data set (100 cases)

Force Ratio…………………Percent Attacker Wins……………..Number of Cases

0.49………………………………..0%…………………………………………….1

0.58 to 0.95………………………90……………………………………………..10

1.01 to 1.49……………………..100……………………………………………..30

1.52 to 1.96………………………95……………………………………………..19

2.09 to 2.42…………………….100……………………………………………….6

2.57 to 2.87…………………….100……………………………………………….7

3.00 to 3.45…………………….100……………………………………………….8

3.60 to 3.79…………………….100……………………………………………….2

4.31 to 5.85………………………92……………………………………………..13

6.48 to 6.63…………………….100……………………………………………….2

8.60 to 11.41…………………..100……………………………………………….2


In these hundred battles, when the Germans are on the offensive, they win 96% of the time. That is a pretty impressive result. The full data set with another 28 cases that include “limited action” and “limited attack” are listed below.

German Army attacking the Soviet Army – complete data set (128 cases)

Force Ratio………………….Percent Attacker Wins…………………Number of Cases

0.49…………………………………….0%…………………………………………….1

0.58 to 0.95…………………………..47…………………………………………….19

1.01 to 1.49…………………………..88…………………………………………….34

1.52 to 1.96…………………………..77…………………………………………….26

2.09 to 2.42…………………………..86………………………………………………7

2.57 to 2.98…………………………100………………………………………………9

3.00 to 3.45…………………………100………………………………………………8

3.60 to 3.79…………………………100………………………………………………3

4.31 to 5.85…………………………..71…………………………………………….17

6.48 to 6.63…………………………100………………………………………………2

8.60 to 11.41……………………….100………………………………………………2


Out of these 128 battles, when the Germans attack they win 79% of the time. This is still impressive by any standard. Because of the additional cases being “limited action” and “limited attack” there are a lot of drawn engagements in this data set. The “culled” data set has three defender victories and one draw (and 96 attacker wins). This one has five defender victories and 22 drawn engagements. Now, let us look at how the Soviets do in response. These are the opposing forces on the same battlefield, similar terrain, similar weather, and often on the same day

Soviet Army attacking the German Army – culled data set (41 cases)

Force Ratio…………………Percent Attacker Wins…………………Number of Cases

0.40 to 0.43……………………..67%………………………………………………..3

0.51 to 0.99……………………..18…………………………………………………11

1.02 to 1.46……………………..25…………………………………………………16

1.53 to 1.96……………………..50…………………………………………………..4

2.08 to 2.31……………………..50…………………………………………………..4

2.79 to 2.89……………………..33…………………………………………………..3


This is a very different result than what we see for the Germans. Out of the 41 attacks, the Soviets win 13 times or 32%. If I compare the German results of their attacks at odds below three-to-one, I have the Soviets succeeding 32% of the time while the Germans are succeeding 96% of the time (70 out of 73 attacks). Hard to argue that there is not a performance difference as the two armies in 1943 were roughly equivalent in armament and the mix of armaments. Each of the engagements from Kursk are presented in considerable detail in my books on the battle.[1]

The same data, but including “limited action” and “limited attack” is shown below:

Soviet Army attacking the German Army – complete data set (52 cases)

Force Ratio…………………Percent Attacker Wins………………….Number of Cases

0.40 to 0.49……………………..50%…………………………………………………4

0.51 to 0.99……………………..14………………………………………………….14

1.01 to 1.46……………………..19………………………………………………….21

1.53 to 1.96……………………..40……………………………………………………5

2.08 to 2.31……………………..50……………………………………………………4

2.66 to 2.89……………………..25……………………………………………………4


With this data set, out of 52 engagements the attacker still only won 13 times, or 25%.


[1] See Lawrence. Kursk: The Battle of Prokhorovka (2015) and The Battle of Prokhorovka (2019). The first book lays out all 192 engagements from the offensive in the south while the second book provided the detailed data for 76 of the engagements. Each engagement has a separate engagement sheet that lays out the forces involved, their strength and their losses. There is a detail narrative of their operations in the text of the books. If anyone has any questions over the accuracy or interpretation of this data, it is presented in these books, developed primarily from the unit records of both sides (primary sources).

Summation of Force Ratio Posts

I think the following posts make the cases that the three-to-one rule as presented in Army FM 6-0 and other publications is incorrect (50% chance of the defender winning at 3-to-1). If there is any historical evidence that supports this claim, then I would ask that TRADOC, which is responsible for these manuals, to produce such evidence. I strongly suspect there is no such evidence. I would hope that we will see corrective action from TRADOC.

The U.S. Army Three-to-One Rule

The U.S. Army Three-to-One Rule versus 243 Battles 1600-1900

The U.S. Army Three-to-One Rule versus 49 U.S. Civil War battles

The U.S. Army Three-to-One Rule versus the 752 Case Division-level Data Base 1904-1991

The World War I Cases from the Division-level Database

The World War II Cases from the Division-level Database

Post-World War II Cases from the Division-level Database

The Source of the U.S. Army Three-to-One Rule

My next few blog posts are going to address the impact of “Human Factors” on these force ratios.

The Source of the U.S. Army Three-to-One Rule

Oddly enough, 1991 was when this rule was first published, that we are aware of. It was published in the CGSC (Command and General Staff College) Student Text 100-9: Techniques and Procedures for Tactical Decision Making dated July 1991. There may have been work or materials prepared before then that we are not aware of.

The actual statement in that publication is that “Historical experience has shown that a defender has approximately a 50-50 probability of successfully defeating an attacking force approximately three times his equivalent strength.” The publication then goes on to recommend that for planning purposes that they “Therefore, as our start part, we will attempt to defend on each avenue of approach with, roughly, a 1-to-3 force rations expressed as a US unit defending against the next higher level enemy unit. For example, a US battalion would defend against an enemy regiment. There are only tools for the plan. Table 3-2 shows the preferred minimum planning ratios used to initially array forces.” The key here is the words “initially” and “to start with.” When deploying out a force, seeing up a blocking force that may be initially outnumbered three-to-one in an planned deployment does not mean that it will be outmatched in combat power by three-to-one as the battle develops. It is possible to reinforce the unit, provide it with artillery or air support, or withdraw to a more favorable position. So, the guidance that forces should be arrayed one level lower than the expected opposition is not bad guidance, even though one of the arguments made in that 1991 document supporting this is clearly wrong. The problem is that this rule is now repeated in other army documents without fully clarifying that this is just a planning factor for initial dispositions. It is also serving as the basis for charts in manuals and informal casualty estimation and modeling procedures. The army now commonly publishes the following table (from the proposed ATP 5-0.2, 31 July 2019):

Historical minimum planning ratios

Friendly Mission                     Friendly: Enemy

Hasty defend                          1:2.5

Deliberate defend                   1:3

Hasty attack                            2.5:1

Deliberate attack                     3:1

Delay                                       1:6

Counterattack                         1:1

Penetration (lead element)      18:1


This table, as shown by the data leave the impression that you need to have three-to-one odds to attack and that one-to-three odds is sufficient for defense. This would be the wrong impression to give. To claim that it is “historical” gives it more authority than it deserves, as the historical data in fact does not support this table. They are “minimum planning” factors, and that needs to properly stressed.

The bigger problem is that you fight as your train. So, if the officer corps is trained that you need at least a three-to-one force ratio to have a 50% chance of winning, then what kind of war planning and offensive action is now being envisioned? In World War II, the most common attack in our database are those at odds 1.00- to 1.49-to-one and they win 63% of the time. In the post-World War II engagements, the most common attack is done at 0.54- to 0.97-to-1 and the attacker wins 75% of the time (20 cases). So to what reality are we training our officers? Are we training the next generation of George B. McCellans?

Post-World War II Cases from the Division-level Database

We have 66 engagements in our database from after World War II. There are 51 cases from the Arab-Israeli Wars and 15 cases from the 1991 Gulf War.

Arab-Israeli Wars 1956-1973 (51 cases)

Force Ratio…………………Percent Attacker Wins………………..Number of Cases

0.54 to 0.97-to-1……………….76%…………………………………………….17

1.00 to 1.47-to-1……………….82……………………………………………….11

1.51 to 1.99-to-1……………….50…………………………………………………4

2.04 to 2.25-to-1……………….50…………………………………………………4

2.90-to-1……………………….100…………………………………………………1

3.03 to 3.59-to-1…………………0…………………………………………………2

3.50 to 3.96-to-1……………….25…………………………………………………4

4.11 to 5.87-to-1……………….40…………………………………………………5

6.06-to-1……………………….100…………………………………………………1

8.02 to 12.18-to-1…………….100…………………………………………………2


Now, this data is highly variable, with the largest number of attacks being conducted at less than one-to-one odds and the attacker winning 76% of the time. This is because of a significant difference in the combat capability of Israeli forces compared to the Egyptians, Syrians and other Arab armies that they are engaged with. This difference is well documented and discussed in more depth in my book War by Numbers. Of the 17 attacks at less than one-to-one odds, 16 were conducted by the Israelis and only one attack was conducted by the Arab armies. The Iraqi attack at those low odds was resoundingly defeated (Tel el Hara, 11 October 1973).

There is a similar performance disparity between the German and the Soviet armies in 1943. This also affects the force ratio data from World War II. We will separate these cases out by who the attacker is just to clarify the results. In the case of the Gulf War, the difference in morale, motivation and performance of the two armies were extremely disparate. This is a fairly extreme case, although not the only such case in history.

Gulf War (1991):

Force Ratio…………………..Percent Attacker Wins…………………Number of Cases

0.20 to 0.21…………………………0…………………………………………………..2

0.64 to 0.93………………………..67…………………………………………………..3

1.10 to 1.16………………………100…………………………………………………..2

None between 1.16 and 2.47

2.47……………………………….100………………………………………………….1

2.60 to 2.86………………………100………………………………………………….5

3.00 to 3.26………………………..50………………………………………………….2


One is hesitant to draw any conclusions from this data. The one attack that failed at three-to-one was the Iraqi Army attack at Khafji 29 January – 1 February 1991. In fact, all four failed attacks in the data set occurred when the Iraqis were attacking.

Anyhow, these databases can certainly be expanded and further analysis can be done, but good luck finding the three-to-one rule in this data that results in the defender winning 50% of the time. It is clear that from 1600 to 1991 that the attacker won more often than not at two-to-one odds or even lower, depending on the period and the forces involved. There is really no historical evidence supporting the Army version of this rule that I know of. I have been in this industry for over three decades and have not seen such evidence. I am not aware of any databases the size, depth or range of ones used here. If this historical data does not establish the rule, then where is the historical data that does?

The U.S. Army Three-to-One Rule versus the 752 Case Division-level Data Base 1904-1991

Our most developed database through is our division-level database of 752 cases covering combat from 1904 to 1991. As this addresses modern combat, it is a useful database for such a test. Of those 752 cases, we have the forces ratios and outcome for 672 of them. All the engagements previously discussed from ETO in 1944 and Kharkov and Kursk in 1943 are drawn from this database. As such, there is some overlap between these 672 cases and the 116 cases from ETO and 73 cases from the Eastern Front previously used. The data shows a very clear pattern related to force ratios.

Division-level Engagements 1904-1991 (672 cases)

Force Ratio…………………..Percent Attacker Wins………………Number of Cases

0.20 to 0.20-to-1………………..0%………………………………………………….2

0.25 to 04.9-to-1………………22…………………………………………………….9

0.50 to 0.99-to-1………………42…………………………………………………..77

1.00 to 1.49-to-1………………55…………………………………………………150

1.50 to 1.99-to-1………………59…………………………………………………123

2.00 to 2.49-to-1………………71…………………………………………………..56

2.50 to 2.99-to-1………………83…………………………………………………..53

3.00 to 3.49-to-1………………69…………………………………………………..48

3.50 to 3.98-to-1………………77…………………………………………………..30

4.06 to 5.87-to-1………………65…………………………………………………..66

6.06 to 7.90-to-1………………88…………………………………………………..17

8.20 to 17.87-to-1……………100…………………………………………………..22


This table drives home in spades the problem with the U.S. Army current interpretation of the three-to-one rule (50% chance of defender success). To start with, the attacker starts winning over half the time at 1.00 to 1.49-to-1 odds. By the time they get to 2.50 to 2.99-to-1 odds they are winning 83% of the time. It is quite clear from this data that the U.S. Army rule is wrong.

Now, this data is skewed a little bit by the inclusion of engagements with “limited action” or only “limited attack.” They include engagements where the attacker has a significant force ratio but conducted only an initial probing attack of battalion size. Sometimes those attacks did not succeed. So the success rate of some the higher odds engagements would actually be higher if these were eliminated. So, we ended up culling 102 of these engagements from the above table to produce the following table.  There is not a big difference in the results between this tighter table of 570 cases and the previous table of 672 cases. The primary difference is that the attacker tends to be more successful in all categories. All the culled engagements were from World War II.

Division-level Engagements, 1904-1991 (570 cases) – culled data set


Force Ratio………………….Percent Attacker Wins……………….Number of Cases

0.20 to 0.20-to-1………………..0%…………………………………………………2

0.25 to 04.9-to-1………………25……………………………………………………8

0.50 to 0.99-to-1………………52…………………………………………………..62

1.00 to 1.49-to-1………………62…………………………………………………133

1.50 to 1.99-to-1………………66…………………………………………………108

2.00 to 2.49-to-1………………80………………………………………………….49

2.50 to 2.99-to-1………………83………………………………………………….48

3.00 to 3.49-to-1………………70………………………………………………….40

3.50 to 3.98-to-1………………76………………………………………………….29

4.06 to 5.87-to-1………………73………………………………………………….55

6.06 to 7.90-to-1………………88………………………………………………….17

8.20 to 17.87-to-1……………100………………………………………………….17

56.20-109.98-to-1……………100…………………………………………………..2


Needless to say, this tighter data set is even further biased against the published U.S. Army three-to-one rule.

The U.S. Army Three-to-One Rule versus 49 U.S. Civil War battles

From 1st Alabama Cavalry, USV website (www.1stalabamacavalryusv.com). Alexander Lawrence was from Fayette County, Alabama and fought for the Union with the 1st Alabama Cavalry

As the three-to-one rule of thumb appears to have evolved out of the American Civil War (although not as published in FM 6-0), then we should probably look at just our Civil War battles in our database.

Among those 243 cases are 49 cases from the American Civil War. As the three-to-one rule may have evolved from that experience, let us looking at just those cases:

 Force Ratio……………………Percent Attacker Wins……………….Number of Cases

0.44 to 0.48-to-1…………………0%………………………………………………3

0.53 to 0.97-to-1………………..18……………………………………………….11

1.00 to 1.47-to-1………………..36……………………………………………….14

1.53 to 1.96-to-1………………..25……………………………………………….12

2.10 to 2.31-to-1………………..50…………………………………………………6

3.00-to-1……………………….100…………………………………………………1

5.00-to-1……………………….100…………………………………………………1

15.05-to-1……………………..100…………………………………………………1


The American Civil War is a very good test case for such an examination. Both officer corps were primarily trained at West Point (the U.S. military academy); both armies fought in the same style and doctrine; they used most of the same weapons, including the same muskets and same artillery; they were similar in culture; and they were similar in training, doctrine, background and capability. While some historical mythology has tried to make the southern Americans better fighters, it is hard to accept the argument that a farmer from North Carolina is a different, more motivated or a more capable fighter than a farmer from Pennsylvania. Most of the United States was rural. There wre also units raised to fight for the north from all of the southern states. This is about an equal comparison between two opponents that one is going to find.

The end results from these two tests are that the three-to-one rule as recorded in FM 6-0 clearly does not apply. In the case of the Civil War data at 2.10 to 2.31-to-1 odds the attacker is winning half the time. Where does one get the notion that at 3.00-to-1 odds the defender will win half the time? What historical data established that?

So the U.S. Army version of the three-to-one (meaning defender wins half the time) does not show up in the almost 400 years of history that we are examining here and does not show up in the American Civil War.

The U.S. Army Three-to-One Rule versus 243 Battles 1600-1900

Now, at the time I wrote War by Numbers, I was not aware of this sentence planted in FM 6-0 and so therefore did not feel a need to respond to the “3-to-1 rule.” It is a rule of thumb, not completely without value, that had been discussed before. I thought this issue was properly understood in the U.S. analytical and defense community, therefore I did not feel a need to address it further. It turns out that I do. So, let me take a moment to tap into our databases and properly address this using all the resources at my disposal.

First of all, The Dupuy Institute has a database of 243 engagements from 1600-1900 called the Battles Data Base (BaDB). These are almost all field battles, where the two sides deployed their forces of tens of thousands of people and resolve their dispute that day. Of the 243 battles, only 40 of them last longer than a day. The largest engagement has the attacker fielding 365,000 men (Leipzig, 1813) and the smallest engagement had the defender fielding but 350 men (Majuba Hill, 1881).

As this rule of thumb evolved out of the U.S. Civil War, then an examination of historical field battles from 1600-1900 is particularly relevant. Looking at the force ratio for these battles shows:

Force Ratio…………………..Percent Attacker Wins………………..Number of Cases

0.26 to 04.9-to-1………………54%……………………………………………13

0.50 to 0.98-to-1………………54………………………………………………81

1.00 to 1.47-to-1………………56………………………………………………71

1.50 to 1.96-to-1………………63………………………………………………38

2.00 to 2.44-to-1………………50………………………………………………16

2.58 to 2.94-to-1………………57………………………………………………..7

3.00 to 3.43-to-1…………….100………………………………………………..5

3.75 to 3.76-to-1………………..0………………………………………………..2

4.00 to 4.93-to-1………………75………………………………………………..4

7.78 to 16.82-to-1……………..67………………………………………………..6


The pattern here is not particularly clear, as low odds attack, where the attacker is outnumbered, succeed over half the time, as do attacks at higher odds. Some of this is due to the selection of battles, some of this is due to the lack of regular trained armies, and some of this is due to the attacker choosing to attack because they have advantages in morale, training, experience, position, etc. that outweigh the numbers. But, the argument that is made in FM 6-0 that based upon historical data at three-to-one odds the defender wins 50% of the time is clearly not shown. For example, in this data set there are 12 cases between the odds of 2.50 to 3.50-to-1. Of those 12 cases, the attacker wins in 9 of them (75%). The three cases where the defender wins are: 1) Battle of Buena Vista in 1847 where Santa Anna’s Mexican Army attacked Zachary Taylor’s American Army at 2.94-to-1, 2) Battle of Inkeman in 1854 where the Russian Army attacked the French and British armies in Crimea at 2.63-to-1, and 3) Battle of Belfort in 1871 where the French Army attack the German Army at 2.75-to-1. One could certainly argue that in these three cases, the defenders held advantages in training, experience and overall combat effectiveness.

Next post will address the 49 American Civil War battles in our database.

The U.S. Army Three-to-One Rule

Various Three-to-one rules of thumbs have existed in the U.S. Army and in writings possibly as early as the American Civil War (1861-1865). These are fine as “rules of thumb” as long as one does not take them seriously and understands what they really mean. But, unfortunately, we have now seen something that is a loose rule of thumb turned into a codified and quantified rule. This is annoyingly overstating its importance and as given in U.S. Army manuals, is patently false.

The U.S. Army has apparently codified the “three-to-one rule” in its documentation and has given it a value. In the 2014 edition of FM 6-0, paragraph 9-103, it states that “For example, historically, defenders have over a 50 percent probability of defeating an attacking force approximately three times their equivalent strength.” This statement, on the surface, simply is incorrect. For example, the following table from my book War by Numbers is drawn from a series of 116 division-level engagements in France in 1944 against the Germans (see War by Numbers, page 10) They show the following relationship between force ratio and outcome:

European Theater of Operations (ETO) Data, 1944


Force Ratio………………..Result…………………Percent Failure…Number of cases

0.55 to 1.01-to-1.00………Attack Fails…………………..100%……………….5

1.15 to 1.88-to-1.00………Attack usually succeeds……21%………………..48

1.95 to 2.56-to-1.00………Attack usually succeeds……10%………………..21

2.71-to-1.00 and higher…Attacker Advances…………….0%……………….. 42


Now these engagements are from fighting between the U.S., UK and Germany in France and Germany in 1944. These are engagements between forces of roughly equal competence. As can be seen, based upon 42 division-level engagements, in all cases of attacks at three-to-one (more specifically 2.71-to-1 and greater), the attacker advanced. Meaning in all cases of attacks at three-to-one, the attacker won. This directly contradicts the statement in FM 6-0, and contradicts it based upon historical data.

This is supplemented by the following two tables on the next page of War by Numbers. The first table shows the German performance when attacking Soviet units in 1943.

Germans attacking Soviets (Battles of Kharkov and Kursk), 1943


Force Ratio………………..Result………………….Percent Failure…Number of cases

0.63 to 1.06-to-1.00………Attack usually succeeds……..20%……………………..5

1.18 to 1.87-to-1.00………Attack usually succeeds……….6%……………………17

1.91-to-1.00 and higher…Attacker Advances……………….0%……………………21


The next table shows the Soviet performance when attacking German units in 1943:

Soviets attacking Germans (Battles of Kharkov and Kursk), 1943


Force Ratio………………Result…………………..Percent Failure…Number of cases

0.40 to 1.05-to-1…………Attack usually fails…………70%……………………10

1.20 to 1.65-to-1.00…….Attack often fails…………….50%……………………11

1.91 to 2.89-to-1.00…….Attack sometimes fails…….44%……………………..9


These charts are from the fighting around Kharkov in February, March and August of 1943 and the fighting during the Battle of Kursk in July 1943. It is 73 engagements between the German and Soviet armies.

Now, there is a clear performance difference between the German and the Soviet armies at this time. This is discussed in considerable depth in War by Numbers and will not be addressed here. But, what it amounts to is that the German Army has an advantage in the casualty exchange and that advantage also shows up in the outcomes of the battles, as show above. If they attacked at two-to-one odds are greater, they would win. The Soviets attacking at the same odds would win only 56 percent of the time. Clearly, at the division-level, in a unit to unit comparison, the Germans were two or three times better than their Soviet opponents.

Still, even in the worse case, which is the Soviets attacking the Germans, we do not get to the claim made in FM 6-0, which is the defender won 50% of the time when attacked at three-to-one. In fact, the Soviets managed to win 50% of the time when attacking at 1.20 to 1.65-to-1. Something is clearly wrong with the statement in FM 6-0.

Now, at the time I wrote War by Numbers, I was not aware of this sentence planted in FM 6-0 and so therefore did not feel a need to respond to the “three-to-one rule.” It is a rule of thumb, not completely without value, that had been discussed before (see Dupuy, Understanding War, pages 31-37). I thought this issue was properly understood in the U.S. analytical and defense community, therefore I did not feel a need to address it further. It turns out that I do. So, I will take a moment to tap into our databases and properly address this using all the resources at my disposal. This will be in subsequent blog posts.

What Did James Mattis Mean by “Lethality?”

Then-Lt. Gen. James Mattis, commander of U.S. Marine Corps Forces, Central Command, speaks to Marines with Marine Wing Support Group 27, in Al Asad, Iraq, in May 2006. [Photo: Cpl. Zachary Dyer]

Ever since publication of the U.S. National Defense Strategy by then-Secretary of Defense James Mattis’s Defense Department in early 2018 made the term “lethality” a foundational principle, there has been an open-ended discussion as to what the term actually means.

In his recent memoir, co-written with Bing West, Call Sign Chaos: Learning to Lead (Random House, 2019), Mattis offered his own definition of lethality. Sort of.

At the beginning of Chapter 17 (pages 235-236), he wrote (emphasis added):

LETHALITY AS THE METRIC

History presents many examples of militaries that forgot that their purpose was to fight and win. So long as we live in an imperfect world, one containing enemies of democracy, we will need a military strictly committed to combat-effectiveness. Our liberal democracy must be protected by a bodyguard of lethal warriors, organized, trained, and equipped to dominate in battle.

The need for lethality must be the measuring stick against which we evaluate the efficacy of our military. By aligning the entire military enterprise—recruiting, training, educating, equipping, and promoting—to the goal of compounding lethality, we best deter adversaries, or if conflict occurs, win at lowest cost to our troops’ lives. …

While not defining lethality explicitly, it would appear that Mattis equates it with “combat-effectiveness,” which he also does not explicitly define, but seems to mean as the ability “to dominate in battle.” It would seem that Mattis understands lethality not as the destructive quality of a weapon or weapon system, but as the performance of troops in combat.

More than once he also refers to lethality as a metric, which suggests that it can be quantified and measured, perhaps in terms of organization, training, and equipment. It is likely Mattis would object to that interpretation, however, given his hostility to Effects Based Operations (EBO), as implemented by U.S. Joint Forces Command, before he banned the concept from joint doctrine in 2008, as he related on pages 179-181 in Call Sign Chaos.