Category Russia

Throwing the Dice

This is a follow-up to the blog post:

China and Russia Defeats the USA

One of readers commented on this post and posted the following link: Paper Wargames and Policy Making

In case you are not reading the comments to our blog post, wanted to make sure this was brought to your attention. The article is worth taking a look at just for the pictures. A few highlights:

  1. “In my lifetime, computer-based simulation have largely taken over analytical gaming, sometimes bringing new levels of investigative power, but often just providing the illusion of it as the details of the models and their simplifying assumptions become invisible to players and to the policymakers whose decisions the games are supposed to inform.”
  2. However, it gradually became clear [with the Baltic states wargame] — rather disconcertingly–that we were out in front of most of the official planning, not following in its wake.”
  3. “The resulting game….resolves combat using 12-hour turns and 10-km hexes; units are battalions of ground forces, SAM batteries, and half-squadrons of aircraft (12 fighters or six bombers).”
  4. “…and they like throwing the dice.”

China and Russia Defeats the USA

A couple of recent articles on that latest wargaming effort done by RAND:

https://www.americanthinker.com/blog/2019/03/rand_corp_wargames_us_loses_to_combined_russiachina_forces.html

The opening line states: “The RAND Corporation’s annual ‘Red on Blue’ wargame simulation found that the United States would be a loser in a conventional confrontation with Russia and China.”

A few other quotes:

  1. “Blue gets its ass handed to it.”
  2. “…the U.S. forces ‘suffer heavy losses in one scenario after another and still can’t stop Russia or China from overrunning U.S. allies in the Baltics or Taiwan:”

Also see: https://www.asiatimes.com/2019/03/article/did-rand-get-it-right-in-its-war-game-exercise/

A few quotes from that article:

  1. “The US and NATO are unable to stop an attack in the Balkans by the Russians,….
  2. “…and the United States and its allies are unable to prevent the takeover of Taiwan by China.

The articles do not state what simulations were used to wargame this. The second article references this RAND study (RAND Report) but my quick perusal of it did not identify what simulations were used. A search on the words “model” and “wargame” produced nothing. The words “simulation” and “gaming” leads to the following:

  1.  “It draws on research, analysis, and gaming that the RAND Corporation has done in recent years, incorporating the efforts of strategists, regional specialists, experts in both conventional and irregular military operations, and those skilled in the use of combat simulation tools.”
  2. “Money, time, and talent must therefore be allocated not only to the development and procurement of new equipment and infrastructure, but also to concept development, gaming and analysis, field experimentation, and exploratory joint force exercises.”

Anyhow, curious as to what wargames they were using (JICM – Joint Integrated Contingency Model?). I was not able to find out with a cursory search.

What would a reconstituted Soviet Union/Russian Empire look like?

The Soviet Union broke up into 15 separate countries in December 1991. What would a reconstituted Soviet Union/Russian Empire look like, if that is indeed one of the goals of Russian leadership (and some people say it is).

1. Russia, 2. Ukraine, 3. Belarus, 4. Uzbekistan, 5. Kazakhstan, 6. Georgia, 7. Azerbaijan, 8. Lithuania, 9. Moldavia, 10. Latvia, 11, Kirghizia, 12. Tajikistan, 13. Armenia, 14. Turmenistan, 15. Estonia.


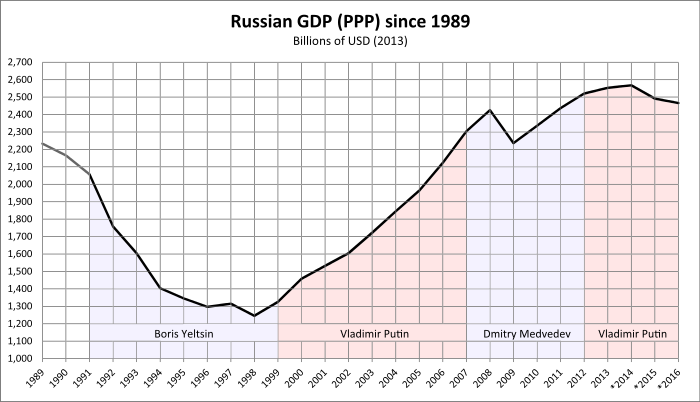
The three Baltic states appear to be out of their grasp, being members of NATO. They are militarily protected by an alliance of 29 members, and their economic growth has been significant. The per capita income of Estonia is $19,840 (IMF 2017), while that of Russia is $10,608. Half of Russia’s GDP is in Moscow, just to drive home what the rest of the country is like.

Some of these countries are united into the Eurasian Economic Union. It consists of five countries: Russia, Armenia, Belarus, Kazakhstan, Kyrgyzstan. It was Ukrainian President Yanukovych’s decision to develop closer economic ties with Russia and the Eurasian Union and back away from an association agreement with the European Union (28 countries) that started the Euromaiden protests in November 2013 that lead to his removal from power in February 2014 (and the Russian seizure of Crimea and the Russian-influenced revolts in Lugansk and Donetsk). The Eurasian Union flag is below. Interesting map choice.

So who would be in a reconstituted Soviet Union/ Russia Empire?

There are the five “stans” in Central Asia (Kazakstan, Uzbekiskan, Kyrgystan, Tajikistan, and Turkmenistan). By the nature of their geography they are somewhat isolated, landlocked, and potentially could be brought back into Russia’s orbit. Two countries are already members of the Russian created Eurasian Union. There is also Belarus, another Eurasian Union member. Belarus does not have a strong history of independence and could be brought back into Russia’s orbit. Belarus might very well rejoin Russia after its dictator Lukaschenko (age 64) moves on to wherever he ends up. These could reconstitute a new force if they could be brought into Russia’s orbit. Some stats:

                            (2018 est.)                 (IMF 2017)

                            Population                 GDP (millions)

Russia                  146,877,088              $1,527,469

Uzbekistan             32,653,900                    47,883

Kazakhstan            18,292,700                  160,839

Belarus                     9,478,200                    54,436

Tajikistan                  8,931,000                      7,234

Kyrgystan                 6,309,300                      7,061

Turkmenistan           5,851,466                    37,926

Sub-Total              228,393,654              1,842,848


This adds up. It is more significant demographically than economically. The per capita income of Uzbekistan is $1,491 per year and Kyrgyzstan and Tajikistan are worse. This recombined country would move from being the 12th richest in the world up to being the 10th richest, ahead of Canada but behind Italy.

Now there are three countries in the Caususus: Georgia, Azerbaijain, and Armenia and four odd political entities (Abkhazia, North Ossetia, Artsakh and Chechnya). Of the three former Soviet countries, Georgia is openly hostile to Russia (and Abkhazia and North Ossetia have been carved from it) and Azerbaijain and Armenia are hostile to each other. They fought a war over the province of Nagorno-Karabakh from 1988-1994, which Armenia won. It is now the Republic of Artsakh.

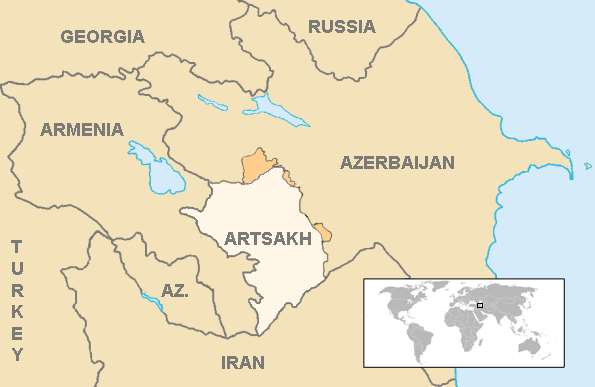
Only Armenia is a member of the Eurasian Union. It will be difficult for Russia to bring these three nations into its fold for a number of reasons, but again they remain relatively isolated with only Iran and Turkey as the neighbors in the region. So…lets us assume this somehow happens:

                            Population                 GDP (millions)

Old Sub-total     228,393,654                1,842,848

Azerbaijain             9,943,226                      40,670

Georgia                  3,729,600                      15,230

Armenia                  2,969,800                     11,037

Abkhazia                    240,705                     N/A

Artsakh                      145,053                      N/A

New sub-total    245,422,038                1,909,785


They are all pretty poor, with Azerbaijan having a per capita income of $4,141 and Georgia and Armenia having similar slightly lower numbers.This really does not get a new Russia Empire back to being a world power. Italy still has a larger GDP.

This now assembles 10 of the original 15 republics together. The three Baltic states are out of reach without a world war, and that leaves only Ukraine and Moldova.

                          Population                 GDP

Ukraine             42,248,129                 109,321

Moldova              3,550,900                    7,945

Transnistria           470,600                      N/A


Note that the Ukrainian population figures excludes Crimea and Sevastopol but includes Lugansk and Donetsk. The per capita income of Ukraine is $2,583 and Moldova is $2,280.

It is clear that if one was going to re-constitute the Soviet Union/Russian Empire that Ukraine is the real prize here. Some argue that this is what the conflict in 2013-2014 was about, and is the source of the continued conflict over Crimea, Lugansk and Donetsk.


P.S. The stats for the three Baltic states are:

                       Population                 GDP

Lithuania        2,799,127                    47,263

Latvia             1,923,400                    30,319

Estonia           1,319,133                    25,973

Population over Time (US vs USSR)

Over last decades, the population of major countries like China, India, Soviet Union/ Russia, Japan, Germany and the United States have changed. This has clearly changed the balance of power between them and will continue to as we move forward into the future. For example:

Unite States versus Soviet Union:

                                              Soviet Union/

Year           United States      Russia                    Ratio

1950/51      151.3 (1950)        182.3 (1951)           0.83-to-1

1980/82      226.5 (1980)        270.0 (1982)           0.84-to-1

2018           308.7                    142.9                      2.16-to-1

2050           402                       132                         3.05-to-1


Now, this is certainly the biggest change we will look at. Russia went from almost being a world power to being a pale reflection of its past power and glory (I am willing to argue that the Soviet Union was never really a world power….it just pretended to be one). Added to that is the economic changes over time. I hesitate to even discuss what the GDP of the Soviet Union was, as the ruble was artificially inflated. When it was floated in the 1990s, it went from one ruble per 1.11 dollars (it always was worth more than a dollar in the Soviet era, of course)…to something like 3,000 rubles to a dollar. They then shaved off two the zeros for the new ruble to make it less than 30 rubles to a dollar. The current exchange rate is 65 rubles to a dollar.

The current Russian GDP is 1.5 trillion (IMF 2017). This is compared to the United States GDP of 19.4 trillion (IMF 2017). So, right now, Russia has less than half the population and less than a tenth of the economy of the United States. In 2050 it will have only a third of the population of the U.S. Who knows what the economy will be. The Russia economy might still be pretty dependent on the price of oil.

With its population declining, its work force aging, its economy built upon export of oil and gas, with wide spread corruption, and an entrenched leadership; it is hard to imagine that Russia’s economy will have an extended economic growth that will return it to being a great power. Its economic growth last year (2017) was 1.5%. Russia is currently the 11th or 12th richest country in the world. It is behind Canada. My seat-of-the-pants estimate is that Russia will still not be among the 10 richest countries in 2050.

For Russia to return to its old glory, it really sort of needs to re-constitute the Soviet Union or the old Russian Empire to some degree. Some would argue that this has indeed been part of Putin’s plan. I will examine this in a future post.

Demographics of Russia

I am far from an expert on demographics, but it something I do occasionally pay attention to. When it comes to measuring long-term military power and world influence, the basic measurement of power is wealth times population. Or, you can simply stack the countries up by GNP. This puts Russia 11th on the list, below Canada. But looking at Russia’s population alone is useful.

As of January 2018 the population of Russia is estimated at 146.9 million people. This does make it the 9th most populous country on the planet. This does include Crimea and Sevastopol, which has 2.4 million people.

The population of Russia was in steady decline from 1991 to 2013. Even in 2017 Russia was only producing 1.61 children per women. This is below the replacement rates of 2.1. The last time the Russian fertility rate was above 2 was in 1989 and that was only for 7 years. It was below 2 for most of the time before that going back to mid-1960s. Low child birth rates and small families rates seem to be very much a part of the culture. I know a lot of Russians that are only children.

Their population is growing ever so slowly due to immigration. For 2017 they had a net migration of 211,878, and a natural population loss of 135,818. This gave them population gains of 76,060, which is a very small annual gain (0.05% gain a year). In 2010, ethnic Russians made up 77% of the total population.

The population of Russia was 147.4 million in 1990, 148.7 million in 1991, and then it declined at a rate of 0.5% a year, dropped to 142.9 million in 2010 and has increased to 146.9 since then by immigration and seizure of Crimea and Sevastopol. In 2006 the Russian government started simplifying immigration laws, encouraging immigration of ethnic Russian from former Soviet republics. There is probably a limit to how many more people this can draw in. Russia also has about 7 million temporary migrant workers (these are 2011 figures). The Russian population tends to be older than most. The demographic “pyramid” is anything but pyramidal in shape.

As of 2018, the UN is still predicting that Russia’s population will fall to 132 million by 2050. See: https://esa.un.org/unpd/wup/Country-Profiles/

Now, lets compare the population of the Soviet Union/Russia to the United States over time:

                Soviet Union/Russia               United States

1951        182.3 million                             151.3 (1950)

1959        209.0                                        179.3 (1960)

1970        241.7                                        203.2

1977        257.7                                        226.5 (1980)

1982        270.0                                        226.5 (1980)

1990        290.9                                        248.7

1991        293.0                                        248.7 (1990)

2002       145.2 (Russia only)                   281.4 (2000)

2010       142.9                                         308.7

2018       146.9                                         328.3 (est.)


So, during the height of the “we will bury you” era the Soviet Union had a population of about 20% larger than the U.S. Russia now has a population less than half the U.S. (and a GDP of less than Canada). It appears that their population will not be growing very fast and may well continue to decline.

Another Look At The Role Of Russian Mercenaries In Syria

Russian businessman Yevgeny Prigozhin and Russian President Vladimir Putin. Prigozhin—who reportedly has ties to Putin, the Russian Ministry of Defense, and Russian mercenaries—was indicted by Special Counsel Robert Mueller on 16 February 2018 for allegedly funding and guiding a Russian government effort to interfere with the 2016 U.S. presidential election. [Alexei Druzhinin/AP]

As I recently detailed, many details remain unclear regarding the 7 February 2018 engagement in Deir Ezzor, Syria, between Russian mercenaries, Syrian government troops, and militia fighters and U.S. Special Operations Forces, U.S. Marines, and their partnered Kurdish and Syrian militia forces. Aside from questions as to just how many Russians participated and how many were killed, the biggest mystery is why the attack occurred at all.

Kimberly Marten, chair of the Political Science Department at Barnard College and director of the Program on U.S.-Russia Relations at Columbia University’s Harriman Institute, takes another look at this in a new article on War on the Rocks.

Why did Moscow initially deny any Russians’ involvement, and then downplay the casualty numbers? And why didn’t the Russian Defense Ministry stop the attackers from crossing into the American zone, or warn them about the likelihood of a U.S. counterstrike? Western media have offered two contending explanations: that Wagner acted without the Kremlin’s authorization, or that this was a Kremlin-approved attack that sought to test Washington while maintaining plausible deniability. But neither explanation fully answers all of the puzzles raised by the publicly available evidence, even though both help us understand more generally the opaque relationship between the Russian state and these forces.

After reviewing what is known about the relationship between the Russian government and the various Russian mercenary organizations, Marten proposes another explanation.

A different, or perhaps additional, rationale takes into account the ruthless infighting between Russian security forces that goes on regularly, while Russian President Vladimir Putin looks the other way. Russian Defense Ministry motives in Deir al-Zour may actually have centered on domestic politics inside Russia — and been directed against Putin ally and Wagner backer Yevgeny Prigozhin.

She takes a detailed look at the institutional relationships in question and draws a disquieting conclusion:

We may never have enough evidence to solve definitively the puzzles of Russian behavior at Deir al-Zour. But an understanding of Russian politics and security affairs allows us to better interpret the evidence we do have. Since Moscow’s employment of groups like Wagner appears to be a growing trend, U.S. and allied forces should consider the possibility that in various locations around the world, they might end up inadvertently, and dangerously, ensnared in Russia’s internal power struggles.

As with the Institute for the Study of War’s contention that the Russians are deliberately testing U.S. resolve in the Middle East, Marten’s interpretation that the actions of various Russian mercenary groups might be the result of internal Russian politics points to the prospect of further military adventurism only loosely connected to Russian foreign policy direction. Needless to say, the implications of this are ominous in a region of the world already beset by conflict and regional and international competition.

Urban Phase IV – Stalingrad

So in 2005 the Center for Army Analysis (CAA) decided to award us a contract to do Stalingrad based upon our recommendations at the end of the Phase III effort (see the previous post) and our proposal of dated 31 August 2004. We noted in our proposal that we had looked at 304 urban engagements and compared them to 319 non-urban engagements.

This is certainly the most comprehensive collection of urban combat data collected. Still, it is not definitive. In almost all cases, the defender is in a losing battle and is being enveloped. While this is the norm for urban warfare, one is left to wonder if the results for the first three phases of the analysis changes if the urban terrain is part of the front line and part of a set piece attack.

So we ended up proposing to create around 60 division-level urban engagements from the Battle of Stalingrad and compare them to 120 or more non-urban engagements from Kursk.

As we noted in our proposal “Assuming a contract award of 31 March 2005, The Dupuy Institute intends to complete the effort by the end of December 2005.”

Well, the contract was not awarded quite as quick as we liked. But it was in the government contracting office in August 2005, and fully funded. We had our Russian research team ready to go. They had access to the Soviet unit records. We had a staff of researchers in place (including me and Shawn). We had our German and Russian translators lined up. We were ready to start work in October 2005.

Then Hurricane Katrina hit New Orleans. It was 29 August 2005. In early September the tragedy was so significant and the U.S. rescue and recovery efforts were so overwhelmed, that the U.S. military was called in to help. No additional funding was provided for this, so the military had to pay for it from existing funds. The DOD then decided to fund the rescue effort by grabbing all non-essential funds from any contract not awarded, and this included ours. So come October 1st, instead of us starting work on a new contract, we discovered, on rather short notice, that it was no longer funded. Instead I had to hand out pink slips.


P.S. We later assembled most of the Russian unit records we needed for this project, but were never able to convince CAA to fund this fourth phase of our urban study effort.

Measuring the Effects of Combat in Cities, Phase III – part 3

Am 25.10.1941 konnte die faschistische deutsche Wehrmacht mit überlegenen Kräften Charkow, die Hauptstadt der Ukraine erobern.
UBz.: Panzer und Infanterie bei Strassenkämpfen in der Stadt

Description: Street fighting at Kharkov on 25 October 1941: infantry advancing covered by a StuG III assault gun and Sd.Kfz. 250 halftrack(Bundesarchiv Bild 183-L20582)

So, in our three phases of urban warfare study, taking place over three years, how much urban warfare did we examine? Well by count of engagements, we looked at 304 urban cases, division-level and battalion-level. Mostly what this means is one division or battalion-level engagement per day. Still, this is not insignificant.

We did assemble back in 2003 a listing of all the significant urban engagements we had identified since 1904. There are not all that common. We counted 117 of them in conventional combat between 1904 and 2003 (they are listed on pages 3-7 of the Phase III report). Of those 117, we had examined 22 of them (18.8 percent). We considered that 38 or so of them were major urban battles (division-level or larger). Of those, we examined 17 (44.7%). Only three of the remaining 21 major urban battles are known to have good data for both sides. The biggest remaining untapped source of data was the Battle of Stalingrad, which could yield over a hundred division-level engagements. This led us to make four points (page 10-11 of the report):

We suggest that there remain a number of ways in which we can broaden and deepen or knowledge of the effects of urban warfare.

  1. Conduct a detailed study of the Battle of Stalingrad. Stalingrad may also represent one of the most intense examples of urban combat, so may provide some clues to the causes of the urban outliers.
  2. Conduct a detailed study of battalion/brigade-level urban combat. This would begin with an analysis of battalion-level actions from the first two phases of this study (European Theater of Operations and Eastern Front), added to the battalion-level actions completed in this third phase of the study. Additional battalion-level engagements would be added as needed.
  3. Conduct a detailed study of the outliers in an attempt to discover the causes for the atypical nature of these urban battles.
  4. Conduct a detailed study of urban warfare in an unconventional warfare setting.

Anyhow, it was clear that our next step was Stalingrad. You will also note that in 2003/2004 we were also suggesting we study urban warfare in an unconventional warfare setting. This suggestion seemed to get no attention.


Measuring the Effects of Combat in Cities, Phase III – part 2

U.S. Army troops in Hue, South Vietnam monitor the streets below during the Tet Offensive, 1968. [Bettmann/CORBIS]

Another part of our Phase III effort was to look at post-World War II cases. This is, by its nature, invariably one-sided data. Maybe at some point we will get the Chinese, North Koreans, Vietnamese, Syrians, etc. to open up their archives to us researchers, but, except for possibly Vietnam, I don’t think that is going to happen any time in the near future. So, we ended up building our post-World War II cases primarily from U.S. data.

We added 10 engagements from the Inchon/Seoul operation in 1950. For Vietnam we added  65 division-level urban engagements from the Tet Offensive in 1968 and 57 division-level non-urban engagements. We also added 56 battalion-level urban engagements from the Tet Offensive (all in Hue). We had 14 division-level urban engagements and 65 division-level non-urban engagements from various contingencies and conventional operations from 1944 to 2003. This included ELAS Insurgency, Arab-Isreali Wars, Panama, Mogadishu, the 1991 Gulf War and Baghdad in 2003. We also added 9 battalion-level urban cases, mostly from Beirut 1982-1984.

To add it all up this was:

                                                 Urban       Non-urban

Phase I (ETO)                              46              91

Phase II (Kharkov/Kursk)             51              65

Phase III (Manila/PTO)                53              41

Post-WWII – Division-level           89            123

Post-WWII – Battalion-level          65               0

                                                   ——-         ——

Total cases                                 304           319

This is a lot of cases for comparisons.

Just to show how they match up (from page 28 of the report):

Attackers in Division-Level Engagements:

Urban

PTO Kor Tet Oth ETO EF (Ger Atk) EF (Sov Atk)
Avg Str/day 12,099 28,304 6,294 10,903 34,601 17,080 17,001
Avg Cas 78 30 94 254 178 86 371
Avg Cas/day 78 30 39 59 169 86 371
Avg % Loss/day 0.63 0.71 0.78 0.56 0.50 0.49 1.95
Wgt % Loss/day 0.65 0.71 0.62 0.54 0.49 0.50 2.18


Non-urban

PTO Tet Oth ETO EF (Ger Atk) EF (Sov Atk)
Avg Str/day 17,445 13,232 18,991 21,060 27,083 27,044
Avg Cas 663 44 377 469 276 761
Avg Cas/day 221 22 191 237 206 653
Avg % Loss/day 0.83 0.19 1.56 1.09 1.00 2.39
Wgt % Loss/day 1.27 0.17 1.01 1.13 0.76 2.41

I will pick up more on the Phase III effort in a subsequent posting (a part 3 to this series). These charts are also on page 238 of War by Numbers.


P.S. The blog the image was taken from (it is a collection of pictures taken from the fighting in Hue): https://vulep-photo.blogspot.com/2013/01/hue-1968-tet-mau-than_3410.html