Category Research & Analysis

Historians and the Early Era of U.S. Army Operations Research

While perusing Charles Shrader’s fascinating history of the U.S. Army’s experience with operations research (OR), I came across several references to the part played by historians and historical analysis in early era of that effort.

The ground forces were the last branch of the Army to incorporate OR into their efforts during World War II, lagging behind the Army Air Forces, the technical services, and the Navy. Where the Army was a step ahead, however, was in creating a robust wartime historical field history documentation program. (After the war, this enabled the publication of the U.S. Army in World War II series, known as the “Green Books,” which set a new standard for government sponsored military histories.)

As Shrader related, the first OR personnel the Army deployed forward in 1944-45 often crossed paths with War Department General Staff Historical Branch field historian detachments. They both engaged in similar activities: collecting data on real-world combat operations, which was then analyzed and used for studies and reports written for the use of the commands to which they were assigned. The only significant difference was in their respective methodologies, with the historians using historical methods and the OR analysts using mathematical and scientific tools.

History and OR after World War II

The usefulness of historical approaches to collecting operational data did not go unnoticed by the OR practitioners, according to Shrader. When the Army established the Operations Research Office (ORO) in 1948, it hired a contingent of historians specifically for the purpose of facilitating research and analysis using WWII Army records, “the most likely source for data on operational matters.”

When the Korean War broke out in 1950, ORO sent eight multi-disciplinary teams, including the historians, to collect operational data and provide analytical support for U.S. By 1953, half of ORO’s personnel had spent time in combat zones. Throughout the 1950s, about 40-43% of ORO’s staff was comprised of specialists in the social sciences, history, business, literature, and law. Shrader quoted one leading ORO analyst as noting that, “there is reason to believe that the lawyer, social scientist or historian is better equipped professionally to evaluate evidence which is derived from the mind and experience of the human species.”

Among the notable historians who worked at or with ORO was Dr. Hugh M. Cole, an Army officer who had served as a staff historian for General George Patton during World War II. Cole rose to become a senior manager at ORO and later served as vice-president and president of ORO’s successor, the Research Analysis Corporation (RAC). Cole brought in WWII colleague Forrest C. Pogue (best known as the biographer of General George C. Marshall) and Charles B. MacDonald. ORO also employed another WWII field historian, the controversial S. L. A. Marshall, as a consultant during the Korean War. Dorothy Kneeland Clark did pioneering historical analysis on combat phenomena while at ORO.

The Demise of ORO…and Historical Combat Analysis?

By the late 1950s, considerable institutional friction had developed between ORO, the Johns Hopkins University (JHU)—ORO’s institutional owner—and the Army. According to Shrader,

Continued distrust of operations analysts by Army personnel, questions about the timeliness and focus of ORO studies, the ever-expanding scope of ORO interests, and, above all, [ORO director] Ellis Johnson’s irascible personality caused tensions that led in August 1961 to the cancellation of the Army’s contract with JHU and the replacement of ORO with a new, independent research organization, the Research Analysis Corporation [RAC].

RAC inherited ORO’s research agenda and most of its personnel, but changing events and circumstances led Army OR to shift its priorities away from field collection and empirical research on operational combat data in favor of the use of modeling and wargaming in its analyses. As Chris Lawrence described in his history of federally-funded Defense Department “think tanks,” the rise and fall of scientific management in DOD, the Vietnam War, social and congressional criticism, and an unhappiness by the military services with the analysis led to retrenchment in military OR by the end of the 60s. The Army sold RAC and created its own in-house Concepts Analysis Agency (CAA; now known as the Center for Army Analysis).

By the early 1970s, analysts, such as RAND’s Martin Shubik and Gary Brewer, and John Stockfisch, began to note that the relationships and processes being modeled in the Army’s combat simulations were not based on real-world data and that empirical research on combat phenomena by the Army OR community had languished. In 1991, Paul Davis and Donald Blumenthal gave this problem a name: the “Base of Sand.”

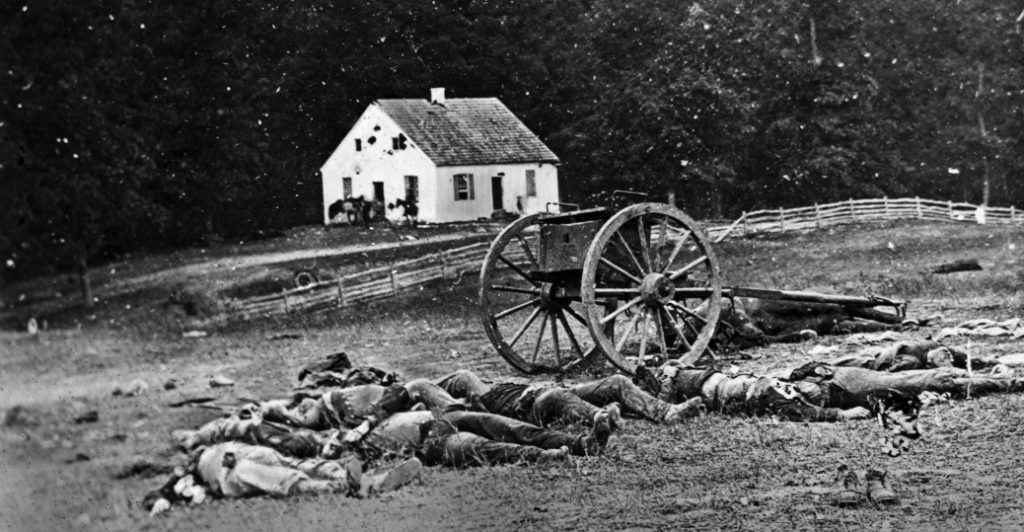
How Many Confederates Fought At Antietam?

Dead soldiers lying near the Dunker Church on the Antietam battlefield. [History.com]

Numbers matter in war and warfare. Armies cannot function effectively without reliable counts of manpower, weapons, supplies, and losses. Wars, campaigns, and battles are waged or avoided based on assessments of relative numerical strength. Possessing superior numbers, either overall or at the decisive point, is a commonly held axiom (if not a guarantor) for success in warfare.

These numbers of war likewise inform the judgements of historians. They play a large role in shaping historical understanding of who won or lost, and why. Armies and leaders possessing a numerical advantage are expected to succeed, and thus come under exacting scrutiny when they do not. Commanders and combatants who win in spite of inferiorities in numbers are lauded as geniuses or elite fighters.

Given the importance of numbers in war and history, however, it is surprising to see how often historians treat quantitative data carelessly. All too often, for example, historical estimates of troop strength are presented uncritically and often rounded off, apparently for simplicity’s sake. Otherwise careful scholars are not immune from the casual or sloppy use of numbers.

However, just as careless treatment of qualitative historical evidence results in bad history, the same goes for mishandling quantitative data. To be sure, like any historical evidence, quantitative data can be imprecise or simply inaccurate. Thus, as with any historical evidence, it is incumbent upon historians to analyze the numbers they use with methodological rigor.

OK, with that bit of throat-clearing out of the way, let me now proceed to jump into one of the greatest quantitative morasses in military historiography: strengths and losses in the American Civil War. Participants, pundits, and scholars have been arguing endlessly over numbers since before the war ended. And since nothing seems to get folks riled up more than debating Civil War numbers than arguing about the merits (or lack thereof) of Union General George B. McClellan, I am eventually going to add him to the mix as well.

The reason I am grabbing these dual lightning rods is to illustrate the challenges of quantitative data and historical analysis by looking at one of Trevor Dupuy’s favorite historical case studies, the Battle of Antietam (or Sharpsburg, for the unreconstructed rebels lurking out there). Dupuy cited his analysis of the battle in several of his books, mainly as a way of walking readers through his Quantified Judgement Method of Analysis (QJMA), and to demonstrate his concept of combat multipliers.

I have questions about his Antietam analysis that I will address later. To begin, however, I want to look at the force strength numbers he used. On p. 156 of Numbers, Predictions and War, he provided the following figures for the opposing armies at Antietam:The sources he cited for these figures were R. Ernest Dupuy and Trevor N. Dupuy, The Compact History of the Civil War (New York: Hawthorn, 1960) and Thomas L. Livermore, Numbers and Losses of the Civil War (reprint, Bloomington: University of Indiana, 1957).

It is with Livermore that I will begin tracing the historical and historiographical mystery of how many Confederates fought at the Battle of Antietam.

The 3-to-1 Rule in Recent History Books

This seems to be the rule that never goes away. I have a recent a case of it being used in a history book. The book was published in English in 2017 (and in German in 2007). In discussing the preparation for the Battle of Kursk in 1943 the author states that:

A military rule of thumb says an attacker should have a superiority of 3 to 1 in order to have a chance of success. While this vague principal applies only at tactical level, the superiority could be even greater if the defender is entrenched behind fortifications. Given the Kursk salient’s fortress-like defences, that was precisely the case.

This was drawn from Germany and the Second World War, Volume VIII: The Eastern Front 1943-1944: The War in the East and on the Neighboring Fronts, page 86. This section was written by Karl-Heinz Frieser.

This version of the rule now says that you have to have a superiority of 3-to-1 in order to have a chance of success? We have done a little analysis of force ratios compared to outcome. See Chapter 2: Force Ratios (pages 8-13) in War by Numbers. I never heard the caveat in the second sentence that the “principal applies only at tactical level.”

This rule has been discussed by me in previous blog posts. Dr. Frieser made a similar claim in his book The Blitzkrieg Legend:

The 3-to-1 Rule in Histories

These books were written by a German author who was an officer in the Bundeswehr, so apparently this rule of thumb has spread to some of our NATO allies, or maybe it started in Germany. We really don’t know where this rule of thumb first came from. It ain’t from Clausewitz.

Questioning The Validity Of The 3-1 Rule Of Combat

Canadian soldiers going “over the top” during an assault in the First World War. [History.com]
[This post was originally published on 1 December 2017.]

How many troops are needed to successfully attack or defend on the battlefield? There is a long-standing rule of thumb that holds that an attacker requires a 3-1 preponderance over a defender in combat in order to win. The aphorism is so widely accepted that few have questioned whether it is actually true or not.

Trevor Dupuy challenged the validity of the 3-1 rule on empirical grounds. He could find no historical substantiation to support it. In fact, his research on the question of force ratios suggested that there was a limit to the value of numerical preponderance on the battlefield.

TDI President Chris Lawrence has also challenged the 3-1 rule in his own work on the subject.

The validity of the 3-1 rule is no mere academic question. It underpins a great deal of U.S. military policy and warfighting doctrine. Yet, the only time the matter was seriously debated was in the 1980s with reference to the problem of defending Western Europe against the threat of Soviet military invasion.

It is probably long past due to seriously challenge the validity and usefulness of the 3-1 rule again.

Are There Only Three Ways of Assessing Military Power?

military-power[This article was originally posted on 11 October 2016]
In 2004, military analyst and academic Stephen Biddle published Military Power: Explaining Victory and Defeat in Modern Battle, a book that addressed the fundamental question of what causes victory and defeat in battle. Biddle took to task the study of the conduct of war, which he asserted was based on “a weak foundation” of empirical knowledge. He surveyed the existing literature on the topic and determined that the plethora of theories of military success or failure fell into one of three analytical categories: numerical preponderance, technological superiority, or force employment.

Numerical preponderance theories explain victory or defeat in terms of material advantage, with the winners possessing greater numbers of troops, populations, economic production, or financial expenditures. Many of these involve gross comparisons of numbers, but some of the more sophisticated analyses involve calculations of force density, force-to-space ratios, or measurements of quality-adjusted “combat power.” Notions of threshold “rules of thumb,” such as the 3-1 rule, arise from this. These sorts of measurements form the basis for many theories of power in the study of international relations.

The next most influential means of assessment, according to Biddle, involve views on the primacy of technology. One school, systemic technology theory, looks at how technological advances shift balances within the international system. The best example of this is how the introduction of machine guns in the late 19th century shifted the advantage in combat to the defender, and the development of the tank in the early 20th century shifted it back to the attacker. Such measures are influential in international relations and political science scholarship.

The other school of technological determinacy is dyadic technology theory, which looks at relative advantages between states regardless of posture. This usually involves detailed comparisons of specific weapons systems, tanks, aircraft, infantry weapons, ships, missiles, etc., with the edge going to the more sophisticated and capable technology. The use of Lanchester theory in operations research and combat modeling is rooted in this thinking.

Biddle identified the third category of assessment as subjective assessments of force employment based on non-material factors including tactics, doctrine, skill, experience, morale or leadership. Analyses on these lines are the stock-in-trade of military staff work, military historians, and strategic studies scholars. However, international relations theorists largely ignore force employment and operations research combat modelers tend to treat it as a constant or omit it because they believe its effects cannot be measured.

The common weakness of all of these approaches, Biddle argued, is that “there are differing views, each intuitively plausible but none of which can be considered empirically proven.” For example, no one has yet been able to find empirical support substantiating the validity of the 3-1 rule or Lanchester theory. Biddle notes that the track record for predictions based on force employment analyses has also been “poor.” (To be fair, the problem of testing theory to see if applies to the real world is not limited to assessments of military power, it afflicts security and strategic studies generally.)

So, is Biddle correct? Are there only three ways to assess military outcomes? Are they valid? Can we do better?

The (Missing) Urban Warfare Study

[This post was originally published on 13 December 2017]

And then…..we discovered the existence of a significant missing study that we wanted to see.

Around 2000, the Center for Army Analysis (CAA) contracted The Dupuy Institute to conduct an analysis of how to represent urban warfare in combat models. This was the first work we had ever done on urban warfare, so…….we first started our literature search. While there was a lot of impressionistic stuff gathered from reading about Stalingrad and watching field exercises, there was little hard data or analysis. Simply no one had ever done any analysis of the nature of urban warfare.

But, on the board of directors of The Dupuy Institute was a grand old gentleman called John Kettelle. He had previously been the president of Ketron, an operations research company that he had founded. Kettelle had been around the business for a while, having been an office mate of Kimball, of Morse and Kimbell fame (the people who wrote the original U.S. Operations Research “textbook” in 1951: Methods of Operations Research). He is here: https://www.adventfuneral.com/services/john-dunster-kettelle-jr.htm?wpmp_switcher=mobile

John had mentioned several times a massive study on urban warfare that he had done  for the U.S. Army in the 1970s. He had mentioned details of it, including that it was worked on by his staff over the course of several years, consisted of several volumes, looked into operations in Stalingrad, was pretty extensive and exhaustive, and had a civil disturbance component to it that he claimed was there at the request of the Nixon White House. John Kettelle sold off his company Ketron in the 1990s and was now semi-retired.

So, I asked John Kettelle where his study was. He said he did not know. He called over to the surviving elements of Ketron and they did not have a copy. Apparently significant parts of the study were classified. In our review of the urban warfare literature around 2000 we found no mention of the study or indications that anyone had seen or drawn any references from it.

This was probably the first extensive study ever done on urban warfare. It employed at least a half-dozen people for multiple years. Clearly the U.S. Army spent several million of our hard earned tax dollars on it…..yet is was not being used and could not be found. It was not listed in DTIC, NTIS, on the web, nor was it in Ketron’s files, and John Kettelle did not have a copy of it. It was lost !!!

So, we proceeded with our urban warfare studies independent of past research and ended up doing three reports on the subject. Theses studies are discussed in two chapters of my book War by Numbers.

All three studies are listed in our report list: http://www.dupuyinstitute.org/tdipub3.htm

The first one is available on line at:  http://www.dupuyinstitute.org/pdf/urbanwar.pdf

As the Ketron urban warfare study was classified, there were probably copies of it in classified U.S. Army command files in the 1970s. If these files have been properly retired then these classified files may exist in the archives. At some point, they may be declassified. At some point the study may be re-discovered. But……the U.S. Army after spending millions for this study, preceded to obtain no benefit from the study in the late 1990s, when a lot of people re-opened the issue of urban warfare. This would have certainly been a useful study, especially as much of what the Army, RAND and others were discussing at the time was not based upon hard data and was often dead wrong.

This may be a case of the U.S. Army having to re-invent the wheel because it has not done a good job of protecting and disseminating its studies and analysis. This seems to particularly be a problem with studies that were done by contractors that have gone out of business. Keep in mind, we were doing our urban warfare work for the Center for Army Analysis. As a minimum, they should have had a copy of it.

My Response To My 1997 Article

Shawn likes to post up on the blog old articles from The International TNDM Newsletter. The previous blog post was one such article I wrote in 1997 (he posted it under my name…although he put together the post). This is the first time I have read it since say….1997. A few comments:

  1. In fact, we did go back in systematically review and correct all the Italian engagements. This was primarily done by Richard Anderson from German records and UK records. All the UK engagements were revised as were many of the other Italian Campaign records. In fact, we ended up revising at least half of the WWII engagements in the Land Warfare Data Base (LWDB).
  2. We did greatly expand our collection of data, to over 1,200 engagements, including 752 in a division-level engagement database. Basically we doubled the size of the database (and placed it in Access).
  3. Using this more powerful data collection, I then re-shot the analysis of combat effectiveness. I did not use any modeling structure, but simply just used basic statistics. This effort again showed a performance difference in combat in Italy between the Germans, the Americans and the British. This is discussed in War by Numbers, pages 19-31.
  4. We did actually re-validate the TNDM. The results of this validation are published in War by Numbers, pages 299-324. They were separately validated at corps-level (WWII), division-level (WWII) and at Battalion-level (WWI, WWII and post-WWII).
  5. War by Numbers also includes a detailed discussion of differences in casualty reporting between nations (pages 202-205) and between services (pages 193-202).
  6. We have never done an analysis of the value of terrain using our larger more robust databases, although this is on my short-list of things to do. This is expected to be part of War by Numbers II, if I get around to writing it.
  7. We have done no significant re-design of the TNDM.

Anyhow, that is some of what we have been doing in the intervening 20 years since I wrote that article.

The Third World War of 1985

Hackett

[This article was originally posted on 5 August 2016]

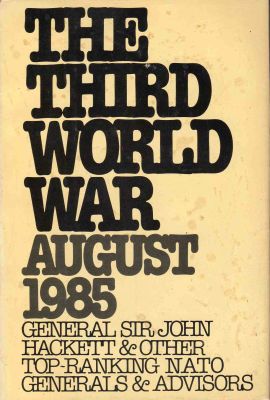
The seeming military resurgence of Vladimir Putin’s Russia has renewed concerns about the military balance between East and West in Europe. These concerns have evoked memories of the decades-long Cold War confrontation between NATO and the Warsaw Pact along the inner-German frontier. One of the most popular expressions of this conflict came in the form of a book titled The Third World War: August 1985, by British General Sir John Hackett. The book, a hypothetical account of a war between the Soviet Union, the United States, and assorted allies set in the near future, became an international best-seller.

Jeffrey H Michaels, a Senior Lecturer in Defence Studies at the British the Joint Services Command and Staff College, has published a detailed look at how Hackett and several senior NATO and diplomatic colleagues constructed the scenario portrayed in the book. Scenario construction is an important aspect of institutional war gaming. A war game will only be as useful if the assumptions that underpin it are valid. As Michaels points out,

Regrettably, far too many scenarios and models, whether developed by military organizations, political scientists, or fiction writers, tend to focus their attention on the battlefield and the clash of armies, navies, air forces, and especially their weapons systems.  By contrast, the broader context of the war – the reasons why hostilities erupted, the political and military objectives, the limits placed on military action, and so on – are given much less serious attention, often because they are viewed by the script-writers as a distraction from the main activity that occurs on the battlefield.

Modelers and war gamers always need to keep in mind the fundamental importance of context in designing their simulations.

It is quite easy to project how one weapon system might fare against another, but taken out of a broader strategic context, such a projection is practically meaningless (apart from its marketing value), or worse, misleading.  In this sense, even if less entertaining or exciting, the degree of realism of the political aspects of the scenario, particularly policymakers’ rationality and cost-benefit calculus, and the key decisions that are taken about going to war, the objectives being sought, the limits placed on military action, and the willingness to incur the risks of escalation, should receive more critical attention than the purely battlefield dimensions of the future conflict.

These are crucially important points to consider when deciding how to asses the outcomes of hypothetical scenarios.

What Is A Breakpoint?

French retreat from Russia in 1812 by Illarion Mikhailovich Pryanishnikov (1812) [Wikipedia]

After discussing with Chris the series of recent posts on the subject of breakpoints, it seemed appropriate to provide a better definition of exactly what a breakpoint is.

Dorothy Kneeland Clark was the first to define the notion of a breakpoint in her study, Casualties as a Measure of the Loss of Combat Effectiveness of an Infantry Battalion (Operations Research Office, The Johns Hopkins University: Baltimore, 1954). She found it was not quite as clear-cut as it seemed and the working definition she arrived at was based on discussions and the specific combat outcomes she found in her data set [pp 9-12].

DETERMINATION OF BREAKPOINT

The following definitions were developed out of many discussions. A unit is considered to have lost its combat effectiveness when it is unable to carry out its mission. The onset of this inability constitutes a breakpoint. A unit’s mission is the objective assigned in the current operations order or any other instructional directive, written or verbal. The objective may be, for example, to attack in order to take certain positions, or to defend certain positions. 

How does one determine when a unit is unable to carry out its mission? The obvious indication is a change in operational directive: the unit is ordered to stop short of its original goal, to hold instead of attack, to withdraw instead of hold. But one or more extraneous elements may cause the issue of such orders: 

(1) Some other unit taking part in the operation may have lost its combat effectiveness, and its predicament may force changes, in the tactical plan. For example the inability of one infantry battalion to take a hill may require that the two adjoining battalions be stopped to prevent exposing their flanks by advancing beyond it. 

(2) A unit may have been assigned an objective on the basis of a G-2 estimate of enemy weakness which, as the action proceeds, proves to have been over-optimistic. The operations plan may, therefore, be revised before the unit has carried out its orders to the point of losing combat effectiveness. 

(3) The commanding officer, for reasons quite apart from the tactical attrition, may change his operations plan. For instance, General Ridgway in May 1951 was obliged to cancel his plans for a major offensive north of the 38th parallel in Korea in obedience to top level orders dictated by political considerations. 

(4) Even if the supposed combat effectiveness of the unit is the determining factor in the issuance of a revised operations order, a serious difficulty in evaluating the situation remains. The commanding officer’s decision is necessarily made on the basis of information available to him plus his estimate of his unit’s capacities. Either or both of these bases may be faulty. The order may belatedly recognize a collapse which has in factor occurred hours earlier, or a commanding officer may withdraw a unit which could hold for a much longer time. 

It was usually not hard to discover when changes in orders resulted from conditions such as the first three listed above, but it proved extremely difficult to distinguish between revised orders based on a correct appraisal of the unit’s combat effectiveness and those issued in error. It was concluded that the formal order for a change in mission cannot be taken as a definitive indication of the breakpoint of a unit. It seemed necessary to go one step farther and search the records to learn what a given battalion did regardless of provisions in formal orders… 

CATEGORIES OF BREAKPOINTS SELECTED 

In the engagements studied the following categories of breakpoint were finally selected: 

Category of Breakpoint 

No. Analyzed 

I. Attack [Symbol] rapid reorganization [Symbol] attack 

9 

II. Attack [Symbol] defense (no longer able to attack without a few days of recuperation and reinforcement 

21 

III. Defense [Symbol] withdrawal by order to a secondary line 

13 

IV. Defense [Symbol] collapse 

5 

Disorganization and panic were taken as unquestionable evidence of loss of combat effectiveness. It appeared, however, that there were distinct degrees of magnitude in these experiences. In addition to the expected breakpoints at attack [Symbol] defense and defense [Symbol] collapse, a further category, I, seemed to be indicated to include situations in which an attacking battalion was ‘pinned down” or forced to withdraw in partial disorder but was able to reorganize in 4 to 24 hours and continue attacking successfully. 

Category II includes (a) situations in which an attacking battalion was ordered into the defensive after severe fighting or temporary panic; (b) situations in which a battalion, after attacking successfully, failed to gain ground although still attempting to advance and was finally ordered into defense, the breakpoint being taken as occurring at the end of successful advance. In other words, the evident inability of the unit to fulfill its mission was used as the criterion for the breakpoint whether orders did or did not recognize its inability. Battalions after experiencing such a breakpoint might be able to recuperate in a few days to the point of renewing successful attack or might be able to continue for some time in defense. 

The sample of breakpoints coming under category IV, defense [Symbol] collapse, proved to be very small (5) and unduly weighted in that four of the examples came from the same engagement. It was, therefore, discarded as probably not representative of the universe of category IV breakpoints,* and another category (III) was added: situations in which battalions on the defense were ordered withdrawn to a quieter sector. Because only those instances were included in which the withdrawal orders appeared to have been dictated by the condition of the unit itself, it is believed that casualty levels for this category can be regarded as but slightly lower than those associated with defense [Symbol] collapse. 

In both categories II and III, “‘defense” represents an active situation in which the enemy is attacking aggressively. 

* It had been expected that breakpoints in this category would be associated with very high losses. Such did not prove to be the case. In whatever way the data were approached, most of the casualty averages were only slightly higher than those associated with category II (attack [Symbol] defense), although the spread in data was wider. It is believed that factors other than casualties, such as bad weather, difficult terrain, and heavy enemy artillery fire undoubtedly played major roles in bringing about the collapse in the four units taking part in the same engagement. Furthermore, the casualty figures for the four units themselves is in question because, as the situation deteriorated, many of the men developed severe cases of trench foot and combat exhaustion, but were not evacuated, as they would have been in a less desperate situation, and did not appear in the casualty records until they had made their way to the rear after their units had collapsed.

In 1987-1988, Trevor Dupuy and colleagues at Data Memory Systems, Inc. (DMSi), Janice Fain, Rich Anderson, Gay Hammerman, and Chuck Hawkins sought to create a broader, more generally applicable definition for breakpoints for the study, Forced Changes of Combat Posture (DMSi, Fairfax, VA, 1988) [pp. I-2-3]

The combat posture of a military force is the immediate intention of its commander and troops toward the opposing enemy force, together with the preparations and deployment to carry out that intention. The chief combat postures are attack, defend, delay, and withdraw.

A change in combat posture (or posture change) is a shift from one posture to another, as, for example, from defend to attack or defend to withdraw. A posture change can be either voluntary or forced. 

A forced posture change (FPC) is a change in combat posture by a military unit that is brought about, directly or indirectly, by enemy action. Forced posture changes are characteristically and almost always changes to a less aggressive posture. The most usual FPCs are from attack to defend and from defend to withdraw (or retrograde movement). A change from withdraw to combat ineffectiveness is also possible. 

Breakpoint is a term sometimes used as synonymous with forced posture change, and sometimes used to mean the collapse of a unit into ineffectiveness or rout. The latter meaning is probably more common in general usage, while forced posture change is the more precise term for the subject of this study. However, for brevity and convenience, and because this study has been known informally since its inception as the “Breakpoints” study, the term breakpoint is sometimes used in this report. When it is used, it is synonymous with forced posture change.

Hopefully this will help clarify the previous discussions of breakpoints on the blog.

U.S. Army Force Ratios

People do send me some damn interesting stuff. Someone just sent me a page clipped from U.S. Army FM 3-0 Operations, dated 6 October 2017. There is a discussion in Chapter 7 on “penetration.” This brief discussion on paragraph 7-115 states in part:

7-115. A penetration is a form of maneuver in which an attacking force seeks to rupture enemy defenses on a narrow front to disrupt the defensive system (FM 3-90-1) ….The First U.S. Army’s Operation Cobra (the breakout from the Normandy lodgment in July 1944) is a classic example of a penetration. Figure 7-10 illustrates potential correlation of forces or combat power for a penetration…..”

This is figure 7-10:

So:

  1. Corps shaping operations: 3:1
  2. Corps decisive operations: 9-1
    1. Lead battalion: 18-1

Now, in contrast, let me pull some material from War by Numbers:

From page 10:

European Theater of Operations (ETO) Data, 1944


Force Ratio                       Result                          Percent Failure   Number of cases

0.55 to 1.01-to-1.00            Attack Fails                          100%                     5

1.15 to 1.88-to-1.00            Attack usually succeeds        21%                   48

1.95 to 2.56-to-1.00            Attack usually succeeds        10%                   21

2.71-to-1.00 and higher      Attacker Advances                   0%                   42


Note that these are division-level engagements. I guess I could assemble the same data for corps-level engagements, but I don’t think it would look much different.

From page 210:

Force Ratio…………Cases……Terrain…….Result

1.18 to 1.29 to 1        4             Nonurban   Defender penetrated

1.51 to 1.64               3             Nonurban   Defender penetrated

2.01 to 2.64               2             Nonurban   Defender penetrated

3.03 to 4.28               2             Nonurban   Defender penetrated

4.16 to 4.78               2             Urban         Defender penetrated

6.98 to 8.20               2             Nonurban   Defender penetrated

6.46 to 11.96 to 1      2             Urban         Defender penetrated


These are also division-level engagements from the ETO. One will note that out of 17 cases where the defender was penetrated, only once was the force ratio as high as 9 to 1. The mean force ratio for these 17 cases is 3.77 and the median force ratio is 2.64.

Now the other relevant tables in this book are in Chapter 8: Outcome of Battles (page 60-71). There I have a set of tables looking at the loss rates based upon one of six outcomes. Outcome V is defender penetrated. Unfortunately, as the purpose of the project was to determine prisoner of war capture rates, we did not bother to calculate the average force ratio for each outcome. But, knowing the database well, the average force ratio for defender penetrated results may be less than 3-to-1 and is certainly is less than 9-to-1. Maybe I will take few days at some point and put together a force ratio by outcome table.

Now, the source of FM 3.0 data is not known to us and is not referenced in the manual. Why they don’t provide such a reference is a mystery to me, as I can point out several examples of this being an issue. On more than one occasion data has appeared in Army manuals that we can neither confirm or check, and which we could never find the source for. But…it is not referenced. I have not looked at the operation in depth, but don’t doubt that at some point during Cobra they had a 9:1 force ratio and achieved a penetration. But…..this is different than leaving the impression that a 9:1 force ratio is needed to achieve a penetration. I do not know it that was the author’s intent, but it is something that the casual reader might infer. This probably needs to be clarified.