Bye.
The Dupuy Institute
Excellence in Historical Research and Analysis
The Dupuy Institute
Excellence in Historical Research and Analysis
Category National Security Policy
U.S. Army Multi-Domain Operations Concept Continues Evolving

The U.S. Army Training and Doctrine Command (TRADOC) released draft version 1.5 of its evolving Multi-Domain Operations (MDO) future operating concept last week. Entitled TRADOC Pamphlet 525-3-1, “The U.S. Army in Multi-Domain Operations 2028,” this iteration updates the initial Multi-Domain Battle (MDB) concept issued in October 2017.
According to U.S. Army Chief of Staff (and Chairman of the Joint Chiefs of Staff nominee) General Mark Milley, MDO Concept 1.5 is the first step in the doctrinal evolution. “It describes how U.S. Army forces, as part of the Joint Force, will militarily compete, penetrate, dis-integrate, and exploit our adversaries in the future.”
TRADOC Commander General Stuart Townsend summarized the draft concept thusly:
The U.S. Army in Multi-Domain Operations 2028 concept proposes a series of solutions to solve the problem of layered standoff. The central idea in solving this problem is the rapid and continuous integration of all domains of warfare to deter and prevail as we compete short of armed conflict. If deterrence fails, Army formations, operating as part of the Joint Force, penetrate and dis-integrate enemy anti-access and area denial systems;exploit the resulting freedom of maneuver to defeat enemy systems, formations and objectives and to achieve our own strategic objectives; and consolidate gains to force a return to competition on terms more favorable to the U.S., our allies and partners.
To achieve this, the Army must evolve our force, and our operations, around three core tenets. Calibrated force posture combines position and the ability to maneuver across strategic distances. Multi-domain formations possess the capacity, endurance and capability to access and employ capabilities across all domains to pose multiple and compounding dilemmas on the adversary. Convergence achieves the rapid and continuous integration of all domains across time, space and capabilities to overmatch the enemy. Underpinning these tenets are mission command and disciplined initiative at all warfighting echelons. (original emphasis)
For a look at the evolution of the Army and U.S. Marine Corps doctrinal thinking about multi-domain warfare since early 2017:
Army And Marine Corps Join Forces To Define Multi-Domain Battle Concept
U.S. Army Updates Draft Multi-Domain Battle Operating Concept
What Does Lethality Mean In Warfare?
 In an insightful essay over at The Strategy Bridge, “Lethality: An Inquiry,” Marine Corps officer Olivia Gerard accomplishes one of the most important, yet most often overlooked, aspects of successfully thinking about and planning for war: questioning a basic assumption. She achieves this by posing a simple question: “What is lethality?”
Gerard notes that the current U.S. National Defense Strategy is predicated on lethality; as it states: “A more lethal, resilient, and rapidly innovating Joint Force, combined with a robust constellation of allies and partners, will sustain American influence and ensure favorable balances of power that safeguard the free and open international order.” She also identifies the linkage in the strategy between lethality and deterrence via a supporting statement from Deputy Secretary of Defense Patrick Shanahan: “Everything we do is geared toward one goal: maximizing lethality. A lethal force is the strongest deterrent to war.”
After pointing out that the strategy does not define the concept of lethality, Gerard responds to Shanahan’s statement by asking “why?”
She uses this as a jumping off point to examine the meaning of lethality in warfare. Starting from the traditional understanding of lethality as a tactical concept, Gerard walks through the way it has been understood historically. From this, she formulates a construct for understanding the relationship between lethality and strategy:
Organizational lethality emerges from tactical lethality that is institutionally codified. Tactical lethality is nested within organizational lethality, which is nested within strategic lethality. Plugging these terms into an implicit calculus, we can rewrite strategic lethality as the efficacy with which we can form intentional deadly relationships towards targets that can be actualized towards political ends.
To this, Gerard appends two interesting caveats: “Notice first that the organizational component becomes implicit. What remains outside, however, is the intention–a meta-intention–to form these potential deadly relationships in the first place.”
It is the second of these caveats—the intent to connect lethality to a strategic end—that informs Gerard’s conclusion. While the National Defense Strategy does not define the term, she observes that by explicitly leveraging the threat to use lethality to bolster deterrence, it supplies the necessary credibility needed to make deterrence viable. “Proclaiming lethality a core tenet, especially in a public strategic document, is the communication of the threat.”
Gerard’s exploration of lethality and her proposed framework for understanding it provide a very useful way of thinking about the way it relates to warfare. It is definitely worth your time to read.
What might be just as interesting, however, are the caveats to her construct because they encompass a lot of what is problematic about the way the U.S. military thinks—explicitly and implicitly—about tactical lethality and how it is codified into concepts of organizational lethality. (While I have touched on some of those already, Gerard gives more to reflect on. More on that later.)
Gerard also references the definition of lethality Trevor Dupuy developed for his 1964 study of historical trends in weapon lethality. While noting that his definition was too narrow for the purposes of her inquiry, the historical relationship between lethality, casualties, and dispersion on the battlefield Dupuy found in that study formed the basis for his subsequent theories of warfare and models of combat. (I will write more about those in the future as well.)
Population over Time (US vs USSR)
Over last decades, the population of major countries like China, India, Soviet Union/ Russia, Japan, Germany and the United States have changed. This has clearly changed the balance of power between them and will continue to as we move forward into the future. For example:
Unite States versus Soviet Union:
Soviet Union/
Year United States Russia Ratio
1950/51 151.3 (1950) 182.3 (1951) 0.83-to-1
1980/82 226.5 (1980) 270.0 (1982) 0.84-to-1
2018 308.7 142.9 2.16-to-1
2050 402 132 3.05-to-1
Now, this is certainly the biggest change we will look at. Russia went from almost being a world power to being a pale reflection of its past power and glory (I am willing to argue that the Soviet Union was never really a world power….it just pretended to be one). Added to that is the economic changes over time. I hesitate to even discuss what the GDP of the Soviet Union was, as the ruble was artificially inflated. When it was floated in the 1990s, it went from one ruble per 1.11 dollars (it always was worth more than a dollar in the Soviet era, of course)…to something like 3,000 rubles to a dollar. They then shaved off two the zeros for the new ruble to make it less than 30 rubles to a dollar. The current exchange rate is 65 rubles to a dollar.
The current Russian GDP is 1.5 trillion (IMF 2017). This is compared to the United States GDP of 19.4 trillion (IMF 2017). So, right now, Russia has less than half the population and less than a tenth of the economy of the United States. In 2050 it will have only a third of the population of the U.S. Who knows what the economy will be. The Russia economy might still be pretty dependent on the price of oil.
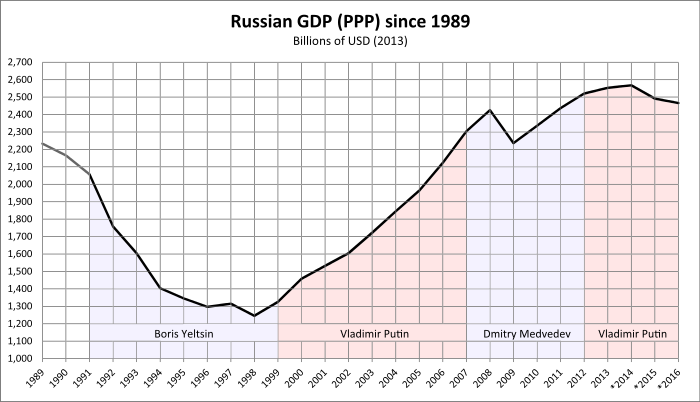
With its population declining, its work force aging, its economy built upon export of oil and gas, with wide spread corruption, and an entrenched leadership; it is hard to imagine that Russia’s economy will have an extended economic growth that will return it to being a great power. Its economic growth last year (2017) was 1.5%. Russia is currently the 11th or 12th richest country in the world. It is behind Canada. My seat-of-the-pants estimate is that Russia will still not be among the 10 richest countries in 2050.
For Russia to return to its old glory, it really sort of needs to re-constitute the Soviet Union or the old Russian Empire to some degree. Some would argue that this has indeed been part of Putin’s plan. I will examine this in a future post.
Status Update On U.S. Long Range Fires Capabilities

Earlier this year, I noted that the U.S. is investing in upgrading its long range strike capabilities as part of its multi-domain battle doctrinal response to improving Chinese, Russian, and Iranian anti-access/area denial (A2/AD) capabilities. There have been a few updates on the progress of those investments.
The U.S. Army Long Range Fires Cross Functional Team
A recent article in Army Times by Todd South looked at some of the changes being implemented by the U.S. Army cross functional team charged with prioritizing improvements in the service’s long range fires capabilities. To meet a requirement to double the ranges of its artillery systems within five years, “the Army has embarked upon three tiers of focus, from upgrading old school artillery cannons, to swapping out its missile system to double the distance it can fire, and giving the Army a way to fire surface-to-surface missiles at ranges of 1,400 miles.”
The Extended Range Cannon Artillery program is working on rocket assisted munitions to double the range of the Army’s workhouse 155mm guns to 24 miles, with some special rounds capable of reaching targets up to 44 miles away. As I touched on recently, the Army is also looking into ramjet rounds that could potentially increase striking range to 62 miles.
To develop the capability for even longer range fires, the Army implemented a Strategic Strike Cannon Artillery program for targets up to nearly 1,000 miles, and a Strategic Fires Missile effort enabling targeting out to 1,400 miles.
The Army is also emphasizing retaining trained artillery personnel and an improved training regime which includes large-scale joint exercises and increased live-fire opportunities.
Revised Long Range Fires Doctrine
But better technology and training are only part of the solution. U.S. Army Captain Harrison Morgan advocated doctrinal adaptations to shift Army culture away from thinking of fires solely as support for maneuver elements. Among his recommendations are:
- Increasing the proportion of U.S. corps rocket artillery to tube artillery systems from roughly 1:4 to something closer to the current Russian Army ratio of 3:4.
- Fielding a tube artillery system capable of meeting or surpassing the German-made PZH 2000, which can strike targets out to 30 kilometers with regular rounds, sustain a firing rate of 10 rounds per minute, and strike targets with five rounds simultaneously.
- Focus on integrating tube and rocket artillery with a multi-domain, joint force to enable the destruction of the majority of enemy maneuver forces before friendly ground forces reach direct-fire range.
- Allow tube artillery to be task organized below the brigade level to provide indirect fires capabilities to maneuver battalions, and make rocket artillery available to division and brigade commanders. (Morgan contends that the allocation of indirect fires capabilities to maneuver battalions ended with the disbanding of the Army’s armored cavalry regiments in 2011.)
- Increase training in use of unmanned aerial vehicle (UAV) assets at the tactical level to locate, target, and observe fires.
U.S. Air Force and U.S. Navy Face Long Range Penetrating Strike Challenges
The Army’s emphasis on improving long range fires appears timely in light of the challenges the U.S. Air Force and U.S. Navy face in conducting long range penetrating strikes mission in the A2/AD environment. A fascinating analysis by Jerry Hendrix for the Center for a New American Security shows the current strategic problems stemming from U.S. policy decisions taken in the early 1990s following the end of the Cold War.
In an effort to generate a “peace dividend” from the fall of the Soviet Union, the Clinton administration elected to simplify the U.S. military force structure for conducting long range air attacks by relieving the Navy of its associated responsibilities and assigning the mission solely to the Air Force. The Navy no longer needed to replace its aging carrier-based medium range bombers and the Air Force pushed replacements for its aging B-52 and B-1 bombers into the future.
Both the Air Force and Navy emphasized development and acquisition of short range tactical aircraft which proved highly suitable for the regional contingencies and irregular conflicts of the 1990s and early 2000s. Impressed with U.S. capabilities displayed in those conflicts, China, Russia, and Iran invested in air defense and ballistic missile technologies specifically designed to counter American advantages.
The U.S. now faces a strategic environment where its long range strike platforms lack the range and operational and technological capability to operate within these AS/AD “bubbles.” The Air Force has far too few long range bombers with stealth capability, and neither the Air Force nor Navy tactical stealth aircraft can carry long range strike missiles. The missiles themselves lack stealth capability. The short range of the Navy’s aircraft and insufficient numbers of screening vessels leave its aircraft carriers vulnerable to ballistic missile attack.
Remedying this state of affairs will take time and major investments in new weapons and technological upgrades. However, with certain upgrades, Hendrix sees the current Air Force and Navy force structures capable of providing the basis for a long range penetrating strike operational concept effective against A2/AD defenses. The unanswered question is whether these upgrades will be implemented at all.
Demographics of Germany
Germany is the richest country in Europe. It is the second most populous country in Europe (after Russia). It is the fourth richest country in the world. Its demographic situation is similar to many of its neighbors, which include several nearby large counties of around 60 million people, the United Kingdom, France and Italy. Each are unique, but because of its central position in Europe, this is a perfectly good case to examine.
The population of Germany is almost 83 million (82,800,000 in 2017 estimate). The rate of growth has been slow. In 1939, they had 69 million people (inside current borders: not counting territory and population gains in the 1930s). They still only had 69 million in 1950. Its fertility rate is now 1.59 children born per woman (2016 estimate). This is low, but not as low as Japan. Since the 1970s, the German death rate has exceeded its birth rate. Its fertility rate has been below 2.00 since 1970.
Unlike Japan, there has been significant immigration to Germany. The rate of immigration to Germany, relative to the size of their population has been higher than in the United States. About 7 million of Germany’s residents do not have German citizenship and over 10 million of the people in Germany (12%) were born outside of Germany. They tend to be from everywhere, Turkey, Poland, Russia, Italy, Romania, Greece, Syria, other EU countries, and so forth.
So….the picture is different when it comes to the demographic “pyramid,” although because of the low birth rates, it is still not very pyramidal. Not as bizarre looking as Japan’s, but this clearly still shows a shortage of young labor and a potential burden on the younger generation as the larger older population ages.

In many respects the comparison between Japan and Germany is most interesting, as Japan is a case of a country with low birth rate that does not have significant immigration, while Germany is the opposite. A proper in-depth study of this would look at the macro and micro economic impacts of this, the social impacts, and the long-term strengths and weaknesses these countries develop as a result of this. It is not a task I will be taking on.
As far as what the estimates for German population in 2050, hard to imagine it is going to be significantly different than what is today. It only grew 14 million in the last 80 or so years. A lot of this growth is due to immigration. So the United Nations estimates it will be 79 million in 2050. Sounds perfectly reasonable, although it is dependent on their continued immigration policy.
I have now briefly looked at six countries in the world, Russia, United States, China, India, Germany and Japan. This includes the three most populous counties in the world (followed by Indonesia, Brazil, Pakistan, Nigeria, Bangladesh, Russia, Mexico and Japan). They include five of the six richest countries in the world (with the UK being fifth on the list and France being seventh). I think that will be all for now.
FY2019 Defense Budget

I gather the defense budget for FY2019 is 674.4 billion. This is 17 billion more than 2018.
The bill only funds U.S. defense through 7 December (there is considerable irony in that date), and then they have to pass another bill. So it can all change. Added to that there will be the mid-term elections in November, although the new congress won’t be seated until late January.
The defense budget has gone from a high of 696 in 2010, down to 571 in 2015 and then up to 596 in 2016, 626 in 2017, and 653 in 2018. Source (as everyone seems to have a slightly different set of numbers): https://www.whitehouse.gov/omb/historical-tables/
By the way, worth your while to look through the tables on that site.
Also see: https://www.thebalance.com/u-s-military-budget-components-challenges-growth-3306320

Demographics of Japan
There was a time in the 1980s when Japan’s GNP was 60% of the United States and people were talking about Japan’s economy outgrowing the United States by the year 2000, 2010 or 2020…but in our lifetime. Well, I am still alive and they have not. Right now, Japan’s GNP is about 25% of the United States (IMF 2017 figures) and it does not look like they are going into any extended economic boom any time soon. Now, this talk in the 1980s was understandable if one took a straight line of the Japanese economic growth over the previous couple of decades, and compared it the U.S. economic growth of say, the 1970s. And…if you assumed those two lines would continue unchanged for the next few decades, you could get there. That is obviously not what happened. Japan’s place as the booming economic challenger was replaced by the “Asian Tigers” and then by the Peoples Republic of China. Japan’s current GDP is growing at 1.7% a year (2017). One of the several underlying reasons for this slow growth is due to their shortages in workforce, caused by their demographics.
The population of Japan as of the 2017 census is 127 million people (126,672,000). It is the tenth most populous country in the world (just after Russia). They remain the third richest country in the world (3rd in GNP) after the United States and China.
In 1985 their population was 121 million. This is not much growth. Mostly the population is getting older and grayer. In 2012, 24% of the population was over 65 and it is projected to rise to almost 40% by 2050. The good news is that Japan has the second longest overall life expectancy of any country in the world at 83.5 years. Since 2010 Japan has had a net population loss caused by falling birth rates and almost no immigration. Its fertility rate is 1.41 children per woman (2012), which is by far the lowest figure of any of the countries we have discussed. This is an improvement from 2001-2005, when it was 1.32.

Oddly enough, Japan controlled its population in the previous two centuries. Japanese population remained around 30-35 million people for around 150 years, from the early 1700s (their first census was in 1721). This is unusual, extremely unusual as it was not caused by any natural or man-made disaster. It appeared to be caused by a culture of family planning that simply resulted in the population remaining relatively steady. I don’t know enough about Japanese history to know why this developed, but it is trend that you see in almost no other country in the world in the 1800s. Just to make everyone uncomfortable, apparently this population control was helped by “infanticide” (mabiki).
Japan is a country that is not very encouraging for immigration. It is 98.5% Japanese, 0.5% Korean, 0.4% Chinese and 0.6% Other (in 2011). One of those “other” is now Geoffrey Clark, one of our guest bloggers. He has just moved to Japan for work and will be returning to blogging soon.
Japan really had not relied on immigration as part of their response to declining population. This is also unusual. As a result their demographic “pyramid” has developed a really uncomfortable shape. This is about as close as you are going to get to just flipping the pyramid upside down.
In the bigger picture, this shows the impact of controlled de-population on a country’s demographics (and economy). This is the alternative to allowing large scale immigration. Every country will need to address this as their fertility rates drop below 2. It is estimated that in 2050 the population of Japan will be 109 million (2017 UN figures, medium variant). This compares to 402 million for the United States (or 396 million using the 2017 UN medium variant figures). Right now the per capita income of Japan is $38,440 compared to $59,501 for the U.S. (IMF 2017 figures). If the per capita income remains below the United States, then this means the GDP of Japan could well decline to being below a fifth of the United States. This is a very different picture than the estimates that they would economically surpass the U.S. in 2020.
Final thoughts:
Japanese United States Ratio
Year Population Population U.S./Japan
1860 > 32 million 31 million 0.97
1900 44 million 76 million 1.72
1940 73 million 132 1.64
1980 117 227 1.94
2020 127 334 2.63
2050 109 396 3.63
1860 was 7 years after Commodore Perry entered Edo Bay, which lead to the opening of Japan for trade.
1900 was when the U.S. and Japan were on good terms.
1940 was the year before Pearl Harbor and the U.S. and Japan went to war.
Demographics of India
India is still not thought of by many as a world power, but in the long run, as its economy and population grow, it will join this esteemed company. It is the 2nd largest population in the world and the 6th largest economy in the world. Its economy is about the size of its old colonial master, the United Kingdom. It is a nuclear power, although we gather it has not weaponized many nukes. Still, it is a poor country, with a per capita income of $1,983 per person (per year…IMF 2017 figures).
Unlike China, there was no draconian one-child policy adopted, so Indian population continued to grow at a rate that is about to catapult it past China as the most populous country in the world. This is expected to happen in 2024 or 2030, or whenever. Sometime in the next decade.
The population of India for 2017 is estimated at 1.324 million, or 1.3 billion. This puts the population of the world’s largest democracy around four times that of the United States. It is almost four times what its population was in 1951 (361 million). In the early 1950s China had a population around 60 percent larger than India. Now, they are almost equal, although China has considerable more wealth.
The rapid Chinese economic growth has lead to it having a GDP of $12 trillion compared to the more anemic GDP of India at only $2.6 trillion. Needless to say, there is also a big difference in per capita income.
But while China is growing at a rate of only .59% a year and its population is expected to fall, India is expected to continue growing. Its growth rate in 2016 was 1.19% and its fertility rates are 2.45 children per woman (2016 estimate from CIA World Factbook). The annual growth rate remains at over one percent a year. But, the growth rate of the population appears to be declining, like it is in most areas of the world, developed or developing. India does have some emigration and immigration, but the population is so massive that this does not have a huge impact on population growth rates. The demographic pyramid is actually much more pyramidal that the others we have seen, although it is clear towards that bottom of the pyramid that they are now controlling their population growth rates.

India is truly a multi-ethnic, multi-linguistic and multi-religious society. It has something like more than 2,000 ethnic groups. Forgive me if I don’t list them. About 40% of Indians speak Hindi (an Indo-European language) as their first language, and over half the population can speak it. Over 10% of the population speaks English, making it the second largest English speaking country in the world. Religious affiliation is a little more unified with Hindu’s making up almost 80% of the population. There are Muslims (14% or more), Christians (2.3%), Sikhs (1.7%), Buddists, Jainism and even practitioners of Zoroastrianism (look that one up in your Funk and Wagnells). Keep in mind that 14% of 1.3 billion makes this the third largest Muslim population in the world with over 170 million Muslims.
The Indian population is expected to grow for a while. The United Nations predicts the Indian population will be 1.7 billion in 2050. This compares to 402 million for the United States and 1.36 billion for China estimated in 2050.
India economic growth rate has been around 6% a year for the last two decades. Depending on continued economic growth, this is a country that will slowly and surely take its place among the nations of the world.
Demographics of China
China is the most populous country/region in the world. In its unified and un-unified forms, it has been forever, so it seems. It certainly has been since the fall of the Roman Empire, although one can argue that the British Empire was larger for a moment. Oddly enough, the pre-eminent position that it has held for over 1,500 years, is about to be surpassed by India. China, in its wisdom brought it population under control decades ago, encouraging smaller families. This has allowed it to further develop and economically grow. Quite simply, if a country’s economic growth is 3% a year, and its population growth is 3% a year, then the average person is basically getting nowhere. This has been the case for many nations in the developing world. China has broken from that pattern.
The population of China (People’s Republic of China) for 2017 is estimated at 1,411 million, or 1.4 billion. This is a staggering figure making it almost five times (4.6 times) as many people as the United States. It is around three times what its population was in 1950. The population in its first official national census taken by the People’s Republic of China in 1953 was 583 million. It was a little hard to determine what the population of China was until the post-war period. Post-war in this case means post-Warlord period, post-Sino-Japanese War, post-World War II and post-Chinese Civil War. The Chinese population was almost four times larger than the United States in 1950/1953, back in the days when we were at war with China in the Korean peninsula. The Chinese population is now growing at a rate of 0.59% percent a year (a half percent a year). This is very low.
The fertility rates in China are 1.62 children per woman (2016) according to National Health and Family Planning Commission (NHFPC) and 1.29 in 2016 according to the National Bureau of Statistics (NBS). Not sure why there is such a difference. Regardless, this is not replacement rate and well below 2.1. It is a birth rate lower that what we see in many developed countries, although China is a still a developing country. This low birth rate was a result of the one-child policy instituted by the Communist Party in 1979. It appears to have not only worked, but it worked too well. In 2015, the government instituted a two-child policy. According to NHFPC, they are expecting the birth rate to grow to 1.8. I guess this is one of the goals of the 13th Five-Year Plan. This is still not replacement rate. China does have some emigration and immigration, but the population is so massive that this does not have a huge impact on population growth rates.

They have classified 91.51% of the population of China as Han Chinese. Still, 8.5% of 1.5 billion creates some significant minorities. This includes the Tibetians, with at least 2.8 million, and the Turkish Uyghurs estimated at 3.6 million. I ate recently at a Uyghur restaurant in Crystal City, VA. I have never seen to one of those before.
Most likely the Chinese population will experience negative population growth by 2030. The United Nations predicts the Chinese population will be 1.36 billion in 2050. This compares to 402 for the United States and 132 for Russian in 2050. Predicting population over 30 years is not that difficult. On the other hand, there is a projection that Chinese population will decline to 1.02 billion by 2100. I would not hang my hat on that last figure.
The population is aging, with its demographic “pyramid” developing a narrowing at the bottom. The demographic “pyramid” from 2015 is below:

These figures do not include Taiwan (Republic of China) or Macau (Macao Special Administrative Region). It does include the city of Hong Kong. Mainland China claims Taiwan is part of China and has had an army posed across the straights ready to invade for almost 70 years. I am guessing if they have not invaded in the last 70 years, they are not going to invade in the next 70, especially as Taiwan is a major trading partner. I do not expect re-unification as long as Taiwan remains democratic (and it has been since 1991/1996) and China remains a communist dictatorship. Taiwan had a population in 2010 of 23.1 million, and it is growing only very slowly. Macau, with a population of 552,300 in the 2010 census, is effectively under Chinese control, as is Hong Kong (7,097,600 in the 2010 census).