Category National Security Policy

Old Questions

We have over a thousand posts on this blog. Always interesting to go back and look a few of these older ones.

We had one blog post that simply asked on 9 November, 2016, after Donald Trump had been elected: What was going to be his foreign policy/national security policy. The old post is here: Questions | Mystics & Statistics (dupuyinstitute.org)

The answers are:

1D (Afghanistan: Decrease U.S. effort)

2B (Iraq: Decrease U.S. effort)

3B (Syria: Decrease U.S. effort)

4C (Ukraine: Keep the same)

5C (Russia: Try to tone it down)

6D (NATO: Force our NATO allies to contribute more)

7B (Georgia: Continue working with them: Partnership for Peace)

8A (Iran: Cancel current deal and try to renegotiate)

9A (Yemen: Keep the same (remain disengaged))

10? (War on Terror)

11A (Defense Budget: Increase defense budget)

12? (East Asia)

13A (Trade: TTP cancelled)

14D (Oil and Climate Change: Interest and funding for clean energy declined)


It was followed-up on by this post on 14 December 2016: Questions II | Mystics & Statistics (dupuyinstitute.org)

U.S. Party in Power and the Defense Budget

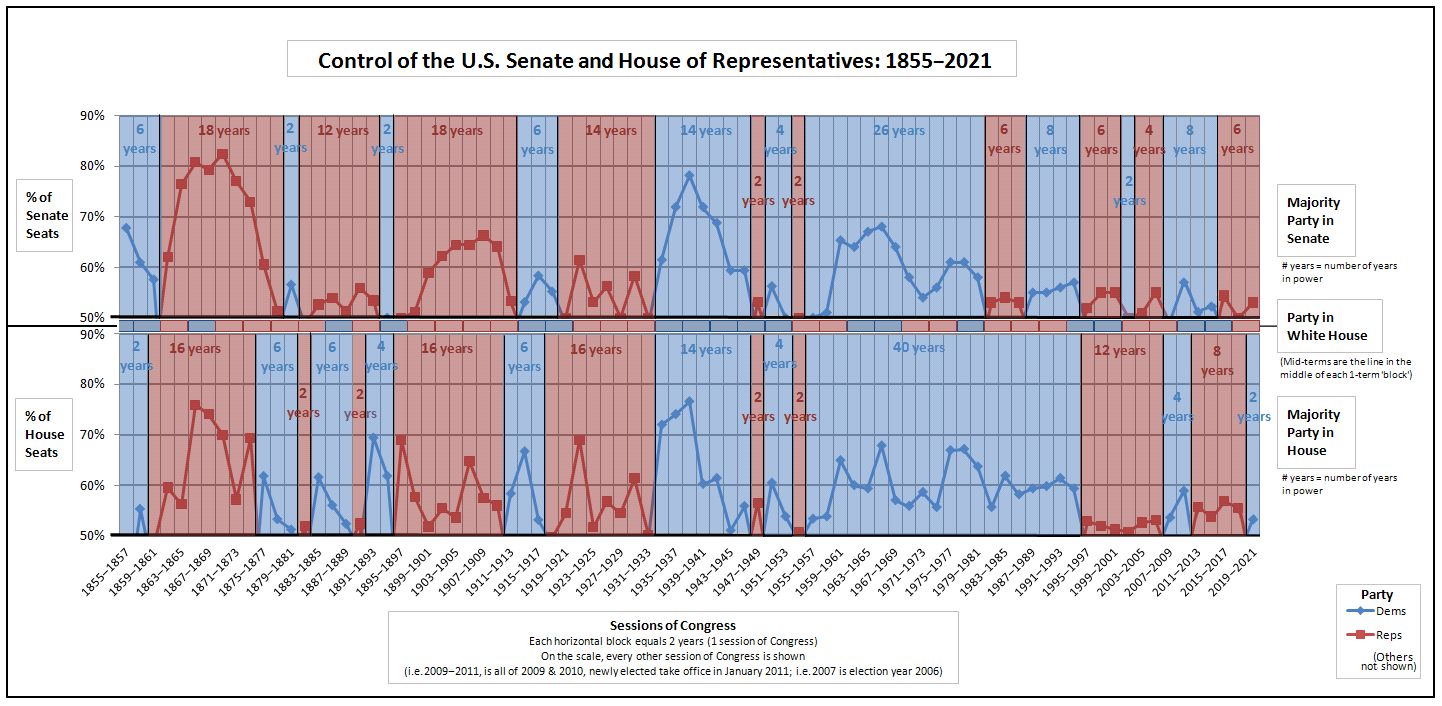
The U.S. Defense budget goes up and down. This is sometimes related to external threats. It is often more closely correlated with which party is in power.

Below is the chart of who held the House, Senate and Presidency since 1855.

Below is a graph of the U.S. Defense budget as a percent of GDP from 1792 to 2016. We are not going to discuss this graph, I just added it because I think it is a real cool graphic:

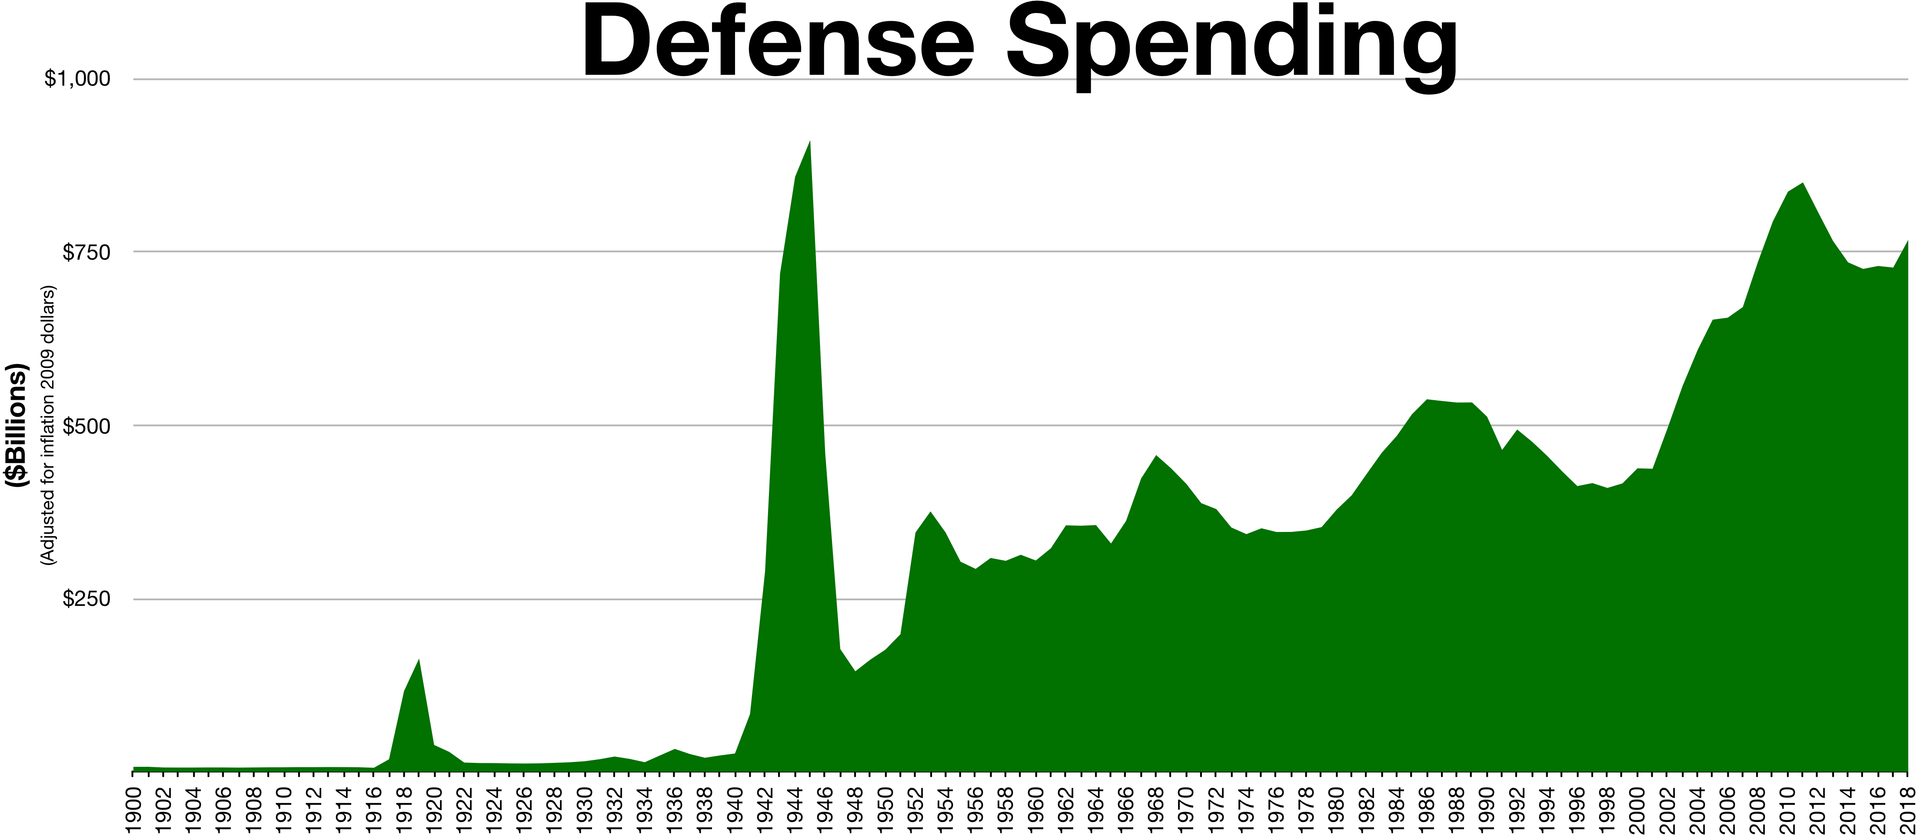
On the other hand, this chart is worth examining further, as it is the U.S. Defense budget in constant 2009 dollars from 1900-2018.

Just picking up the graph from 1972 (after the Vietnam War) one can see (I do recommend copying and blowing up this graphic) that defense spending was flat from 1972-19799 and then started increasing in 1980 under Carter (Democrat) and continued increasing under Reagan (Republican). That increase flattened off and then budget declined after 1989 under Bush (Republican). That budget decline put an end to Trevor Dupuy’s HERO and DMSI organizations, and he reformed in 1992 as The Dupuy Institute. There was a budget increase in 1991, courtesy of the Gulf War and then it continued to decline until 1996 under Clinton (Democrat), where the budget again leveled off. Starting around 2001 under Bush Jr (Republican), the budget again continue to grow, peaking in 2011 and then declining under Obama (Democrat) and leveling off in 2015. It was as a result of that decline that The Dupuy Institute ended up de-staffing, something that we have never recovered from. In 2018 under Trump (Republican) the budget again started to increase (although TDI has not benefited from this increase).

So, the pattern is that the budget does indeed decline or remain flat under Democrats and usually rises under Republicans. There are exceptions to that (1980-1981, 1990-1993, 2000-2001, 2010-2011). But if the pattern holds true, then one is probably safe to assume that it will again decline over the next couple of years down to a lower level. The pattern is that these declines level off at a lower level that is often about 80% or so of the previous budget high. We see that in 1972-1979, 1996-2001 and to a much lesser extent in 2013-2017.

Hard to Ignore the Coronavirus

It is hard to ignore the Coronavirus. It is kind of the biggest game changer right now, not only for the tragic mortalities, but for its economic impact and as a result, for its impact on international relations and national security. While its rate of expansion in China seems to be slower (see my previous post), it is appearing in various “hot spots” across the world. As of the moment I am writing this (after 1:00 PM Feb. 24) there were 80,350 confirmed cases worldwide and 2,705 deaths…assuming all the reporting is complete and correct. Right now in South Korea there are 977 cases and 10 deaths, in Italy there are 283 cases and 7 deaths, in Japan there are 170 cases and 1 death (and 3 from the cruise ships) and in Iran there are reported 95 cases and 16 deaths. There is a sense that the Iranian figures are low and the real numbers are higher. So outside of China there are pockets of disease in multiple locations.

See: https://gisanddata.maps.arcgis.com/apps/opsdashboard/index.html#/bda7594740fd40299423467b48e9ecf6

Beyond the immediate dangers the virus poses, there are the problems and cost of containment. China, in its efforts to control it, effectively shut down entire cities. Is that what Korea, Italy and Iran are going to have to do? This is a major economic hit.

The markets on Monday clearly picked up on this with the Dow Jones dropping over a thousand points yesterday. It is down 500 800 almost 900 points today. Markets in South Korea, Italy, etc. are getting hit even worse. Oil prices are also declining. Right now they are over $50 a barrel but they could decline to the low $40s. The exchange rate for the ruble has also declined to 65 to a dollar. Their economy and government budget is heavily impacted by oil prices. My post from 28 January:

The Snowballing Effects of a Virus?

This is clearly going to affect the world markets through this quarter and probably into the next quarter. If it is fully contained, then the economies will start to recover. The question is, can this virus be fully contained? Because of the rather “stealthy” way it spreads, with people apparently able to spread it before they show symptoms of the disease, it may take a while to fully contain. Suspect these are not the last outbreaks. Each outbreak then produces another round of costly containment efforts.

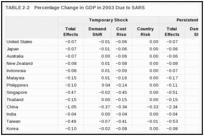
It has been estimated that the economic cost of the SARS virus of 2002-2004, which only included 8,098 documented cases and 774 deaths in 17 countries, cost 1.05% of the Chinese GDP in 2003. Hong Kong took the biggest with a 2.63% loss in GDP in 2003 while the U.S. economy had a negative 0.07% effect. It is clear that this virus is going to have a lot bigger impact. Right now, it is 80,350 cases, 2,690 cases outside of mainland China, and 2,705 deaths (with 42 of them outside of China).

One estimate is here: https://www.ncbi.nlm.nih.gov/books/NBK92473/

The Table 2.2 is here (and a lot less blurry): https://www.ncbi.nlm.nih.gov/books/NBK92473/table/ch2.t2/?report=objectonly


Size of Theater

Seeing how Iran and Iraq are back in the news (as I suspect so will be the Persian Gulf), let me just remind everyone the size of these “theaters.”

………………….Iraq………….Iran…………Persian Gulf……Texas……Lake Superior
Area (sq. km)…437,072……..1,648,195……251,000…………..696,241…….82,000

Population…….38,433,600…82,531,700……N/A……………..28,995,881…….N/A

GDP …………..$250 Billion…$458 Billion……N/A……………..$1,819 Billion….N/A

Texas is the second largest state in the U.S. (behind Alaska) and the second most populous state in the U.S. (behind California). Lake Superior is the largest fresh water lake in the world. Or to put it relative to Europe:

………………….Iraq……………Iran………..Persian Gulf…….France……..Baltic Sea
Area (sq. km)…437,072……….1,648,195…251,000……………551,695……..1,641,650

Population…….38,433,600……82,531,700….N/A………………64,834,000…….N/A

GDP ……………$250 Billion…$458 Billion….N/A………………$2,707 Billion….N/A

The area and population given is for “Metropolitan France,” meaning those parts of France that are in Europe.

U.S. Navy Compared to Russian Navy

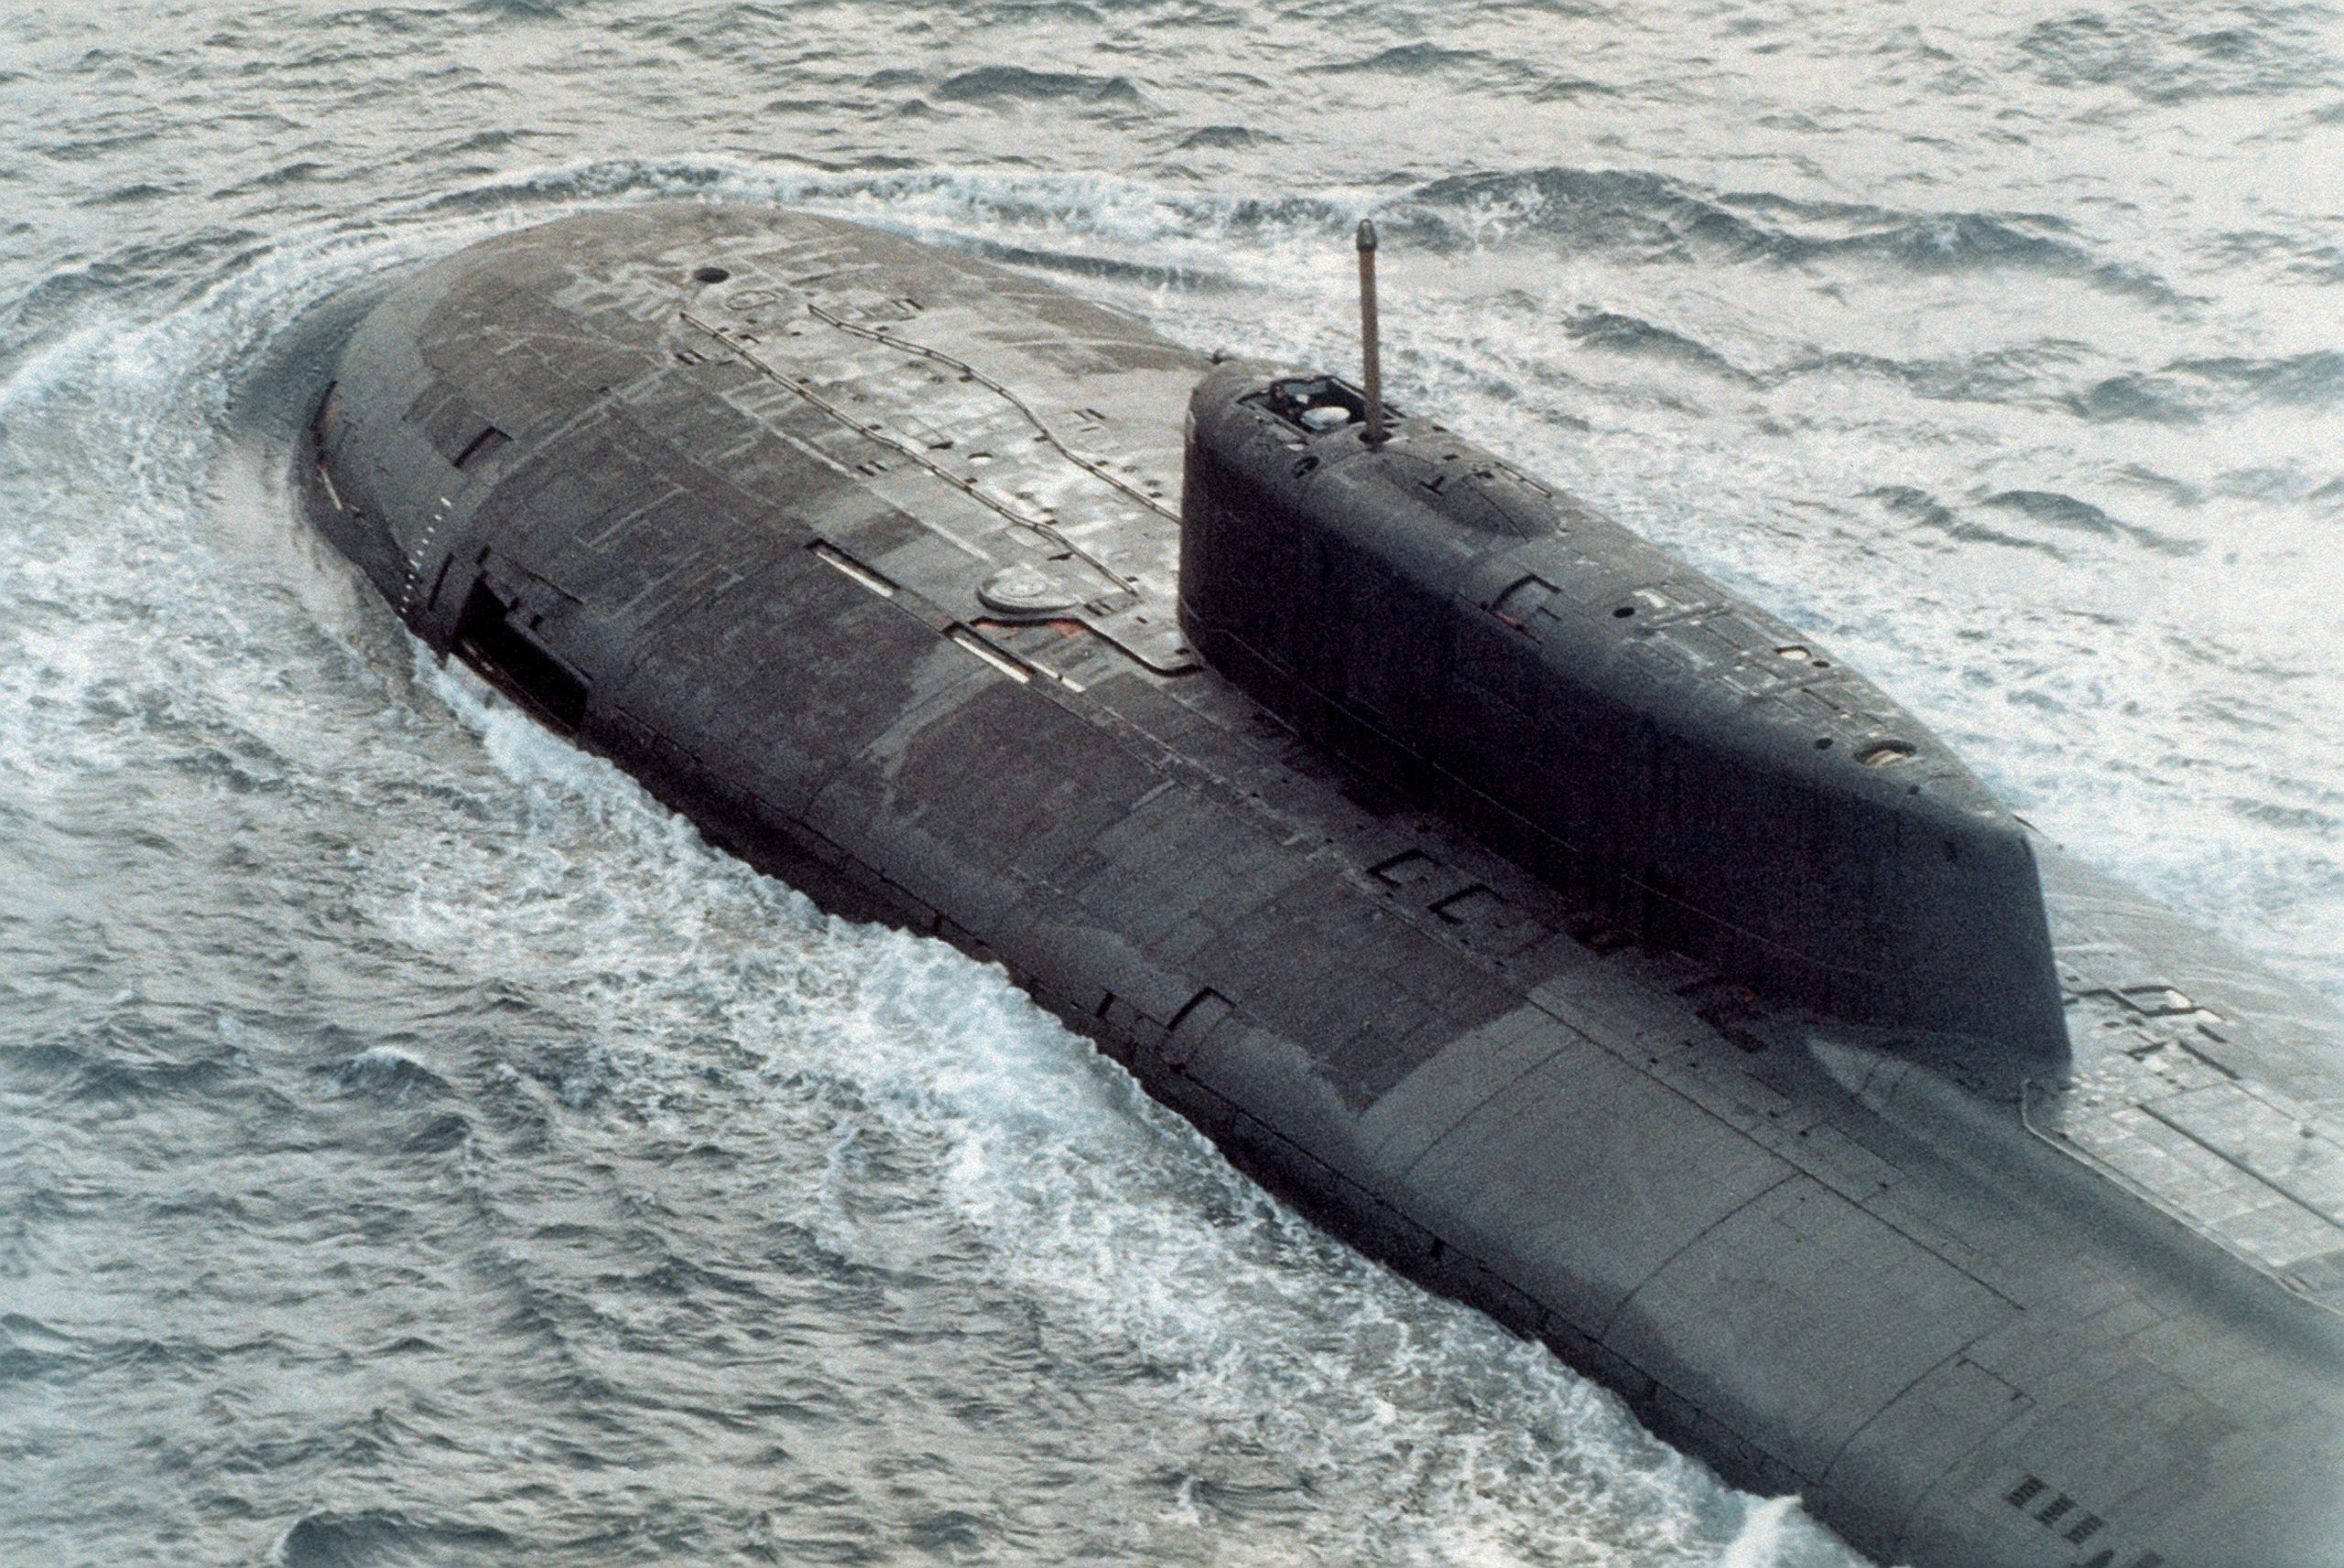
An elevated port side view of the forward section of a Soviet Oscar Class SSGN nuclear-powered attack submarine. (Soviet Military Power, 1986)

One person commented on this blog about the danger posed by Russian submarines. Probably a good time to look at what the threat is.

I did start my career in the U.S. defense industry working with submarine sonars and spectrum analyzers. This was back in the bad old days, when there were hundreds of subs out there. In our new found more peaceful world, there are a lot less.

Russian has around 56 submarines, according to Wikipedia. How many of these are fully operational is not something I know. Of those, 11 of them are boomers or ballistic missile submarines. These are submarines that carry nuclear missiles and would not be part of any fleet-on-fleet battle. They also list 6 “special-purpose submarines,” two are old converted attack submarines. The group of subs that threaten our control of the seas are 8 cruise missile submarines (SSGN) and 15 nuclear-powered attack submarines (SSNs). There are also 22 smaller diesel-power attack submarines. This is 45 or less operational subs to threaten our carrier fleets.

The biggest danger from Russian fleet is their 8 cruise missile submarines. These really are a threat to our carriers.

The United States has around 66 submarines. Of those, 14 are boomers.


Comparative Ship Count:

…………………………U.S……Size…………………….Russia…….Size

Aircraft Carriers………11…….100,000-106,300………..1….,…….58,600 tonnes

LHA/LHD……………….9……..41,150-45,693 tons (these are carriers !!!)

Battlecruisers………….0……………………………………2…………28,000 tons

Cruisers……………….22……..9,800 tons………………..3………….12,500 tons

Destroyers…………….69……..8,315-9,800…………….11…………7,570 – 7,940 tons

LCS…………………….20…….3,104-3,900 (“Littoral Combat Ships”)

Frigates…………………0…………………………………..10………….1,930 – 5,400 tons

Large Corvettes………………………………………………6………….2,200 tons

Corvettes……………………………………………………..76………..500 – 1050 tons


LPD…………………….11……25,300 (“Landing Platform Dock”)

LSD…………………….12…..15,939-16,100 (“Landing Ship Dock”)

LST (Landing Ship Tank)…………………………………..20…………..4,080 – 6,600 tons

Special-purpose………7…..895-23,000…………………18…………..500 – 23,780

Patrol Ships…………………………………………………..2…………..1,500

MCM……………………11……….1,312 tons (mine countermeasures)

PC………………………13………….331 tons (coastal patrol)


Large SSBN…………………………………………………..1………….48,000 tons

SSBNs………………..14……..18,750 tonnes……………10…………13,700 – 24,000 tons

SSGN…………………..4………18,750 tonnes…………….8………….19,400 tons

SSN……………………48…….6,927-12,139 tonnes…….15…………7,250 – 13,800 tons

SSK…………………….0……………………………………..22…………2,700 – 3,950 tons

Special purpose subs…………………………………………6………….600 – 18,200 tons


I did not bother to list landing craft (Russia has 37 of 555 tons or less), patrol boats (Russian has 37 of 139 tons or less), mine countermeasure vessels (Russian has 6 of 1,100 tons or less), auxiliaries (cargo ships, ice breakers, logistic vessels, salvage vessels, tugs, tankers, oilers, transports, etc.), LCCs (amphibious command ships), submarine tenders, maritime prepositioning ships (T-AK), the USS Pueblo, and the USS Constitution.

What is a ton:

Short ton (U.S.) = 2,000 pounds

Metric Tonne = 2,204.6 pounds

Long ton (UK) = 2,240 pounds


The Best and The Brightest

One of seminal works coming out of the Vietnam war was David Halberstam’s book The Best and the Brightest about the highly intelligent, highly educated “whiz kids” that were brought into our national security structure in the 1950s and 1960s and ended up tangled up in the unsolvable Vietnam War. This tendency for the foreign policy team to include highly educated specialists was reinforced by Nixon hiring the scholar Henry Kissinger as his National Security Advisor and later Secretary of State. This has become somewhat of a tradition, where the National Security Advisor is often a reputable academic like Rostow (PhD, Yale), Kissinger (PhD Harvard) or Brzezinski (PhD, Harvard). Even Trump’s second national security advisor, the legendary three-star general H. R. McMaster, had a PhD and had published one book.

So the tradition, for better or worse, is that the U.S. national security team consists a smattering of “whiz kids”, academics and some of the “Best and the Brightest.” This tradition does not appear to be closely adhered to now. The Secretary of State, Mike Pompeo, is a lawyer (although from Harvard) and career politician. The newly nominated National Security Advisor is Robert O’Brien, also a lawyer. The previous holder of that office, the infamous John Bolton, was also a lawyer. The head of the Defense Department is Mark Esper, who has a PhD in Public Policy.

I will leave it to the reader as to whether having a bunch of Harvard academics with a background in International Relations results in better foreign policy. I just note that this is now no longer the tradition. It is mostly lawyers now.


P.S. A few related posts:

Secretary of the Army, take 3

Secretary of Defense – 3

H. R. McMaster

McMaster vs Spector on Vietnam

Top 20 Countries by Annual GDP (PPP) from 1800 to 2040

In the past, I have made a number of posts comparing countries by GDP (Gross Domestic Product). I always use GDP (Nominal) vice GDP (PPP – Purchasing Power Parity). Some people have asked why I don’t use GDP (PPP). Well here is a youtube.com video based upon that: https://www.youtube.com/watch?v=4-2nqd6-ZXg

One will note that the video starts in 1800 with China by far the richest country in the world and India second. Yet during the 1800s the much poorer (by this video) United Kingdom already occupied parts of India and continued expanding their control. The “poorer” European powers then started carving up China. In 1937 the GDP (PPP) of Japan is 220 million while the GDP (PPP) of China is 530 million. Yet who is invading whom?

Here is a video based upon GDP (Nominal), covering 1960 -2017. It is curious as it leaves out the Soviet Union completely (but does include Russia): https://www.youtube.com/watch?v=wykaDgXoajc

Here is one on projected GDP (Nominal), projecting from 2018 to 2100: https://www.youtube.com/watch?v=T9l2yCH5wBk

Some of these figures are hard to explain in light of the demographic challenges facing countries like China and Japan. In the case of China they will most likely experience negative population growth by 2030. Japan has already reached that point.

Demographics of China

Demographics of Japan


One must treat all this “infoporn” with considerable caution.

It does seem that PPP overinflates the appearance of national power, although it may be perfectly valid for measuring per capita income and comparative standards of living.

Top 15 Countries by Military Spending (1914-2018)

I have noticed this five-minute youtube video being posted on twitter lately: https://www.youtube.com/watch?v=cw2Wm8T6tio

While it is interesting, it should be viewed with considerable caution. First, it does not state the source of its monthly data. I gather it is in U.S. dollars and not adjusted for inflation. The data is clearly very susceptible to exchange rates. The expenditures for the Soviet Union in the 1970s and the 1980s seems overinflated. At this time the ruble was pegged higher than the dollar at 1.11 dollars to the ruble if I remember correctly. In the early 1990s it dropped to like 3000 rubles to a dollar. Does the 1970s and 1980s data account for the real value of the currency, or is it based upon it obviously overinflated official exchange rate? I am guessing the later.

Secretary of Defense – 3

Looks like we are on our third secretary of defense. Acting Secretary of Defense Patrick Shanahan has withdrawn his nomination due to domestic violence problems that apparently included a baseball bat. The current Secretary of the Army, Mark Esper will be nominated for Secretary of Defense. We have a brief bio of him in this post:

Secretary of the Army, take 3

The Secretary of Defense has existed since 1947, when James Forrestal became the first. He later committed suicide. There have been 28 men (no women) who have been Secretary of Defense (including 3 acting). Of those, ten served in the U.S. Army: Hagel, Panetta, Perry, Aspin, Weinberger, Clements, Richardson, McNamara (U.S. Army Air Forces), Marshall, Johnson (WWI). Nine have never served in the military (Shanahan, Carter, Cohen, Cheney, Taft, Brown, Schlesinger, McElroy and Wilson).

TDI Friday Read: Multi-Domain Battle/Operations Doctrine

With the December 2018 update of the U.S. Army’s Multi-Domain Operations (MDO) concept, this seems like a good time to review the evolution of doctrinal thinking about it. We will start with the event that sparked the Army’s thinking about the subject: the 2014 rocket artillery barrage fired from Russian territory that devastated Ukrainian Army forces near the village of Zelenopillya. From there we will look at the evolution of Army thinking beginning with the initial draft of an operating concept for Multi-Domain Battle (MDB) in 2017. To conclude, we will re-up two articles expressing misgivings over the manner with which these doctrinal concepts are being developed, and the direction they are taking.

The Russian Artillery Strike That Spooked The U.S. Army

Army And Marine Corps Join Forces To Define Multi-Domain Battle Concept

Army/Marine Multi-Domain Battle White Paper Available

What Would An Army Optimized For Multi-Domain Battle Look Like?

Sketching Out Multi-Domain Battle Operational Doctrine

U.S. Army Updates Draft Multi-Domain Battle Operating Concept

U.S. Army Multi-Domain Operations Concept Continues Evolving

U.S. Army Doctrine and Future Warfare