Category Middle East

Current Deployment of Patriot Missile Battalions

Our air defense artillery assets consists of Patriot, THAAD (Terminal High Altitude Area Defense) and the SHORAD (Short Range Air Defense) battalions and batteries, among other elements.

A Patriot Missile Battalion consists of four or five Patriot Missile Batteries. A Patriot Missile Battery consists of four or six launchers, each with four missiles. The United States has 16 Patriot battalions. There is one battalion in Germany and three battalions in South Korea and I gather at least one battery in the Gulf (not sure which). I gather the most elements of the other 11 battalions are in the U.S. As of 2010 it was reported that the U.S. Army operates a total of 1,106 Patriot launchers (1,106/16 = 60 launchers per battalion). According to a count developed from multiple open sources, our air defense battalions and batteries are located at:

Baumholder, Germany

5th Battalion, 7th Air Defense Artillery Rgt (Patriots)

5th Battalion, 4th Air Defense Artillery Rgt (equipped with 36 Avenger SHORAD systems, with 36 in prepositioned storage).


Fort Bliss, Texas:

1st Battalion/43rd Air Defense Artillery Rgt (Patriot)

2nd Battalion/43rd Air Defense Artillery Rgt (Patriot)

3rd Battalion/43rd Air Defense Artillery Rgt (Patriot)

5th Battalion/52rd Air Defense Artillery Rgt (Patriot)

Battery A, 2nd Air Defense Artillery Rgt (THAAD)

Battery B, 2nd Air Defense Artillery Rgt (THAAD)

Battery E, 3rd Air Defense Artillery Rgt (THAAD)

Battery A, 4th Air Defense Artillery Rgt (THAAD)


Guam:

Battery A, 5th Air Defense Artillery Rgt (THAAD)


Fort Sill, Oklahoma

3rd Battalion, 2nd Air Defense Artillery Rgt (Patriot)

4th Battalion, 3rd Air Defense Artillery Rgt (Patriot)

5th Battalion, 5th Air Defense Artillery Rgt (Counter Rocket Artillery and Mortar)

2nd Battalion, 6th Air Defense Artillery Rgt (C-RAM, Sentinal, Stinger/Avenger)

3rd Battalion, 6th Air Defense Artillery Rgt (Patriot)


Fort Hood, Texas

4th Battalion, 5th Air Defense Artillery Rgt (Patriot)

1st Battalion, 44th Air Defense Artillery Rgt (Patriot)

1st Battalion, 62nd Air Defense Artillery Rgt (Patriot)


Fort Bragg, North Carolina

3rd Battalion, 4th Air Defense Artillery Rgt (Patriot/Avenger?)

1st Battalion, 7th Air Defense Artillery Rgt (Patriot)


Fort Campbell, Kentucky

2nd Battalion, 44th Air Defense Artillery Rgt  (Counter Rocket Artillery and Mortar)


Suwon Air Base, South Korea

6th Battalion, 52nd Air Defense Artillery Rgt (Patriot)

2nd Battalion, 1st Air Defense Artillery Rgt (Patriot)

D Battery, 2nd Air Defense Artillery Rgt (THADD)

1st Battalion, 1st Air Defense Artillery Rgt (Patriot)


Location unknown:

B Battery, 62nd Air Defense Artillery Rgt (THAAD) – activated 2016


This listing does not include National Guard units. It is also not definitive.

So Where are the Patriots?

We just got “shelled” by a dozen ballistic missiles fired from Iran to Iraq. These are the type of things that could be stopped by Patriot surface-to-air (SAM) missiles. Apparently we were given a heads up that the missiles were coming.

Not sure if we have any Patriot missile batteries deployed in Iraq. During the build up in May and June, we did deploy at least one Patriot battery to the Gulf. I assume they are still there defending facilities in the Gulf States. Do we have any Patriot missile batteries in Iraq?

Current U.S. and Allied Forces in the Gulf (mid-June 2019)

And:

Did The Patriot BMD Miss Again In Saudi Arabia?

One notes that the recent Iranian attack on the Saudi oil facilities on 14 September 2019 was not intercepted even though Saudi Arabia has six battalions of Patriot missiles and we also have at least one battery in the Gulf.

So did we have Patriots deployed in Iraq? If we did have them available, then did we decide not to use them?


P.S. (added at 1:40 9 Jan 2020): 3 Hours from Alert to Attacks

  1. We had a three hour alert
  2. There were no Patriot batteries deployed to protect the Ain Al-Asad base
  3. 16 missiles were fired at Ain Al-Asad base.

Size of Theater

Seeing how Iran and Iraq are back in the news (as I suspect so will be the Persian Gulf), let me just remind everyone the size of these “theaters.”

………………….Iraq………….Iran…………Persian Gulf……Texas……Lake Superior
Area (sq. km)…437,072……..1,648,195……251,000…………..696,241…….82,000

Population…….38,433,600…82,531,700……N/A……………..28,995,881…….N/A

GDP …………..$250 Billion…$458 Billion……N/A……………..$1,819 Billion….N/A

Texas is the second largest state in the U.S. (behind Alaska) and the second most populous state in the U.S. (behind California). Lake Superior is the largest fresh water lake in the world. Or to put it relative to Europe:

………………….Iraq……………Iran………..Persian Gulf…….France……..Baltic Sea
Area (sq. km)…437,072……….1,648,195…251,000……………551,695……..1,641,650

Population…….38,433,600……82,531,700….N/A………………64,834,000…….N/A

GDP ……………$250 Billion…$458 Billion….N/A………………$2,707 Billion….N/A

The area and population given is for “Metropolitan France,” meaning those parts of France that are in Europe.

Force Ratios in the Arab-Israeli Wars (1956-1973)

An Egyptian Su-100 in Suez City, 1973

We see a similar disparity in results between the Israeli Army and the various Arab armies they engaged. The Arab armies include Egyptian, Syrian, Jordanian and Iraqi. To simplify we have just lumped the engagements involving these four armies together, although we are certain that there differences between these various armies. The data includes two engagements from 1956, 16 from 1967, one from 1968 and 32 from 1973 for a total of 51 division-level engagements. None of the engagements were coded as “limited action” or “limited attack.”

This database of only 51 engagements has 33 Israeli attacks and 18 attacks by Arab armies. It produces similar lop-sided results:

Israeli Army attacking the Arab armies (33 cases)

Force Ratio………………….Percent Attacker Wins ………………..Number of Cases

0.54 to 0.97………………………81%……………………………………………..16

1.00 to 1.47………………………90………………………………………………..10

1.51 to 1.99…………………….100………………………………………………….2

2.04 to 2.17…………………….100………………………………………………….2

2.90……………………………….100………………………………………………….1

Gap in data

3.50 to 3.96………………………..0………………………………………………….1

4.11 to 5.87………………………..0………………………………………………….1


As can be seen, the Israeli’s are wining 81% of the time that they attack at odds of less the one-to-one. Out of the 33 engagements where they are the attackers, they lose four and draw two. They are winning 82% of the time. Most of their attacks (79% of them) are at low odds, between 0.54- to 1.47-to-one. They win these attacks 80% to 90% of the time. They have two defeats at high odds, but in both cases, they advanced during the battle. At Jebel Libni in June 1967 they attacked at 3.60-to-one odds and advanced five kilometers. The engagement is coded as a draw because the Egyptian forces were able to successfully withdraw, as they were intending, while the Israeli forces had to rest and regroup. Both sides claimed victory. At Abu Ageila in October 1956, thee Israelis attacked at 4.57 odds and advanced 15 kilometers. This three-day engagement was coded as a defeat because the Israeli mission was to advance to Port Suez to support the Anglo-French operations there, and they were effective delayed by the Egyptians. The outcome of the engagement was coded as “attack advances” even though is a defender victory based upon the mission accomplishment scoring. The data in these tables could change slightly depending on how one chooses to code or interpret the outcome of the engagements.

When the Arab armies attacked, the results were very different.

Arab armies attacking the Israeli Army (18 cases)

Force Ratio…………………….Percent Attacker Wins…………………Number of Cases

0.87……………………………………..0%………………………………………………..1

1.05……………………………………..0…………………………………………………..1

1.75 to 1.80…………………………..0…………………………………………………..2

2.22 to 2.25…………………………..0…………………………………………………..2

Gap in data

3.03 to 3.49…………………………..0…………………………………………………..2

3.50 to 3.96…………………………33…………………………………………………..3

4.11 to 5.87…………………………50…………………………………………………..4

6.06………………………………….100…………………………………………………..1

8.12 to 12.18……………………..100…………………………………………………..2


One notes that the Arab armies lose all engagements below 3.94-to-1. This is some ten of the 18 engagements. Overall, they win only one-third of the time (six engagements out of 18). All victories are at roughly four-to-one odds or higher and even then they win 71% of time. This cannot more sharply demonstrate the performance differences between some armies. This was also examined in my previous book, primarily looking at casualty exchange ratios.

Finally, there is a 1991 Gulf War, where the differences in the performance between the two armies were far greater than either the German army versus the Soviet Union in 1943, or the Israeli Army versus the various Arab armies. We have 11 engagements from the odds of 0.64- to 3.26-to-one. The U.S., UK and French win them all. We have four Iraq attacks from odds of 0.21- to 3.00-to-1. All the Iraqi attacks fail. The Gulf War is a very unusual case.

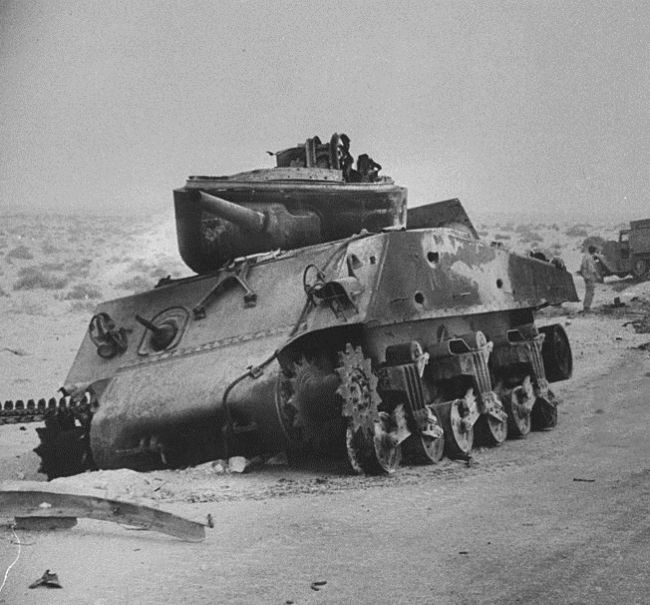
An Israeli M4A3 Sherman near Suez, 1973

Yemen, Saudi Arabia, Iraq and Iran

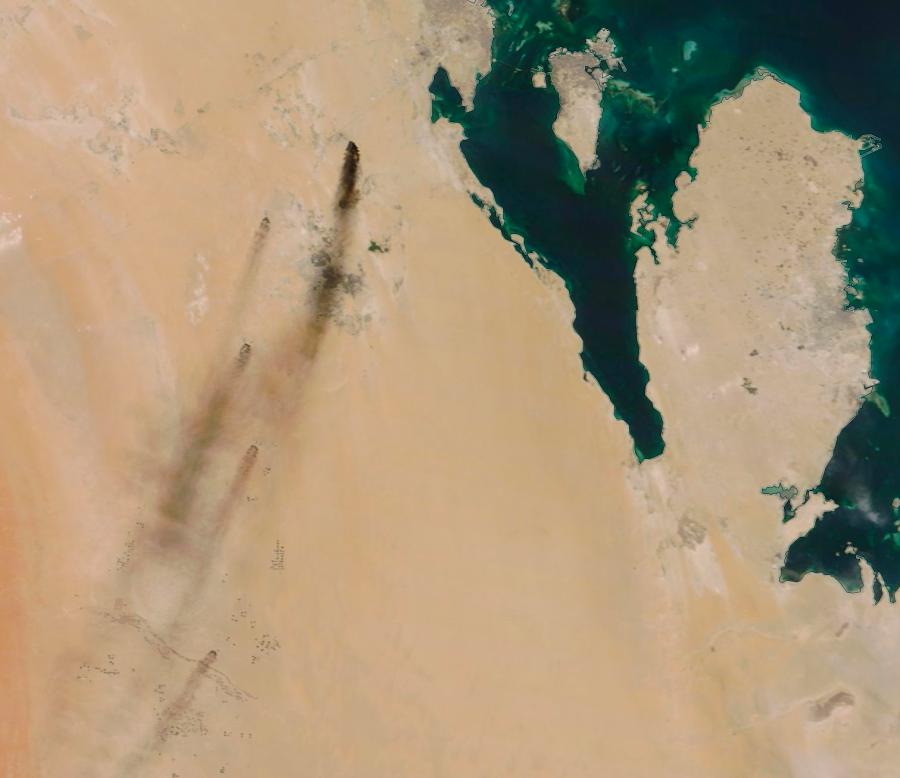
Saudi Fires From Outerspace (picture from NASA)

There are four countries have been in the news lately, intertwined in a complex little dance that had resulted in the temporary shutting down of 5% of the world oil production. Lets us look at the four countries for a moment:

………………………………………Iran……….Iraq……….Saudia Arabia……..Yemen
Population (millions)……………….83…………37……………..33………………….28
GDP (billions)……………………..484………..250……………762………………….28
Per Capita Income……………..5,820………6,116………..23,566………………..925
% Shiite……………………………..90+…………60…………10-15%…………….35-40%

Now, there are also five other states in and around the Persian/Arabian Gulf (Kuwait, Qatar, Bahrain, UAE and Oman. The most populous and richest of these is UAE with 9.6 million people and a nominal GDP of 433 billion. Some of these states, like Bahrain, are majority Shiite.

While there might be some retaliatory strikes in response, this simple comparison shows that:

  1. Iran is the big guy in the region.
  2. Saudia Arabia is probably not in position to wage war against Iran. It may conduct a military response, but nothing pushing towards something that looks like full-scale war.
    1. Especially as they do not have a common border except over the Gulf.

P.S. Based upon Purchasing Power Parity (PPP)

………………………………………Iran………..Iraq…………Saudia Arabia……..Yemen
GDP (billions)……………………….484…………250…………..762……………………28

Per Capita Income………………..5,820………6,116……….23,566………………….925

GDP PPP………………………….1,540…………734………..1,924……………………73

Per Capita Income………………18,504……..17,952………56,817………………..2,380


P.P.S. A related relevant earlier blog post:

Air Forces in the Persian/Arabian Gulf


Casualty Estimates for Conflict with Iran – Summation

Well, things in the Gulf have been quieter this last week. We ended up doing three posts related to the casualty estimates for a conflict in Iran. This was because part of President Trump’s decision making was based on an estimate of 150 killed if they struck Iran. This got my attention, because actually, hearing about casualty estimates before a conflict is kind of rare. We end up with three posts on the subject. The first post on subject speculated that President Trump was given a range of estimates, and that was probably the upper boundary of that range. The second post asked is that estimate was for killed or casualties? If is was killed, then were we looking at over 1,000 casualties from three air strikes?  The third post noted that casualty estimates for “evaluating wars” is not that common. This lead me to guess that no such estimate has been made for an extended conflict with Iran. An extended conflict with Iran could move beyond the Gulf to Iraq, Syria and Afghanistan.

Casualty Estimates for Conflict with Iran

Casualty Estimates for Conflict with Iran – Killed and Wounded

How Common are Casualty Estimates?

Anyhow, for the moment things are quiet and nothing has been resolved. We shall see what happens next.

Some other relevant post posts on casualty estimates:

Forecasting the Iraqi Insurgency

Forecasting U.S. Casualties in Bosnia

Assessing the TNDA 1990-91 Gulf War Forecast

Assessing the 1990-1991 Gulf War Forecasts

President Obama’s Casualty Estimates

Casualty Estimates for a War with North Korea

The CRS Casualty Estimates

How Common are Casualty Estimates?

I do note that several of the talking heads on TV have mentioned that providing a casualty estimate is standard practice when briefing for a military action. This may be the case, I have never been to one of those briefings. But….while casualty estimates for a single proposed operation may be common, my experience is that they are not that common when it comes to evaluating wars.

There were certainly multiple estimates done in 1990 for the 1991 Gulf War both inside and outside the Government. A number of estimates were high and many have never been publicly released. I have yet to have seen any systematic analysis of the casualty estimates done for the Gulf War. Most of these were based upon combat models, so as such, serve as a validation test for these combat models. Wikipedia used to have a discussion on this issue, but it has since disappeared. Needless to say, the estimate derived from a combat model made before a war is probably something that would be very telling. The fact that DOD never conducted an analysis after the war of the various estimates is also very telling.

Now, we did do an estimate in fall of 1995 for a Bosnia peacekeeping operation (the Dayton conference ended with a peace agreement in November 1995). This was the only estimate done for this operation. According to rumor, the Joint Chiefs of Staff asked the Deputy Under Secretary of the Army for Operations Research (DUSA-OR) if they could do such an estimate, and were told that there was no methodology to estimate casualties in an Operation Other Than War (OOTW) (see page 309, America’s Modern Wars). So The Dupuy Institute ended up doing such an estimate, and we did it based upon two different methodologies (see Appendix II, America’s Modern Wars).

As far as I know, we were also the only people who did an estimate in 2004/2005 for the cost and duration of an extended guerilla war in Iraq. Some one else may have done some work on duration, as I kept hearing the statement made that guerilla wars lasted an average of ten years. I could never tell if that figure was pulled from our work or if someone else did some similar work. Regardless, I think we were the only people who did an analytically based casualty estimate of the war. See Chapter 1, America’s Modern Wars.

Now, when I was writing America’s Modern Wars, I decided to look into what estimates had been made in the first half of the 1960s for the war in Vietnam. I really could not find anything analytical, although my search was not exhaustive (meaning I am still waiting for someone to prove me wrong). But, it does not appear that any analytically based estimate was made during the 1960s for casualties and duration for what turned into America’s third bloodiest and second longest war. See pages 4, 29-30, America’s Modern Wars.

So, there appears to have been an estimate done for the casualties for a strike on Iraq (although I doubt it will be made public). On the other hand, it is doubtful if anyone has done an estimate for the full range of options, or addressing the Iranian counter-options, or examining an extended conflict with Iran. This would certainly have to address the range of counter-strikes and other options available to Iran if such a conflict further developed. For various reasons, the DOD seems hesitant to do these types of estimates.

Now, I happen to think our decision makers would be better served if they indeed did have some estimates of casualties and duration of these conflicts when they were contemplating their options. They were not done for the Vietnam War, only one estimate was done for Bosnia and I think only one estimate was done for the continuing war in Iraq. I am guessing, based upon that track record, no such estimate has been made for an extended conflict with Iran.

Casualty Estimates for Conflict with Iran – Killed and Wounded

Sometimes in the discussion of casualties, people confuse the word “casualties” with killed. Casualties are all those people who are killed, wounded, missing or captured. It also sometimes includes Disease and Non-Battle Injuries (DNBI), or those injured or killed in accidents. For example, in the Mayaguez operation in 1975 there were 18 Marines killed in action, 3 Marines missing in action (and captured?) and 23 people killed in a helicopter accident before the invasion of Tang Island.

If you are doing a casualty estimate, it can either be based upon total killed (in combat or from all causes) and may include wounded. Depending on the combat situation and wounding agent, the number wounded is often between 3 to 10 per person killed (see War by Numbers, Chapter 15: Casualties). In the case of air to ground strikes, we would expect the wounded-to-killed ratio to be on the higher side. If there is good medical care, this also affects the wounded-to-killed ratio.

So, with President Trump mentioning an estimate of 150 killed, are we then looking at 600 to 1650 casualties (killed and wounded)? Were they really looking at over 1,000 casualties from the air strikes in three locales? That is hardly a “surgical air strike” to borrow a phrase from the Cuban Missile Crisis. It is possible that someone garbled the phrase killed and casualties. This has happened multiple times before.

Casualty Estimates for Conflict with Iran

I noted today, via tweet from President Trump, that “..when I asked, how many will die. 150 people, sir, was the answer from a General.”

Now, we have done a few casualty estimates for conflicts: 1) The 1991 Gulf War estimate done by Trevor Dupuy that was briefed to the House Armed Services committee in 1990 and was the source of his book If War Comes, 2)  the Bosnia casualty estimate that The Dupuy Institute did for the Joint Chiefs of Staff (JSC) in 1995. This is discussed in depth in Appendix II of America’s Modern Wars, and 3) The Iraq casualty estimate that we did in 2004 for Center of Army Analysis (CAA) and OSD Net Assessment. This is discussed in depth in the first Chapter of America’s Modern Wars. So, we know something about casualty estimation and actually have a documented, provable track record.

We have no idea what casualty estimation was done for a strike or conflict with Iran. We have not been involved in that. Most likely, if a properly developed casualty estimation was done, it was done with a range of results. For example, our Bosnia estimate was that in the case of an extended deployment (which is what was done) it was estimated that there was a 50% chance that U.S. killed from all causes in Bosnia in the first year would be below 17 (12 combat deaths and 5 non-combat fatalities) and a 90% chance U.S. killed would be below 25 (see page 308 in America’s Modern Wars).

So, I am guessing that President Trump was not told that there would be 150 killed, he was probably given a range of estimates, of which that was probably the upper boundary of that range. Still, these numbers get people’s attention. I gave a briefing one morning on our Iraq estimate after a three-day weekend…and as one colonel commented during the briefing “This is a hell of a briefing to wake up to after a long weekend.” (see page 18, America’s Modern Wars).

Current U.S. and Allied Forces in the Gulf (mid-June 2019)

USS Abraham Lincoln, May 19, 2019

Well, there has been a flare up in the Gulf of Oman yesterday. Don’t know if there has been any additional forces added over there. Nothing has been announced, although that does not mean additional forces have not been sent. The USNI Fleet Tracker for 10 June 2019 is still showing 21 ships there: https://news.usni.org/2019/06/10/usni-news-fleet-and-marine-tracker-june-10-2019

The destroyer USS Bainbridge (DDG-96) was in the news yesterday operating in the Gulf of Oman. As it was part of Carrier Strike Group 12, does that mean the carrier Abraham Lincoln is close by?

——old post from May 29, 2019————————————————————————-

Since 1990, the U.S. has always maintained a presence in and around the Persian/Arabian Gulf and Gulf of Oman. The UK also traditionally has a presence in the Gulf. Exactly what is there now?

In Iraq: 6,700+ U.S. and allied troops and supporting civilians

  1. Around 5,000 U.S. troops, primarily involved in training.
    1. As of 2017 the Pentagon has stopped providing the number of troops that are being deployed in Iraq citing security concerns.
    2. There are also probably U.S. civilians
  2. UK has 400 UK troops in non-combat roles and 1,000 civilians
    “supporting counter-daesh operations.”
  3. Germany has 160 soldiers
  4. Netherlands had 169 military and civilian staff
  5. Australia withdrew in 2018.

Kuwait:

  1. 10,000 troops in Kuwait (under CENTCOM?)

Bahrain:

  1. UK has a Type 23 frigate based there
  2. UK has four minesweepers based there.
  3. UK has a floating base.

Oman:

  1. Some British troops
  2. In March 2019, they performed a joint exercise with the Omani armed forces that included 5,500 British troops.

The Fifth Fleet:

  1. According to the USNI Fleet Tracker, they currently have 21 ships
    1. This includes the USS Abraham Lincoln and the Kearserge (see below).
  2. 10,000 troops in Qatar (command assumed to be Fifth Fleet)
  3. 1,000+ Marines aboard the Kearsarge
  4. There are probably a number of submarines in the area.

Sending to the Gulf as of new reports of 10 May and after:

  1. Carrier Strike Group 12
    1. USS Abraham Lincoln (CVN-72)
      1. 65-70 aircraft (Carrier Air Wing 7)
    2. USS Leyte Gulf (CG-55)
    3. Destroyer Squadron 2 with:
      1. USS Bainbridge (DDG-96)
      2. USS Mason (DDG-87)
      3. USS Nitze (DDG-94)
    4. sometimes submarines
    5. support vessels
    6. Passed through the Suez Canal on May 9.
      1. operating of the coast of Oman 16 May
  2. Amphibious Squadron 6
    1. USS Kearsarge (LHD-3)
    2. 22nd MEU (Marine Expeditionary Unit)
      1. A battalion+ of Marines
    3. USS Arlington (LPD-24)
    4. USS Fort McHenry (LSD-43)
    5. Off the coast of UAE near entrance to Gulf on 16 May
  3. One squadron of B-52s
    1. At Al Udeid Air Base in Qatar
      1. Pictures of them landing on May 9
    2. Others elsewhere in “southwest asia” (Al Dhafra Air Base in UAE?)
    3. Maybe 12-24 aircraft
    4. Aircraft from the 20th Bomb Squadron, Barksdale AFB, Louisiana
  4. One Patriot Missile Battalion
    1. Originally a Patriot battery in the reports of 10 May.
    2. Appears to include forces that were already in the Gulf who extended their deployment.
    3. Maybe 16 launchers of 4 missiles
  5. Two U.S. destroyers entered the Persian Gulf on May 16
    1. USS McFaul (DDG-74)
    2. USS Gonzalez (DDG-66)
  6. Added to the deployed on 24 May
    1. One fighter squadron
    2. Reconnaissance and surveillance aircraft
    3. around 900 troops while another 600 are retained in the Gulf.

This listing was quickly cobbled together from open sources. It should not be quoted without verification.