Category Methodologies

Economics of Warfare 13-3

This is the third and last posting on the thirteenth lecture from Professor Michael Spagat’s Economics of Warfare course that he gives at Royal Holloway University. It is posted on his blog Wars, Numbers and Human Losses at: https://mikespagat.wordpress.com/

My first post on his lecture did not get past his second page as I ended up pontificating about his two rather significant statements on data. They were:

  1. To get anywhere with empirical research you need to have a reasonably large number of data points. (This is a basic fact about empirical analysis that many students beginning research projects overlook)
  2. So we need to ask ourselves — where are all of these data points going to come from?

My second post covered the part when he looked at Colombia. The rather interesting conclusion from that was (slide 18): “Dube and Vargas [the study authors] calculate that the fall in coffee prices between 1997 and 2003 translates into an additional 1013 deaths in coffee growing areas….”

On slide 26 of his lecture he starts an examination of a study done by Blazzi and Blattman that does a cross-country approach examining changes in commodity prices to analyze the impact of income on armed conflict (and although Dr. Spagat is American…he has disciplined himself to spell it “analyse” in the British fashion).

The next slide (slide 26) talks about three facets of their work, looking at 1) opportunity cost (making a decent living vice rebelling), 2) state capacity, and 3) state prize. This last idea caught my attention because it harkens back to the work of Feierabend & Feierabend and Ted Gurr. In their seminal work done in the 1960s on causes of revolution they found that political violence was less in really poor countries than in developing countries. Here they are looking whether a state is so poor that there is no incentive to rebel because of the small “prize” you will win if you succeed. Certainly a viewpoint more in line with an economists’ training. I believe Feierabend & Feierabend (a political scientist and psychologist if I remember correctly) concluded that if you are struggling to survive in a poor country, this may take priority. Political revolt is luxury afforded by a developing economy (for example, the Russian economy before World War I). I am not sure I buy into the “state prize” explanation. I don’t really think people revolt for profit.

The next slide (slide 27) is also interesting, as it talked about 1) conflict onset, 2) conflict ending and 3) conflict intensity. As Dr. Spagat states: “Many people mix these things together so this attention to detail is welcome.” These first two points go back to areas I wanted to examine with our insurgency studies which was (to quote myself):

First, future analysis should be clearly focused, so that it addresses one of the three distinct time frames:
a. Before an insurgency starts (pre-insurgency)
b. In the early stages of an insurgency (proto-insurgency)
c. As an insurgency has clearly developed (developed insurgency)
(see Chapter 24: “Where Do We Go From Here” in American’s Modern Wars, pages 294-298)


And of course, withdrawal and war termination (see Chapter 19: “Withdrawal and War Termination” in AMW, pages 237-242).

Needless to say, we could never locate budget to examine the early stages of an insurgency (pre-insurgency and proto-insurgency) or examine how they end (which in 2008…I thought was kind of an important subject)..

Anyhow, the results from the Blazzi and Blattman study are summarized in the next slides. In short they are:
“…suggests that there is no connection between price shocks to exports on the onset of armed conflict (or coups)”
“…weak evidence…that positive export price shocks help to end wars…”
“…rather weak evidence…that positive export price shocks help to decrease (a lot) the number of battle deaths in ongoing wars.”
“The opportunity cost and state capacity ides do get some support.”
“The state prize idea gets no support at all” (and this is really not surprising, as I thought that construct was kind of “batty” to start with…Lenin was not in it for the money)


Anyhow, all great stuff. The link to the lecture is here: http://personal.rhul.ac.uk/uhte/014/Economics%20of%20Warfare/Lecture%2013.pdf

Economics of Warfare 13-2

Continuing the examination today of the thirteenth lecture from Professor Michael Spagat’s Economics of Warfare course that he gives at Royal Holloway University. It is posted on his blog Wars, Numbers and Human Losses at: https://mikespagat.wordpress.com/

My last post didn’t get past his second page as I ended up pontificating about his two rather significant statements on data. They were:

  1. To get anywhere with empirical research you need to have a reasonably large number of data points. (This is a basic fact about empirical analysis that many students beginning research projects overlook)
  2. So we need to ask ourselves — where are all of these data points going to come from?

The lecture then looks in depth at one country: Colombia. He ends up looking at a paper that measured “commodity prices” compared to civil intensity. They looked at two issues 1) Do higher wages reduce conflict in coffee-growing municipalities (as measured by increased prices in coffee) and 2) does wealth attract violence from armed groups (as measure by oil prices in those municipalities that have oil).  Anyhow, they do find higher levels of violence in coffee growing regions compared to other regions during the time when international coffee prices fell. It also indicated that increases in oil prices did lead to some higher levels of violence for the paramilitaries in Colombia, but these effects were not very large. The rather interesting conclusion (slide 18) is “Dube and Vargas [the study authors] calculate that the fall in coffee prices between 1997 and 2003 translates into an additional 1013 deaths in coffee growing areas….”

Hmm…..I wonder if any of this could apply to growing opium poppies in Afghanistan?

Anyhow, still not finished with this particular lecture, and will pick up discussing the rest of it later. The link to the lecture is here: http://personal.rhul.ac.uk/uhte/014/Economics%20of%20Warfare/Lecture%2013.pdf
Economics of Warfare 13 – 1

Hope you all have your taxes done….speaking of economics. Anyhow, picking back up on the Economics of Warfare posts by Dr. Spagat. The good news is that these blog posts by me apparently inspired (read: forced) Dr. Spagat to post all 20 of his excellent Economics of Warfare course lectures on his blog.

Starting an examination today of the thirteenth lecture from Professor Michael Spagat’s Economics of Warfare course that he gives at Royal Holloway University. It is posted on his blog Wars, Numbers and Human Losses at: https://mikespagat.wordpress.com/

The lecture looks in depth at one country, Colombia. Dr. Spagat has done a lot of work there, and even helped set up a non-profit to analyze the Colombian civil wars. These have been the bloodiest series of conflicts in the western hemisphere in the period after World War II. It was through his work on Colombia, and our related work on insurgencies, that we first became acquainted.

Slide two of his lecture starts with the statement that: “To get anywhere with empirical research you need to have a reasonably large number of data points. (This is a basic fact about empirical analysis that many students beginning research projects overlook)”

Actually, it is a basic fact that many in the Army and Defense operations research community overlook!!! I remember getting into discussion with a senior OR practitioner, a retired corporate president who once shared an office with Geroge Kimball of Morse and Kimball fame (Methods of Operations Research, 1951), who tried to make the argument that all you need to 15 good data points. This was at the time we were doing the Bosnia Casualty estimate (see America’s Modern Wars, Appendix II). Needless to say, I strongly disagreed, especially as we were looking at “social science” type data.

The next line in Dr. Spagat’s presentation is: “So we need to ask ourselves — where are all of these data points going to come from?”

This is the issue, and quite simply, the gap that The Dupuy Institute has attempted to fill. For example, Dorothy Clark’s seminal study on Breakpoints (Force Changes to Posture) was based upon only 43 cases [Dorothy K. Clark, Casualties as a Measure of the Loss of Combat Effectiveness of an Infantry Battalion (Operations Research Office, Johns Hopkins University, 1954]. This is not a lot of data points, which of course, she understood. But, producing “data points” requires research, which takes time and money. There are some existing databases publically available that can help with some problems, but for many problems, there is simply not enough data points assembled for any meaningful analysis. There does not seem to be the mechanism in place to make sure that the Army or DOD has the data that it needs for all of its analytical work.

After starting page 2 with two rather significant statements, Dr. Spagat then goes into discussing Colombia in more depth. I will pick this up in a post tomorrow, as this blog post has already gotten long (and preachy).

The link to the lecture is here: http://personal.rhul.ac.uk/uhte/014/Economics%20of%20Warfare/Lecture%2013.pdf

Classics of Infoporn: Minard’s “Napoleon’s March”

Map from “Cartographies of Time” courtesy of Princeton Architectural Press.

We at the The Dupuy Institute love infoporn, those amazing, information-laden graphics that at once render dense, complex topics instantly understandable to the masses. Wired, Jalopnik, and Gizmodo have tags dedicated to sharing the best examples of it. Wiktionary defines infoporn as “Information which does not serve a purpose other than to hold the attention of its audience; information for information’s sake.” Perhaps so, but we at TDI feel that beauty is in the eye of the beholder.

Betsey Mason, a co-author of National Geographic‘s All Over The Map blog, has a profile of one of the greatest purveyors of infoporn, Charles Minard. Minard created what is considered by many to be the iconic work of information graphics, “Napoleon’s March,” or “the Minard graphic.” Created in 1869, Minard’s map depicts Imperial France’s doomed 1812-13 invasion of Russia. It traces the advance and catastrophic retreat of Napoleon Bonaparte’s Grande Armee, while simultaneously showing its gradually dwindling manpower. At age 88, Minard conveyed an essential understanding of the subject with an imaginative combination of spacial and quantitative information that continues to resonate and astonish nearly a century and a half later.

As Mason writes,

Today Minard is revered in the data-visualization world, commonly mentioned alongside other greats such as John Snow, Florence Nightingale, and William Playfair. But Minard’s legacy has been almost completely dominated by his best-known work. In fact, it may be more accurate to say that Napoleon’s March is his only widely known work. Many fans of the March have likely never even seen the graphic that Minard originally paired it with: a visualization of Hannibal’s famous military campaign in 218 BC, as seen in the image [above].

Go check out the full article and marvel at the power of infoporn.

Logistics in Trevor Dupuy’s Combat Models

Trevor N. Dupuy, Numbers, Predictions and War: Using History to Evaluate Combat Factors and Predict the Outcome of Battles (Indianapolis; New York: The Bobbs-Merrill Co., 1979), p. 79

Mystics & Statistics reader Stiltzkin posed two interesting questions in response to my recent post on the new blog, Logistics in War:

Is there actually a reliable way of calculating logistical demand in correlation to “standing” ration strength/combat/daily strength army size?

Did Dupuy ever focus on logistics in any of his work?

The answer to his first question is, yes, there is. In fact, this has been a standard military staff function since before there were military staffs (Martin van Creveld’s book, Supplying War: Logistics from Wallenstein to Patton (2nd ed.) is an excellent general introduction). Staff officer’s guides and field manuals from various armies from the 19th century to the present are full of useful information on field supply allotments and consumption estimates intended to guide battlefield sustainment. The records of modern armies also contain reams of bureaucratic records documenting logistical functions as they actually occurred. Logistics and supply is a woefully under-studied aspect of warfare, but not because there are no sources upon which to draw.

As to his second question, the answer is also yes. Dupuy addressed logistics in his work in a couple of ways. He included two logistics multipliers in his combat models, one in the calculation for the battlefield effects of weapons, the Operational Lethality Index (OLI), and also as one element of the value for combat effectiveness, which is a multiplier in his combat power formula.

Dupuy considered the impact of logistics on combat to be intangible, however. From his historical study of combat, Dupuy understood that logistics impacted both weapons and combat effectiveness, but in the absence of empirical data, he relied on subject matter expertise to assign it a specific value in his model.

Logistics or supply capability is basic in its importance to combat effectiveness. Yet, as in the case of the leadership, training, and morale factors, it is almost impossible to arrive at an objective numerical assessment of the absolute effectiveness of a military supply system. Consequently, this factor also can be applied only when solid historical data provides a basis for objective evaluation of the relative effectiveness of the opposing supply capabilities.[1]

His approach to this stands in contrast to other philosophies of combat model design, which hold that if a factor cannot be empirically measured, it should not be included in a model. (It is up to the reader to decide if this is a valid approach to modeling real-world phenomena or not.)

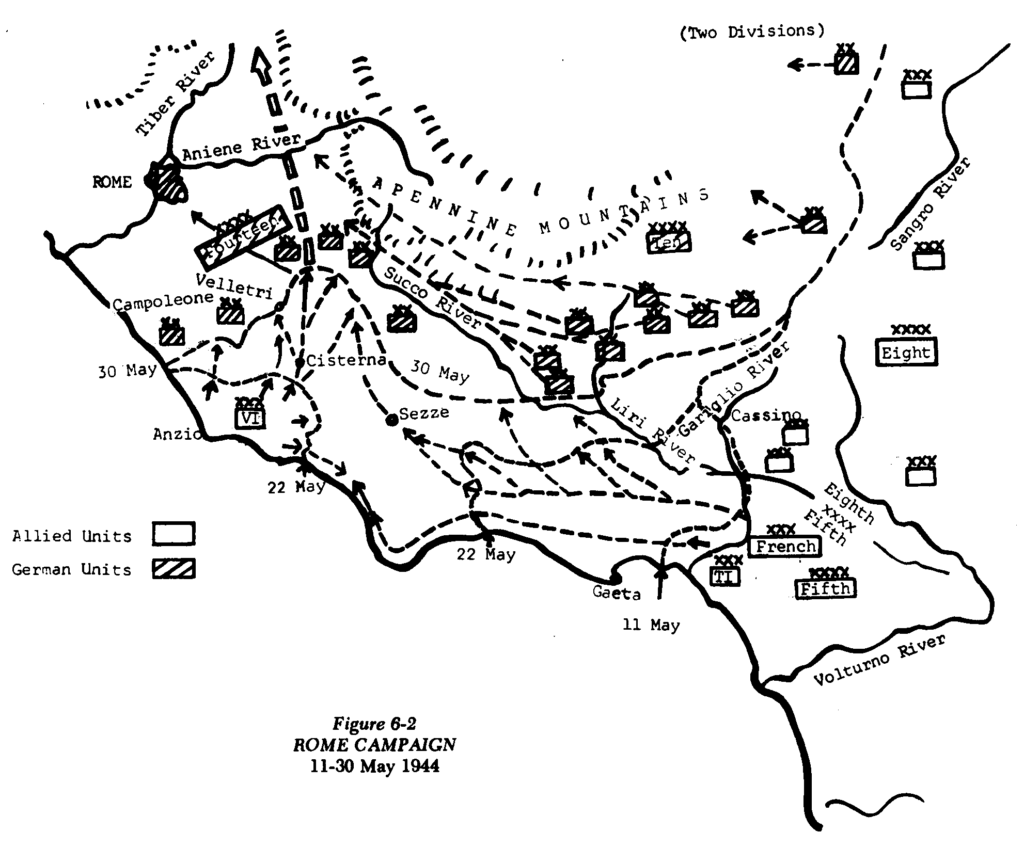
Yet, as with many aspects of the historical study of combat, Dupuy and his colleagues at the Historical Evaluation Research Organization (HERO) had taken an initial cut at empirical research on the subject. In the late 1960s and early 1970s, Dupuy and HERO conducted a series of studies for the U.S. Air Force on the historical use of air power in support of ground warfare. One line of inquiry looked at the effects of air interdiction on supply, specifically at Operation STRANGLE, an effort by the U.S. and British air forces to completely block the lines of communication and supply of German ground forces defending Rome in 1944.

Dupuy and HERO dug deeply into Allied and German primary source documentation to extract extensive data on combat strengths and losses, logistical capabilities and capacities, supply requirements, and aircraft sorties and bombing totals. Dupuy proceeded from a historically-based assumption that combat units, using expedients, experience, and training, could operate unimpaired while only receiving up to 65% of their normal supply requirements. If the level of supply dipped below 65%, the deficiency would begin impinging on combat power at a rate proportional to the percentage of loss (i.e., a 60% supply rate would impose a 5% decline, represented as a combat effectiveness multiplier of .95, and so on).

Using this as a baseline, Dupuy and HERO calculated the amount of aerial combat power the Allies needed to apply to impact German combat effectiveness. They determined that Operation STRANGLE was able to reduce German supply capacity to about 41.8% of normal, which yielded a reduction in the combat power of German ground combat forces by an average of 6.8%.

He cautioned that these calculations were “directly relatable only to the German situation as it existed in Italy in late March and early April 1944.” As detailed as the analysis was, Dupuy stated that it “may be an oversimplification of a most complex combination of elements, including road and railway nets, supply levels, distribution of targets, and tonnage on targets. This requires much further exhaustive analysis in order to achieve confidence in this relatively simple relationship of interdiction effort to supply capability.”[2]

The historical work done by Dupuy and HERO on logistics and combat appears unique, but it seems highly relevant. There is no lack of detailed data from which to conduct further inquiries. The only impediment appears to be lack of interest.

NOTES

 [1] Trevor N. Dupuy, Numbers, Predictions and War: Using History to Evaluate Combat Factors and Predict the Outcome of Battles (Indianapolis; New York: The Bobbs-Merrill Co., 1979), p. 38.

[2] Ibid., pp. 78-94.

[NOTE: This post was edited to clarify the effect of supply reduction through aerial interdiction in the Operation STRANGLE study.]

Economics of Warfare 12

Examining the twelfth lecture from Professor Michael Spagat’s Economics of Warfare course that he gives at Royal Holloway University. It is posted on his blog Wars, Numbers and Human Losses at: https://mikespagat.wordpress.com/

This paper continues with discussion of the studies done by Fearon and Laitin (lecture 11, slide 5) and Collier and Hoeffler (lecture 11, slide 15) on civil wars. The lecture basically goes through and tests or challenges their papers in two areas: 1) ability to predict, and 2) causality.

Warning: This lecture may cause you to lose confidence in multi-variant regression models.

I already had. If you go to my book America’s Modern Wars, in Chapter 6 (pages 63-69) I propose a two-variable model of insurgency success or failure. I then tested the model back to the cases I used to make up the model and the model predicted the correct result in 53 out of 68 cases used (77.9%). The model predicted incorrectly in 15 cases, or over 20% of the time. Now, if I was at a blackjack table in Vegas, I would be pretty damn happy to predict the outcome of game almost 80% of the time. The problem I had is that I could not find a clear third variable. I could easily explain away why 7 of the 15 cases were incorrectly predicted, although they were for a variety of reasons; but I could not easily explain why the other 8 cases were incorrectly predicted. In three of the cases the model predicted a red win (insurgents won) when the blue side won (the counterinsurgents); and in four of the cases the model predicted a blue win when the red side won (page 67). There was clearly a third, fourth or fifth variable in play here, but I could never figure out exactly what it was, and it was probably multiple variables. This was the next step and would have been pursued further if we could have obtained further funding.

Of course, we could have just added three or more additional variables to the model and this would have certainly improved the fit….but what are we really doing? This is the point where I begin to loose confidence in adding more variables, so I choose not to.

Getting back to Dr. Spagat’s lecture, one person analyzed the two papers by Fearon and Laitin (called FL) and Collier and Hoeffler (called CH) as to their predictive value. They were not very good at prediction, and sometimes gave false predictions (slide 6). Note that the “false positives” outnumbered the correct predictions for the Collier and Hoeffler model.

On slide 10, Dr. Spagat shows the variables used in each model and how much each variable impacts the results. You will note that one to three variables in each model provide far more explanatory value than the rest of the variables. GDP sort of stands out in both models, although one uses GDP while the other uses GDP growth, which are very different values. There are also some odd variables in there (for example using “squared commodity dependence” in addition to using “commodity dependence” in one model).

Dr. Spagat then goes into the issue of causality, ending up with a discussion on rainfall. Unfortunately, the real world is more complex than the models. A regression model assumes that the inputs are “independent” variables and the output is a “dependent” variable. Yet, in the real world, there can be another variable out there that is influencing both the “independent” and the “dependent” variable. Also, the alleged “dependent” variable can sometimes influence the independent variables. This he discusses in slide 12 (“This is, while it is true that low or negative growth might cause conflict is also true that conflict might cause low or negative growth.”).

Note that Dr. Spagat does address using different measurements of variables in slide 22 (rainfall levels vice growth rates in rainfall). This is an issue. Does one use an independent variable with an clear value (like a GDP figure) or does one use the change in the value of the variable over time as the measure (like percent change in GDP)?

The link to the lecture is here: http://personal.rhul.ac.uk/uhte/014/Economics%20of%20Warfare/Lecture%2012.pdf


Country Size

This is a continuation of my previous post: Economics of Warfare 11. It is based upon a review of Michael Spagat’s lecture: http://personal.rhul.ac.uk/uhte/014/Economics%20of%20Warfare/Lecture%2011.pdf

The Fearon and Laitin study on the “Determinants of Civil War Onset” (link to paper on slide 5) had eight factors that influenced that chance of a new civil war (they are listed on slides 8 and 10). One of them is “population (positive effect)”. This is summarized by Michael Spagat as “more people, more chances for war.” The Collier and Hoeffler paper came to similar conclusions on this (link to paper on slide 15). As Michael Spagat summarizes it “Population size is still positive and significant” (slide 16). And then there is a third paper by Hegre and Sambanis (like to paper on slide 23) that states that “country size (population and territory) is positively associated with civil war onset” (slide 24).

Now when we did our insurgency studies we also saw the same thing as it related to winning or losing an insurgency. It show up in our Iraq Casualty Estimate (see America’s Modern Wars, Chapter 1) and in subsequent analysis. Quite simply, insurgencies in large countries were often successful. For example, when we looked at all 10 insurgencies with foreign intervention where the indigenous population was greater than 9 million, the insurgents won 80% of the time (see page 47). In our original Iraq estimate for the cases we had, we found the insurgencies won 71% of the time in large countries (290,079-2,381,740 square kilometers…14 cases); 100% of the time in populous countries (population of 9,529,000 or higher…7 cases); and 78% of time in countries with a large border (which is probably related to country size). This is on pages 17-18.

Apparently size matters when it comes to violence. I am not sure of the cause-and-effect here. Obviously, there are many other factors at play. The Symbonese Liberation Army (SLA)…the people who kidnapped Patty Hearst…were a small urban insurgency operating in a large populous country (the United States). It fizzled quickly. So, it certainly does not mean any insurgency in any large place is an issue. But, there does seem to be some correlation here that continues to haunt analysis of insurgencies and the onset of civil war (which are two different subjects, but somewhat related).

Economics of Warfare 11

Examining the eleventh lecture from Professor Michael Spagat’s Economics of Warfare course that he gives at Royal Holloway University. It is posted on his blog Wars, Numbers and Human Losses at: https://mikespagat.wordpress.com/

This lecture discusses analysis of cross-country datasets, correlations, and then discussed some problems with statistical testing in general. This is worth reading carefully in its entirety.

The datasets they are discussing in the first slides I assume are from the “correlates of war” (COW) dataset, a publically available data set that many in academia have used. We have never used it. When we created the MISS (Modern Insurgency Spread Sheets…now called DISS), we built them entirely from our own research.

He then looks at two different studies on the probability of conflict, one done by Fearon and Laitin (slide 5) and the other done by Collier and Hoeffler (slide 15). Even though they are based upon the same data, they produced somewhat different results (all, of course, to 90% or 95% confidence intervals). He summarizes the conclusions of the Fearon and Laitin study on slides 8 and 10 and the conclusions to the Collier and Hoeffler study on slides 16 and 18. It is worth comparing the differences.

Throughout this paper, he starts giving warnings about the problems with this analysis. First he discusses “story lines” on slides 12 – 14. This is important. One you have a correlation….then most people are clever enough to be able to explain why such a correlation exists, be it right or wrong.

But the part of the lecture that hit home with me starts with the statement that “These reported results may just have come out out that way by luck or chance.” (slide 20). The cartoon on slide 22 makes the point. Basically, if you test 20 different things, even if they are completely irrelevant, even to a 95% confidence interval; then with average luck you will get at least one correlation! Test enough things, and you will get a correlation. By the same token, add enough variables to your regression model and you will get a fit.

This is done all the time and I did discuss it in America’s Modern Wars, page 73-75 on a study done by CAA (Center for Army Analysis) in 2009 using our MISS. As I note in the book they identified 34 variables and then built a regression model based upon 11 of them and then boiled the final model down to four: 1) Number of Red Factions, 2) Counterinsurgent per Insurgent Ratio (Peak), 3) Counterinsurgent Developed Nation and 4) Political Concept. As their model was based on force ratio and political concept, it was similar to my regression model, except they added two more variables to the model. The problem is that one of those variables, “Number of Red Factions,” should not have been added. As I note in my book “In our original research we did not systematically and rigorously establish a count of factions for insurgency…. It should not have been used as a variable without further research.”

To continue from my book: “My fear it that this variable (“number of factions”) worked in their regression model because it was helping to shape the curve even though there is not a clear cause-and-effect relationship here. Also, because of the methodology they choose, which was establishing variables based upon statistical significance, as opposed to there being a solid theoretical basis for it, then I believe that statistically there should be around two ‘false’ correlations among those 11 variables.”

I end up concluding: “My natural tendency as a modeler was to make sure I had clearly identified cause-and-effect relationships before I moved forward. That is why my approach starts simply (two variables) and moves forward from there. It is also why I independently examined each possible variable in some depth. In addition, I reviewed and examined a range of theorists before proceeding (see Chapter Seventeen). I have had the experience of dumping lots of variables into a regression model, and lo-and-behold, something fits. It is important to make sure you have clearly established cause-and-effect.”

Anyhow, what Dr. Spagat warns of on slide 22 is what some people are actually doing. It is not a mistake made by grad students, but a mistake that a professional DOD analytical organization has done.

Enough preaching; the link to the lecture is here: http://personal.rhul.ac.uk/uhte/014/Economics%20of%20Warfare/Lecture%2011.pdf


Economics of Warfare 10

Examining the tenth lecture from Professor Michael Spagat’s Economics of Warfare course that he gives at Royal Holloway University. It is posted on his blog Wars, Numbers and Human Losses at: https://mikespagat.wordpress.com/

This lecture starts with a discussion of coups and assassinations, specifically focusing on a study of “CIA-supported coups.” There are five of them: Iran (1953), Chile (1973), Guatemala (1954), Congo (DRC) (1960) and Cuba (1961). All of these are over 40 years ago.  The chart on page 4, listing some of our nefarious operations is worth a glance. I find it curious that “Project Camelot” is listed, which was simply a research project done being done by the Special Operations Research Office (SORO) that got bad press. A timeline for the five coups are provided on slide 6. Of course, being economists, they tie all these events to stock prices. Still, it is worth looking at slide 8, discussing some points related to the Guatemala coup, as is the following slide, listing expropriated companies. They then look at the effects of secret coup authorizations on stock returns (hey, I thought they were secret !!!). The kicker is slide 16 “The results suggest that US foreign policy was operating as a tool of a handful of private companies and the individuals involved were profiteering off their influence on the US government.” Having never really analyzed this issue myself, I am hesitant to comment on it.

On slide 17 they switch to a study on assassinations. On slide 19 it is stated they came up with 298 assassination attempts since 1875 (to 2002) of which 59 were successful and 47 were not “serious attempts.” So, 23.5% of serious attempts succeed? How many times did they try to assassinate French president Charles De Gualle? Oh, and 55% of them were done by gun, 31% by explosive device (slide 20). Guns succeeded 31% of time, while explosive devices only succeeded 7% of the time. The “other category,” which apparently includes “stoning” succeeded 44% of the time! Slide 23 provides assassination attempts (and successes) over time, with World War II (1939-1945) being a particularly peaceful period of time (as far as assassinations go). The presentation then goes into a long discussion on the impact of assassinations on war, with their conclusions presented on slide 33. Basically it is 1) “There is some evidence that having a successful assassination attempt rather than a failed one increase the probability that an intense war will end.” and 2) “There is evidence that having a successful assassination attempt rather than a failed one increases the probability that a moderate war will turn into an intense war.” So….might work for you, might work against you?

In my book America’s Modern Wars, we do briefly discuss decapitating insurgencies (page 151-153). We also did not come up with a clear answer. We only had about dozen cases to look at, and of the four we examined in depth, in all cases the insurgency still won. Our conclusions were (page 153): “Now this is not to say we should not go after insurgent leadership when we have the chance. We obviously should. But, it is to stress that you should be careful about giving ‘decapitation’ too much importance as a strategic answer to your counterinsurgent problem.” and “Still, if you have the means to try decapitation, it is important to do so in such a way that you do not kill civilians or give them propaganda tools that they can use. In the end, if you are losing the propaganda war while you are trying to decapitate, then you are working against yourself.”  

The link to the lecture is here: http://personal.rhul.ac.uk/uhte/014/Economics%20of%20Warfare/Lecture%2010.pdf

Economics of Warfare 9

Examining the ninth lecture from Professor Michael Spagat’s Economics of Warfare course that he gives at Royal Holloway University. It is posted on his blog Wars, Numbers and Human Losses at: https://mikespagat.wordpress.com/

This lecture opens with a discussion on government bond markets and World War II. As a military historian, this is not an approach I ever considered. Slide 3 is interesting. There is a noticeable decline in French government bond prices in the months leading up to May 1940 (the month the Germans actually invaded France). There is then a rather abrupt break in the graph.

Starting with slide 5 Dr. Spagat goes into a discussion of Angola and Jonas Savimbi (just to refresh your memory: https://en.wikipedia.org/wiki/Jonas_Savimbi). The interesting result is that (slide 19), the end of the Savimbi rebellion (as determined by the date of his death) “…was bad for the diamond companies operating in Angola”….and interestingly enough (slide 23): “An important conclusion from the study is that it might be wrong to assume that businesses operating in war-torn countries and the government officials in these countries are all automatically in favor of pace. Influential actors may actually benefit economically from the continuation of a war.”

Dr. Spagat these switches to the ETA and the Basque Independence Movement in Spain (slide 24). This was a very small movement (see slide 25). The conclusion (slide 33) is that “…terrorism has been costly for the Basque region of Spain.”

Then Dr. Spagat switches gears to comparing European economic growth to Chinese economic growth (slide 34) over the course of around 1800 years. This is using Angus Maddison’s figures, which was an effort to measure the world economy by country over the course of history. I just happen to have a copy of his book, The World Economy, sitting on my desk. Strongly recommend everyone own a copy. Anyhow, the discussion from slide 35-38 addresses a hypothesis by Voightlander and Voth (their paper is linked on slide 35) that “They claim that Europe had a lot more wars than China did and that this actually explains why Europe grew more than China.” I am not sure I buy into this suggestion, and am I not sure that Dr. Spagat does either, but it is an interesting viewpoint.

Anyhow, not sure what the main takeaway is from all this, but it is damn interesting.

The link to the lecture is here: http://personal.rhul.ac.uk/uhte/014/Economics%20of%20Warfare/Lecture%209.pdf