Category Methodologies

Economics of Warfare 19 – 2 and 11 – 2

Continuing with a second posting on the nineteenth and second to last lecture from Professor Michael Spagat’s Economics of Warfare course that he gives at Royal Holloway University. It is posted on his blog Wars, Numbers and Human Losses at: https://mikespagat.wordpress.com/

This lecture continues the discussion of terrorism, this time he is looking at a paper by Gassebner and Luechinger on terrorism. This is similar to what was done for causes of war in a paper by Hegre and Sambanis that was presented in lecture 11:

Economics of Warfare 11

This discussion of Hegre and Sambanis covered only the last two pages of the lecture (slides 23 and 24 of lecture 11) and I did not mention it when I first blogged about it.. I guess I probably need to now, turning this posting into the follow-up post on lecture 11. Hegre and Sambanis looked at 88 variables related to causes of war and by running regressions tried to determine which ones are consistently correlated with the onset of war.

  1. GDP per capita is negatively associate with civil war onset (meaning: rich countries are less likely to have civil wars).
  2. Having had a previous war is positively associated with civil war onset…the more recent the war the stronger the association (meaning: war beget wars?).
  3. Country size (population and territory) is positively associated with civil war onset (meaning: big countries tend to have more wars.).

This last point is interesting as country size and population also showed up in our insurgency studies related to the success of the insurgents. Big populated counties tended to have more successful insurgencies than small countries. In Chapter 3, page 47 of America’s Modern Wars I provided the following chart:

Insurgencies with Foreign Intervention

Circumstances                                                   Number of cases        Percent Blue Victory

Indigenous Population > 9 million                              10                                20

Intervening Force Commitment > 100,000                  8                                  0

Peak Insurgent Force Size > 30,000                         13                                23

“Blue Victory” = counterinsurgent victory

Anyhow, I have not gotten past the first sentence of slide 13 for this post, and we are already around 300 words in this post, so probably best to pick up the rest of lecture 19 in a subsequent post.

The link to lecture 19 is here: http://personal.rhul.ac.uk/uhte/014/Economics%20of%20Warfare/Lecture%2019.pdf

The link to lecture 11 is here: https://dupuyinstitute.dreamhosters.com/2017/01/31/economics-of-warfare-11/

Human Factors In Warfare: Combat Intensity

Battle of Spotsylvania by Thure de Thulstrup (1886) [Library of Congress]

Trevor Dupuy considered intensity to be another combat phenomena influenced by human factors. The variation in the intensity of combat is an aspect of battle that is widely acknowledged but little studied.

No one who has paid any attention at all to historical combat statistics can have failed to notice that some battles have been very bloody and hard-fought, while others—often under circumstances superficially similar—have reached a conclusion with relatively light casualties on one or both sides. I don’t believe that it is terribly important to find a quantitative reason for such differences, mainly because I don’t think there is any quantitative reason. The differences are usually due to such things as the general circumstances existing when the battles are fought, the personalities of the commanders, and the natures of the missions or objectives of one or both of the hostile forces, and the interactions of these personalities and missions.

From my standpoint the principal reason for trying to quantify the intensity of a battle is for purposes of comparative analysis. Just because casualties are relatively low on one or both sides does not necessarily mean that the battle was not intensive. And if the casualty rates are misinterpreted, then the analysis of the outcome can be distorted. For instance, a battle fought on a flat plain between two military forces will almost invariably have higher casualty rates for both sides than will a battle between those same two forces in mountainous terrain. A battle between those two forces in a heavy downpour, or in cold, wintry weather, will have lower casualties than when the forces are opposed to each other, under otherwise identical circumstances, in good weather. Casualty rates for small forces in a given set of circumstances are invariably higher than the rates for larger forces under otherwise identical circumstances.

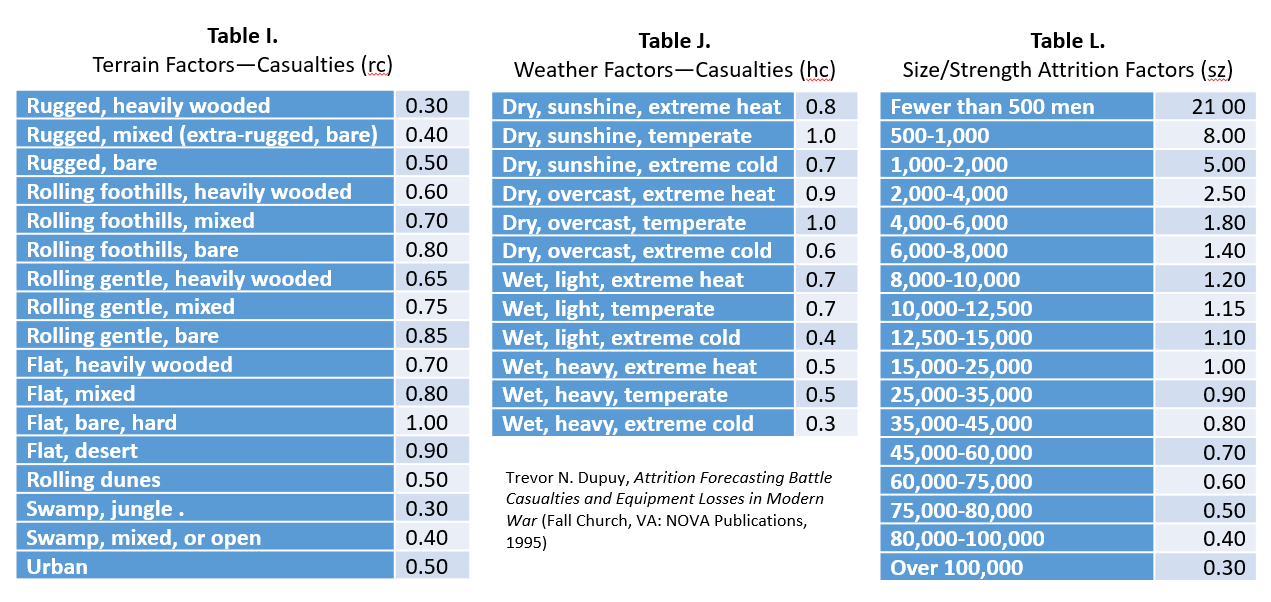
If all of these things are taken into consideration, then it is possible to assess combat intensity fairly consistently. The formula I use is as follows:

CI = CR / (sz’ x rc x hc)

When:     CI = Combat Intensity Measure

CR = Casualty rate in percent per day

sz’ = Square root of sz, a factor reflecting the effect of size upon casualty rates, derived from historical experience

rc = The effect of terrain on casualty rates, derived from historical experience

hc = The effect of weather on casualty rates, derived from historical experience

I then (somewhat arbitrarily) identify seven levels of intensity:

0.00 to 0.49 Very low intensity (1)

0.50 to 0.99 Low intensity (56)

1.00 to 1.99 Normal intensity (213)

2.00 to 2.99 High intensity (101)

3.00 to 3.99 Very high intensity (30)

4.00 to 5.00 Extremely high intensity (17)

Over 5.00 Catastrophic outcome (20)

The numbers in parentheses show the distribution of intensity on each side in 219 battles in DMSi’s QJM data base. The catastrophic battles include: the Russians in the Battles of Tannenberg and Gorlice Tarnow on the Eastern Front in World War I; the Russians on the first day of the Battle of Kursk in July 1943; a British defeat in Malaya in December, 1941; and 16 Japanese defeats on Okinawa. Each of these catastrophic instances, quantitatively identified, is consistent with a qualitative assessment of the outcome.

[UPDATE]

As Clinton Reilly pointed out in the comments, this works better when the equation variables are provided. These are from Trevor N. Dupuy, Attrition Forecasting Battle Casualties and Equipment Losses in Modern War (Fall Church, VA: NOVA Publications, 1995), pp. 146, 147, 149.

Economics of Warfare 19 – 1

Continuing with the nineteenth and second to last lecture from Professor Michael Spagat’s Economics of Warfare course that he gives at Royal Holloway University. It is posted on his blog Wars, Numbers and Human Losses at: https://mikespagat.wordpress.com/

This lecture continues the discussion of terrorism, a subject we often deliberately avoid. We actually don’t even have a category for terrorism on the blog, in part because I consider it a tool of an insurgency, not a separate form of warfare.

On the first slide is a paper on the determinants of media attention for terrorist attacks. This is a significant subject as terrorism does rely on media attention to make their points. If there was no coverage……then the terrorist act would be relatively ineffective. The purpose of terrorism is not to kill people, it is to attract attention. Modern international terrorism started with the Palestinian Black September attack on the Munich Olympics in 1972, which turned the Palestinian issue from a Middle East concern into an issue that now garnered world wide attention.

Anyhow, the lecture starts with a paper by Michael Jetter, which is linked to on page 1 (one of the very nice things about this lecture series is that all the various papers he discusses are linked in the lecture…providing a extensive collection of interesting and useful papers to read). The question is “…why do some attacks generate more coverage than others do?” The answer is on slides 10 and 12, but the short answer is: attacks in wealthier countries, countries that trade with the U.S., that are closer to the U.S. get more coverage (in the New York Times).

Not sure how really meaningful this is except to note that obviously, terrorist attacks in Canada are going to get a lot more attention in the U.S. newspapers than terrorist attacks in Sri Lanka.

Anyhow, this is going to turn into a two-part posting, so will do the rest later this week. The link to his lecture is here: http://personal.rhul.ac.uk/uhte/014/Economics%20of%20Warfare/Lecture%2019.pdf


Human Factors In Warfare: Surprise

By John Trumbull (1756-1843) – Yale University Art Gallery – The Death of Paulus Aemilius at the Battle of Cannae, Public Domain

Trevor Dupuy considered surprise to be one of the most important human factors on the battlefield.

A military force that is surprised is severely disrupted, and its fighting capability is severely degraded. Surprise is usually achieved by the side that has the initiative, and that is attacking. However, it can be achieved by a defending force. The most common example of defensive surprise is the ambush.

Perhaps the best example of surprise achieved by a defender was that which Hannibal gained over the Romans at the Battle of Cannae, 216 BC, in which the Romans were surprised by the unexpected defensive maneuver of the Carthaginians. This permitted the outnumbered force, aided by the multiplying effect of surprise, to achieve a double envelopment of their numerically stronger force.

It has been hypothesized, and the hypothesis rather conclusively substantiated, that surprise can be quantified in terms of the enhanced mobility (quantifiable) which surprise provides to the surprising force, by the reduced vulnerability (quantifiable) of the surpriser, and the increased vulnerability (quantifiable) of the side that is surprised.

I have written in detail previously about Dupuy’s treatment of surprise. He cited it as one of his timeless verities of combat.  As one of the most powerful force multipliers available in battle, he calculated that achieving complete surprise could more than double the combat power of a force.

Predictive Analytics

Linked here is the blog for a company that specializes in “data science & predictive analytics:” Elderresearch

It is run by Dr. John Elder, someone who I have known for more decades than I care to admit. We have not had much intersection in our respective businesses, although I did talk to him in 2007 about the use of classification trees when we were doing work on insurgencies. This work is summarized in my book America’s Modern Wars. In particular we were using them in our Task 12 report: Examining the Geographic Aspects of an Insurgency, dated 4 February 2008. We did both a logistic regression and several classification trees looking at terrain and its effects on insurgencies. I ended up getting a three page paper from John where he independently ran his own logistic regression from our data and ended up with results similar to ours. It was a useful (and free) confirmation of what we were looking at.

I generally was not happy with the results I was getting from these comparison and there was clearly some factors far more significant than terrain that was driving the results of these conflicts. This is what lead us to look at force ratios and insurgent cause. Somewhere between the first and final draft of the book, I did delete the classification trees from the book.

I gather some of Elder Research’s work is based upon classification trees. Most of his work is commercial. They do have a new blog, but with only one blog post so far in there “defense and intelligence” category. It addresses the third off-set strategy: defense-and-intelligence


Aussie OR

Over the years I have run across a number of Australian Operations Research and Historical Analysis efforts. Overall, I have been impressed with what I have seen. Below is one of their papers written by Nigel Perry. He is not otherwise known to me. It is dated December 2011: Applications of Historical Analyses in Combat Modeling

It does address the value of Lanchester equations in force-on-force combat models, which in my mind is already a settled argument (see: Lanchester Equations Have Been Weighed). His is the latest argument that I gather reinforces this point.

The author of this paper references the work of Robert Helmbold and Dean Hartley (see page 14). He does favorably reference the work of Trevor Dupuy but does not seem to be completely aware of the extent or full nature of it (pages 14, 16, 17, 24 and 53). He does not seem to aware that the work of Helmbold and Hartley was both built from a database that was created by Trevor Dupuy’s companies HERO & DMSI. Without Dupuy, Helmbold and Hartley would not have had data to work from.

Specifically, Helmbold was using the Chase database, which was programmed by the government from the original paper version provided by Dupuy. I think it consisted of 597-599 battles (working from memory here). It also included a number of coding errors when they programmed it and did not include the battle narratives. Hartley had Oakridge National Laboratories purchase a computerized copy from Dupuy of what was now called the Land Warfare Data Base (LWDB). It consisted of 603 or 605 engagements (and did not have the coding errors but still did not include the narratives). As such, they both worked from almost the same databases.

Dr. Perrty does take a copy of Hartley’s  database and expands it to create more engagements. He says he expanded it from 750 battles (except the database we sold to Harley had 603 or 605 cases) to around 1600. It was estimated in the 1980s by Curt Johnson (Director and VP of HERO) to take three man-days to create a battle. If this estimate is valid (actually I think it is low), then to get to 1600 engagements the Australian researchers either invested something like 10 man-years of research, or relied heavily on secondary sources without any systematic research, or only partly developed each engagement (for example, only who won and lost). I suspect the latter.

Dr. Perry shows on page 25:

Data-segment……..Start…….End……Number of……Attacker…….Defender

Epoch…………………Year…….Year……..Battles………Victories……Victories

Ancient………………- 490…….1598………….63………………36……………..27

17th Century……….1600…….1692………….93………………67……………..26

18th Century……….1700…….1798………..147…………….100……………..47

Revolution…………..1792……1800…………238…………….168…………….70

Empire……………….1805……1815…………327……………..203…………..124

ACW………………….1861……1865…………143……………….75…………….68

19th Century……….1803…….1905…………126……………….81…………….45

WWI………………….1914…….1918…………129……………….83…………….46

WWII…………………1920…….1945…………233……………..165…………….68

Korea………………..1950…….1950…………..20……………….20………………0

Post WWII………….1950……..2008…………118……………….86…………….32


We, of course, did something very similar. We took the Land Warfare Data Base (the 605 engagement version), expanded in considerably with WWII and post-WWII data, proofed and revised a number of engagements using more primarily source data, divided it into levels of combat (army-level, division-level, battalion-level, company-level) and conducted analysis with the 1280 or so engagements we had. This was a much more powerful and better organized tool. We also looked at winner and loser, but used the 605 engagement version (as we did the analysis in 1996). An example of this, from pages 16 and 17 of my manuscript for War by Numbers shows:

Attacker Won:


                        Force Ratio                Force Ratio    Percent Attack Wins:

                        Greater than or         less than          Force Ratio Greater Than

                        equal to 1-to-1            1-to1                or equal to 1-to-1

1600-1699        16                              18                         47%

1700-1799        25                              16                         61%

1800-1899        47                              17                         73%

1900-1920        69                              13                         84%

1937-1945      104                                8                         93%

1967-1973        17                              17                         50%

Total               278                              89                         76%


Defender Won:


                        Force Ratio                Force Ratio    Percent Defense Wins:

                        Greater than or         less than          Force Ratio Greater Than

                        equal to 1-to-1            1-to1                or equal to 1-to-1

1600-1699           7                                6                       54%

1700-1799         11                              13                       46%

1800-1899         38                              20                       66%

1900-1920         30                              13                       70%

1937-1945         33                              10                       77%

1967-1973         11                                5                       69%

Total                130                              67                       66%


Anyhow, from there (pages 26-59) the report heads into an extended discussion of the analysis done by Helmbold and Hartley (which I am not that enamored with). My book heads in a different direction: War by Numbers III (Table of Contents)


Human Factors In Warfare: Defensive Posture

U.S. Army troops shelter in defensive trenches at the Battle of Anzio, Italy, 1944. [U.S. Army Center for Military History]

Like dispersion on the battlefield, Trevor Dupuy believed that fighting on the defensive derived from the effects of the human element in combat.

When men believe that their chances of survival in a combat situation become less than some value (which is probably quantifiable, and is unquestionably related to a strength ratio or a power ratio), they cannot and will not advance. They take cover so as to obtain some protection, and by so doing they redress the strength or power imbalance. A force with strength y (a strength less than opponent’s strength x) has its strength multiplied by the effect of defensive posture (let’s give it the symbol p) to a greater power value, so that power py approaches, equals, or exceeds x, the unenhanced power value of the force with the greater strength x. It was because of this that [Carl von] Clausewitz–who considered that battle outcome was the result of a mathematical equation[1]–wrote that “defense is a stronger form of fighting than attack.”[2] There is no question that he considered that defensive posture was a combat multiplier in this equation. It is obvious that the phenomenon of the strengthening effect of defensive posture is a combination of physical and human factors.

Dupuy elaborated on his understanding of Clausewitz’s comparison of the impact of the defensive and offensive posture in combat in his book Understanding War.

The statement [that the defensive is the stronger form of combat] implies a comparison of relative strength. It is essentially scalar and thus ultimately quantitative. Clausewitz did not attempt to define the scale of his comparison. However, by following his conceptual approach it is possible to establish quantities for this comparison. Depending upon the extent to which the defender has had the time and capability to prepare for defensive combat, and depending also upon such considerations as the nature of the terrain which he is able to utilize for defense, my research tells me that the comparative strength of defense to offense can range from a factor with a minimum value of about 1.3 to maximum value of more than 3.0.[3]

NOTES

[1] Dupuy believed Clausewitz articulated a fundamental law for combat theory, which Dupuy termed the “Law of Numbers.” One should bear in mind this concept of a theory of combat is something different than a fundamental law of war or warfare. Dupuy’s interpretation of Clausewitz’s work can be found in Understanding War: History and Theory of Combat (New York: Paragon House, 1987), 21-30.

[2] Carl von Clausewitz, On War, translation by Colonel James John Graham (London: N. Trübner, 1873), Book One, Chapter One, Section 17

[3] Dupuy, Understanding War, 26.

Osipov

Back in 1915, a Russian named M. Osipov published a paper in a Tsarist military journal that was Lanchester like: http://www.dtic.mil/dtic/tr/fulltext/u2/a241534.pdf

He actually tested his equations to historical data, which are presented in his paper. He ended up coming up with something similar to Lanchester equations but it did not have a square law, but got a similar effect by putting things to the 3/2nds power.

As far as we know, because of the time it was published (June-October 1915), it was not influenced or done with any awareness of work that the far more famous Frederick Lanchester had done (and Lanchester was famous for a lot more than just his modeling equations).  Lanchester first published his work in the fall of 1914 (after the Great War had already started). It is possible that Osipov was aware of it, but he does not mention Lanchester. He was probably not aware of Lanchester’s work. It appears to be the case of him independently coming up with the use of differential equations to describe combat attrition. This was also the case with Rear Admiral J. V. Chase, who wrote a classified staff paper for U.S. Navy in 1902 that was not revealed until 1972.

Osipov, after he had written his paper, may have served in World War I, which was already underway at the time it was published. Between the war, the Russian revolutions, the civil war afterwards, the subsequent repressions by Cheka and later Stalin, we do not know what happened to M. Osipov. At the time I was asked by CAA if our Russian research team knew about him. I passed the question to Col. Sverdlov and Col. Vainer and they were not aware of him. It is probably possible to chase him down, but would probably take some effort. Perhaps some industrious researcher will find out more about him.

It does not appear that Osipov had any influence on Soviet operations research or military analysis. It appears that he was ignored or forgotten. His article was re-published in the September 1988  of the Soviet Military-Historical Journal with the propaganda influenced statement that they also had their own “Lanchester.” Of course, this “Soviet Lanchester” was publishing in a Tsarist military journal, hardly a demonstration of the strength of the Soviet system.


Soviet OR

There was a sense among some in the Sovietology community in the late 1980s that Soviet Operations Research (OR) was particularly advanced. People had noticed the 300-man Soviet Military History Institute and the Soviet use of the quantified “Correlation of Forces and Means,” which they used in WWII and since. Trevor Dupuy referenced these in his writings. They had noticed a number of OR books by professors at their Frunze Military Academy. In particular, the book Tactical Calculations by Anatoli Vainer was being used by a number of Sovietologists in their works and presentations (including TNDA alumni Col. John Sloan). There was a concern that the Soviet Union was conducting extensive quantitative analysis of its historical operations in World War II and using this to further improve their war fighting capabilities.

This is sort of a case of trying to determine what is going on by looking at the shadows on a cave wall (Plato analogy here). In October 1993 as part of the Kursk project, we meet with our Russian research team headed by Dr. Fyodor Sverdlov (retired Colonel, Soviet WWII veteran, and former head of the Frunze Military Academy History Department). Sitting there as his right hand man was Dr. Anatoli Vainer (also a retired Colonel, a Soviet WWII veteran and a Frunze Military Academy professor).

We had a list of quantitative data that we needed for the Kursk Data Base (KDB). The database was to be used as a validation database for the Center of Army Analysis (CAA) various modeling efforts. As such, we were trying to determine for each unit for each day the unit strength, losses, equipment lists, equipment losses, ammunition levels, ammunition expenditures, fuel levels, fuel expenditures, and so forth. They were stunned. They said that they did not have models like that. We were kind of surprised at that response.

Over the course of several days I got to know these two gentlemen, went swimming with Col. Sverdlov and had dinner over at Col. Vainer’s house. I got to see his personal library and the various books he wrote. Talked to him as much as I could sensitively do so about Soviet OR, and they were pretty adamant that there really wasn’t anything significant occurring. Vainer told me that his primary source for materials for his books was American writings on Operations Research. So, it appeared that we had completed a loop….the Soviets were writing OR books based upon our material and we were reading them and thinking they had a well developed OR structure.

Their historical research was also still primarily based upon one-side data. They simply were not allowed to access the German archives and regardless they knew that they should not be publishing Soviet casualty figures or any negative comparisons. Col. Sverdlov, who had been in the war since Moscow 1941, was well aware of the Soviet losses, and had some sense that the German losses were less, but this they could not publish [Sverdlov: “I was at Prokhorovka after the war, and I didn’t see 100 Tigers there”]. So, they were hardly able to freely conduct historical analysis in an unbiased manner.

In the end, at this time, they had not developed the analytical tools or capability to fully explore their own military history or to conduct operations research.