Category Methodologies

Are They Channeling Trevor Dupuy?

TrevorCoverShot

Continuing the RAND description of their hex boardgame:

Ground unit combat strengths were based on a systematic scoring of individual weapons, from tanks and artillery down to light machine guns, which were then aggregated according to the tables of organization and equipment for the various classes of NATO and Russian units. Overall unit scores were adjusted to account for differences in training, sustainment, and other factors not otherwise captured. Air unit combat strengths were derived from the results of offline engagement, mission, and campaign-level modeling.

This looks like some kind of firepower or combat power score, or perhaps Trevor Dupuy’s OLIs (Operational Lethality Indexes). As they say “systematic scoring” one wonders what system they used. Know of only one scoring system that is systematic (meaning the OLIs, which are based upon formulae). The subject is probably best summarized in Dr. James Taylor’s article on “Consistent Scoring of Weapons and Aggregation of Forces:” http://www.dupuyinstitute.org/pdf/v2n2.pdf. This is the same James Taylor who wrote the definitive two-volume work on Lanchester equations.

I do note with interest the adjustment for “differences in training, sustainment, and other factors.” That is always good to see.

Also noted:

Full documentation of the gaming platform will be forthcoming in a subsequent report.

Look forward to reading it.

Lanchester equations have been weighed….

a-knights-tale_1

There have been a number of tests of Lanchester equations to historical data over the years. Versions of Lanchester equations were implemented in various ground combat models in the late 1960s and early 1970s without any rigorous testing. As John Stockfish of RAND stated in 1975 in his report: Models, Data, and War: A Critique of the Study of Conventional Forces:

However Lanchester is presently esteemed for his ‘combat model,’ and specifically his ‘N-square law’ of combat, which is nothing more than a mathematical formulation of the age-old military principal of force concentration. That there is no clear empirical verification of this law, or that Lanchester’s model or present versions of it may in fact be incapable of verification, have not detracted from this source of his luster.”

Since John Stockfish’s report in 1975 the tests of Lanchester have included:

(1) Janice B. Fain, “The Lanchester Equations and Historical Warfare: An Analysis of Sixty World War II Land Engagements.” Combat Data Subscription Service (HERO, Arlington, VA, Spring 1977);

(2) D. S. Hartley and R. L. Helmbold, “Validating Lanchester’s Square Law and Other Attrition Models,” in Warfare Modeling, J. Bracken, M. Kress, and R. E. Rosenthal, ed., (New York: John Wiley & Sons, 1995) and originally published in 1993;

(3) Jerome Bracken, “Lanchester Models of the Ardennes Campaign in Warfare Modeling (John Wiley & sons, Danvers, MA, 1995);

(4) R. D. Fricker, “Attrition Models of the Ardennes Campaign,” Naval Research Logistics, vol. 45, no. 1, January 1997;

(5) S. C. Clemens, “The Application of Lanchester Models to the Battle of Kursk” (unpublished manuscript, May 1997);

(6) 1LT Turker Turkes, Turkish Army, “Fitting Lanchester and Other Equations to the Battle of Kursk Data,” Dissertation for MS in Operations Research, March 2000;

(7) Captain John Dinges, U.S. Army, “Exploring the Validation of Lanchester Equations for the Battle of Kursk,” MS in Operations Research, June 2001;

(8) Tom Lucas and Turker Turkes, “Fitting Lanchester Equations to the Battles of Kursk and Ardennes,” Naval Research Logistics, 51, February 2004, pp. 95-116;

(9) Thomas W. Lucas and John A. Dinges, “The Effect of Battle Circumstances on Fitting Lanchester Equations to the Battle of Kursk,” forthcoming in Military Operations Research.

In all cases, it was from different data sets developed by us, with eight of the tests conducted completely independently of us and without our knowledge.

In all cases, they could not establish a Lanchester square law and really could not establish the Lanchester linear law. That is nine separate and independent tests in a row with basically no result. Furthermore, there has never been a test to historical data (meaning real-world combat data) that establishes Lanchester does apply to ground combat. This is added to the fact that Lanchester himself did not think it should. It does not get any clearer than that.

As Morse & Kimball stated in 1951 in Methods of Operations Research

Occasionally, however, it is useful to insert these constants into differential equations, to see what would happen in the long run if conditions were to remain the same, as far as the constants go. These differential equations, in order to be soluble, will have to represent extremely simplified forms of warfare; and therefore their range of applicability will be small.

And later they state:

Indeed an important problem in operations research for any type of warfare is the investigation, both theoretical and statistical, as to how nearly Lanchester’s laws apply.

I think this has now been done for land warfare, at last. Therefore, I conclude: Lanchester equations have been weighed, they have been measured, and they have been found wanting.
Really…..Lanchester?

RAND described the combat system from their hex boardgame as such:

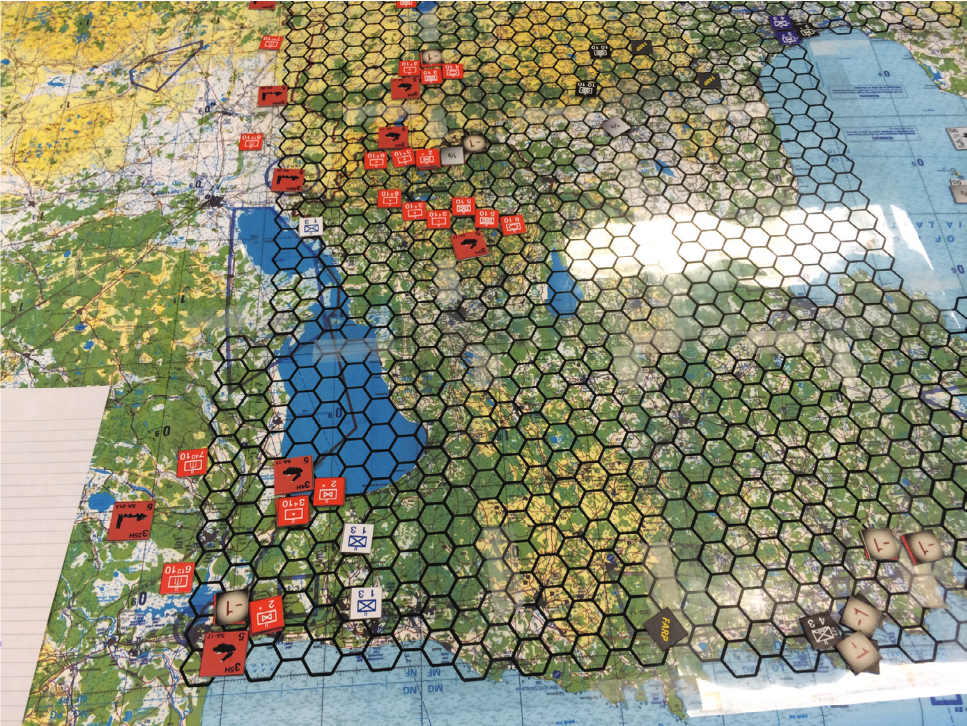
The general game design was similar to that of traditional board wargames, with a hex grid governing movement superimposed on a map. Tactical Pilotage Charts (1:500,000 scale) were used, overlaid with 10-km hexes, as seen in Figure A.1. Land forces were represented at the battalion level and air units as squadrons; movement and combat were governed and adjudicated using rules and combat-result tables that incorporated both traditional gaming principles (e.g., Lanchester exchange rates) and the results of offline modeling….”

Now this catches my attention. Switching from a “series of tubes” to a hexagon boardgame brings back memories, but it is understandable. On the other hand, it is pretty widely known that no one has been able to make Lanchester equations work when tested to historical ground combat. There have been multiple efforts conducted to test this, mostly using the Ardennes and Kursk databases that we developed. In particular, Jerome Braken published his results in Modeling Warfare and Dr. Thomas Lucas out at Naval Post-Graduate School has conducted multiple tests to try to do the same thing. They all point to the same conclusion, which is that Lanchester equations do not really work for ground combat. They might work for air, but it is hard to tell from the RAND write-up whether they restricted the use of “Lanchester exchange rates” to only air combat. I could make the point by referencing many of these studies but this would be a long post. The issue is briefly discussed in Chapter Eighteen of my upcoming book War by Numbers and is discussed in depth in the TDI report “Casualty Estimation Methodologies Study.” Instead I will leave it to Frederick Lanchester himself, writing in 1914, to summarize the problem:

We have already seen that the N-square law applies broadly, if imperfectly, to military operations. On land, however, there sometimes exist special conditions and a multitude of factors extraneous to the hypothesis, whereby its operations may be suspended or masked.


Series of Tubes

clip_image002

RAND has published a report on its analysis of “NATO’s Eastern Flank” (meaning the three Baltic states). The PDF can be obtained here: http://www.rand.org/pubs/research_reports/RR1253.html  Of particular interest to us is Appendix A: Methodology and Data (page 12).

RAND is using a hex board game with counters that appears to have strength and movement factors on them. This is Tactics II…Avalon Hill…..SPI. RAND does have their own combat model, JICM (Joint Integrated Contingency Model), so why are they using a hex board game? According to their article:

RAND developed this map-based tabletop exercise because existing models were ill-suited to represent the many unknowns and uncertainties surrounding a conventional military campaign in the Baltics, where low force-to-space ratios and relatively open terrain meant that maneuver between dispersed forces—rather than pushing and shoving between opposing units arrayed along a linear front—would likely be the dominant mode of combat.

The problem is that JICM does movement down to having a series of “places” that are connected by “links.“ These links are tubes of variable width, connecting between each “place”. So for example, there might be a tube between St. Petersburg and Talinin. All combat would occur up and down this tube, but there could be no real movement out of the tube. This is a limited and somewhat inflexible movement system that has been used in a few other models (SOTACA comes to mind).

Now, I gather RAND has the whole map of the world set up for JICM as a “series of tubes.” According a 1995 report, there were nearly 1000 “places” and 2000 “links” for the entire world. This does not give a lot of fidelity, as the map of Korea shows at the top of the post. I suspect the fidelity is such that there are few tubes in an area as small as Estonia.

Estonia is small. It is 17,505 square miles. This is smaller than West Virginia (24,038 sq. miles), and it is a lot flatter. But, somehow, they have managed to maintain an independent language of over a million speakers (1.2 million actually). This language has managed to survive for over a thousand years! I am always impressed by that. Their capital is only about 100 miles from several points along the Russian border. This is about the distance between Washington DC and Richmond. Now granted, it took several years to cover that distance during the American Civil War, but there was a significant Confederate Army in the path. Therefore, to examine scenarios, I suspect they needed a map of considerably more fidelity than JICM and its “series of tubes.”

War by Numbers III

The table of contents for the book:

—             Preface                                                                                    6
One          Understanding War                                                                 8
Two          Force Ratios                                                                          15
Three       Attacker versus Defender                                                      22
Four         Human Factors                                                                      24
Five          Measuring Human Factors in Combat: Italy                          27
Six            Measuring Human Factors in Combat: Ardennes & Kursk   40
Seven       Measuring Human Factors in Combat: Modern Wars          55
Eight         Outcome of Battles                                                               67
Nine          Exchange Ratios                                                                  75
Ten           The Combat Value of Superior Situational Awareness        83
Eleven      The Combat Value of Surprise                                           113
Twelve      The Nature of Lower Level Combat                                   135
Thirteen    The Effects of Dispersion on Combat                                150
Fourteen   Advance Rates                                                                  164
Fifteen       Casualties                                                                         171
Sixteen      Urban Legends                                                                 197
Seventeen The Use of Case Studies                                                 248
Eighteen    Modeling Warfare                                                             270
Nineteen    Validation of the TNDM                                                    286
Twenty       Conclusions                                                                     313

Appendix I:   Dupuy’s Timeless Verities of Combat                           317
Appendix II:  Dupuy’s Combat Advance Rate Verities                       322
Appendix III: Dupuy’s Combat Attrition Verities                                 326

Bibliography                                                                                       331

Page numbers are based upon the manuscript and will certainly change. The book is 342 pages and 121,095 words. Definitely a lot shorter than the Kursk book.


War by Numbers II

What is it about (these two paragraphs are from my proposal):

War by Numbers looks at the basic nature of conventional warfare based upon extensive analysis of historical combat. Never passé, conventional combat capability has been a feature of the current growth of Islamic State in Iraq and the Levant (ISIL) and has returned as a threat in Eastern Europe. This book attempts to establish what we actually know about conventional combat and why we know it. It also provides an indication of how much impact various factors have on combat. It is the next step in analysis of combat that goes one step beyond what was addressed by theorists like Clausewitz.

It is the nature of the scientific process that hypothesis and theories do need to be tested and challenge. In a sense, we are attempting to add that rigor to a field that often does not operate with such rigor. In a profession where errors in judgment can result in the loss of lives, a rigorous understanding of warfare should be desired. War by Numbers attempts to provide such an understanding.

Wargaming the Defense of the Baltics

RAND Wargame
Source: David A. Shlapak and Michael Johnson. Reinforcing Deterrence on NATO’s Eastern Flank: Wargaming the Defense of the Baltics. Santa Monica, CA: RAND Corporation, 2016.

RAND has published a new report by analysts David A. Shlapak and Michael Johnson detailing their assessment of the threat to the Baltic republics of conventional invasion by Russian military forces. The conclusions of the study are sobering — that NATO could do little to prevent Russian military forces from effectively overrunning Latvia and Estonia in as few as 60 hours. Their analysis should provide plenty of food for thought.

Just as interesting, however, is that Shlapak and Johnson used old-style paper wargaming techniques to facilitate their analysis. The image above of their home-designed wargame above should warm the cockles of any Avalon Hill or SPI board wargame enthusiast of a certain age. As to why they chose this approach, they stated:

RAND developed this map-based tabletop exercise because existing models were ill-suited to represent the many unknowns and uncertainties surrounding a conventional military campaign in the Baltics, where low force-to-space ratios and relatively open terrain meant that maneuver between dispersed forces—rather than pushing and shoving between opposing units arrayed along a linear front—would likely be the dominant mode of combat.

While they did state that they used rules and tables governing movement and combat based on “offline modeling,” it is very curious that they did not find any of the many sophisticated Defense Department computer models and simulations available to be suitable for their task. They outline their methodology in an appendix, but promise to provide a fuller report at a later date.

Why Men Rebel?

In the 1960s, there were two big-budget quantitative historical studies conducted of the causes of revolution. One was by Ted Gurr of Princeton University and resulted in the 1970 book Why Men Rebel? The other similar effort was done by a husband and wife team of Ivo and Rosalind Feierabend out at San Diego State University. They published their data and results in a series of articles and in 1972 in a compilation book (Anger, Violence and Politics: Theories and Research). Ted Gurr’s work is much more widely known, although in the 1980s when I reviewed both of their works in depth, I found them to be similar and of equal quality.

Both Ted Gurr’s and the Feierabend’s work was based upon measuring political violence, which was a very relevant subject back in the 1960s. I believe that both projects were U.S. government funded. They both collected extensive data on violence in every county in the world in the post-WWII era (their data cut off was in the late 1960s) and created an index of political violence by country. They then built a multi-variant regression model to try to measure what causes those levels of violence.

Although they were completely separate and isolated efforts, using different data collections, they ended up pretty much reaching similar conclusions (much like what happened with my work and Andrew Hossack’s work). They were both cross-national studies that tried to determine the level of political violence in a country based on a range of factors. Like with any extensive quantitative analysis, there were a lot of elements and interesting findings in this work. But, they both put front and center a “relative deprivation” hypothesis of the causes of political violence (and/or rebellion). Basically, what this said was that if things are going well, and then they start going badly, this creates the highest chance for ‘regime change.”

So, for example, in their data sample the rich (or developed) countries tended to be very stable. Very poor countries (undeveloped) were less stable. But the least stable countries are those somewhere between rich and poor that are getting wealthier (what they called at the time developing countries). They tend to be stable when they are economically growing, but once the growth stops, they become unstable. If there is any validity to this hypothesis (and there certainly was using the twenty years of data from around 1948 to 1968), then this leads to me to wonder about the long-term stability of Russia and China.

A summary of Why Men Rebel is here: http://wikisum.com/w/Gurr:_Why_men_rebel. As the summery notes: “(3) “Progressive deprivation” [the J-curve]–expectations grow [we expect continued growth] and capabilities do to, but capabilities either don’t keep up or start to fall (pg 53)–modernization, depression in a growing country, or other change could cause this. [What he wrote in 1970 about this describes nicely what happened with the fall of the USSR.]”

It would be interesting, in light of almost 50 more years of data since they did their work, if someone took their regression models and ran the last 50 years of data through them to see how they did. I always like to see a little model validation (although this is rarely done).