Category Lessons of History

The U.S. Army Three-to-One Rule versus the 752 Case Division-level Data Base 1904-1991

Our most developed database through is our division-level database of 752 cases covering combat from 1904 to 1991. As this addresses modern combat, it is a useful database for such a test. Of those 752 cases, we have the forces ratios and outcome for 672 of them. All the engagements previously discussed from ETO in 1944 and Kharkov and Kursk in 1943 are drawn from this database. As such, there is some overlap between these 672 cases and the 116 cases from ETO and 73 cases from the Eastern Front previously used. The data shows a very clear pattern related to force ratios.

Division-level Engagements 1904-1991 (672 cases)

Force Ratio…………………..Percent Attacker Wins………………Number of Cases

0.20 to 0.20-to-1………………..0%………………………………………………….2

0.25 to 04.9-to-1………………22…………………………………………………….9

0.50 to 0.99-to-1………………42…………………………………………………..77

1.00 to 1.49-to-1………………55…………………………………………………150

1.50 to 1.99-to-1………………59…………………………………………………123

2.00 to 2.49-to-1………………71…………………………………………………..56

2.50 to 2.99-to-1………………83…………………………………………………..53

3.00 to 3.49-to-1………………69…………………………………………………..48

3.50 to 3.98-to-1………………77…………………………………………………..30

4.06 to 5.87-to-1………………65…………………………………………………..66

6.06 to 7.90-to-1………………88…………………………………………………..17

8.20 to 17.87-to-1……………100…………………………………………………..22


This table drives home in spades the problem with the U.S. Army current interpretation of the three-to-one rule (50% chance of defender success). To start with, the attacker starts winning over half the time at 1.00 to 1.49-to-1 odds. By the time they get to 2.50 to 2.99-to-1 odds they are winning 83% of the time. It is quite clear from this data that the U.S. Army rule is wrong.

Now, this data is skewed a little bit by the inclusion of engagements with “limited action” or only “limited attack.” They include engagements where the attacker has a significant force ratio but conducted only an initial probing attack of battalion size. Sometimes those attacks did not succeed. So the success rate of some the higher odds engagements would actually be higher if these were eliminated. So, we ended up culling 102 of these engagements from the above table to produce the following table.  There is not a big difference in the results between this tighter table of 570 cases and the previous table of 672 cases. The primary difference is that the attacker tends to be more successful in all categories. All the culled engagements were from World War II.

Division-level Engagements, 1904-1991 (570 cases) – culled data set


Force Ratio………………….Percent Attacker Wins……………….Number of Cases

0.20 to 0.20-to-1………………..0%…………………………………………………2

0.25 to 04.9-to-1………………25……………………………………………………8

0.50 to 0.99-to-1………………52…………………………………………………..62

1.00 to 1.49-to-1………………62…………………………………………………133

1.50 to 1.99-to-1………………66…………………………………………………108

2.00 to 2.49-to-1………………80………………………………………………….49

2.50 to 2.99-to-1………………83………………………………………………….48

3.00 to 3.49-to-1………………70………………………………………………….40

3.50 to 3.98-to-1………………76………………………………………………….29

4.06 to 5.87-to-1………………73………………………………………………….55

6.06 to 7.90-to-1………………88………………………………………………….17

8.20 to 17.87-to-1……………100………………………………………………….17

56.20-109.98-to-1……………100…………………………………………………..2


Needless to say, this tighter data set is even further biased against the published U.S. Army three-to-one rule.

The U.S. Army Three-to-One Rule versus 49 U.S. Civil War battles

From 1st Alabama Cavalry, USV website (www.1stalabamacavalryusv.com). Alexander Lawrence was from Fayette County, Alabama and fought for the Union with the 1st Alabama Cavalry

As the three-to-one rule of thumb appears to have evolved out of the American Civil War (although not as published in FM 6-0), then we should probably look at just our Civil War battles in our database.

Among those 243 cases are 49 cases from the American Civil War. As the three-to-one rule may have evolved from that experience, let us looking at just those cases:

 Force Ratio……………………Percent Attacker Wins……………….Number of Cases

0.44 to 0.48-to-1…………………0%………………………………………………3

0.53 to 0.97-to-1………………..18……………………………………………….11

1.00 to 1.47-to-1………………..36……………………………………………….14

1.53 to 1.96-to-1………………..25……………………………………………….12

2.10 to 2.31-to-1………………..50…………………………………………………6

3.00-to-1……………………….100…………………………………………………1

5.00-to-1……………………….100…………………………………………………1

15.05-to-1……………………..100…………………………………………………1


The American Civil War is a very good test case for such an examination. Both officer corps were primarily trained at West Point (the U.S. military academy); both armies fought in the same style and doctrine; they used most of the same weapons, including the same muskets and same artillery; they were similar in culture; and they were similar in training, doctrine, background and capability. While some historical mythology has tried to make the southern Americans better fighters, it is hard to accept the argument that a farmer from North Carolina is a different, more motivated or a more capable fighter than a farmer from Pennsylvania. Most of the United States was rural. There wre also units raised to fight for the north from all of the southern states. This is about an equal comparison between two opponents that one is going to find.

The end results from these two tests are that the three-to-one rule as recorded in FM 6-0 clearly does not apply. In the case of the Civil War data at 2.10 to 2.31-to-1 odds the attacker is winning half the time. Where does one get the notion that at 3.00-to-1 odds the defender will win half the time? What historical data established that?

So the U.S. Army version of the three-to-one (meaning defender wins half the time) does not show up in the almost 400 years of history that we are examining here and does not show up in the American Civil War.

The U.S. Army Three-to-One Rule versus 243 Battles 1600-1900

Now, at the time I wrote War by Numbers, I was not aware of this sentence planted in FM 6-0 and so therefore did not feel a need to respond to the “3-to-1 rule.” It is a rule of thumb, not completely without value, that had been discussed before. I thought this issue was properly understood in the U.S. analytical and defense community, therefore I did not feel a need to address it further. It turns out that I do. So, let me take a moment to tap into our databases and properly address this using all the resources at my disposal.

First of all, The Dupuy Institute has a database of 243 engagements from 1600-1900 called the Battles Data Base (BaDB). These are almost all field battles, where the two sides deployed their forces of tens of thousands of people and resolve their dispute that day. Of the 243 battles, only 40 of them last longer than a day. The largest engagement has the attacker fielding 365,000 men (Leipzig, 1813) and the smallest engagement had the defender fielding but 350 men (Majuba Hill, 1881).

As this rule of thumb evolved out of the U.S. Civil War, then an examination of historical field battles from 1600-1900 is particularly relevant. Looking at the force ratio for these battles shows:

Force Ratio…………………..Percent Attacker Wins………………..Number of Cases

0.26 to 04.9-to-1………………54%……………………………………………13

0.50 to 0.98-to-1………………54………………………………………………81

1.00 to 1.47-to-1………………56………………………………………………71

1.50 to 1.96-to-1………………63………………………………………………38

2.00 to 2.44-to-1………………50………………………………………………16

2.58 to 2.94-to-1………………57………………………………………………..7

3.00 to 3.43-to-1…………….100………………………………………………..5

3.75 to 3.76-to-1………………..0………………………………………………..2

4.00 to 4.93-to-1………………75………………………………………………..4

7.78 to 16.82-to-1……………..67………………………………………………..6


The pattern here is not particularly clear, as low odds attack, where the attacker is outnumbered, succeed over half the time, as do attacks at higher odds. Some of this is due to the selection of battles, some of this is due to the lack of regular trained armies, and some of this is due to the attacker choosing to attack because they have advantages in morale, training, experience, position, etc. that outweigh the numbers. But, the argument that is made in FM 6-0 that based upon historical data at three-to-one odds the defender wins 50% of the time is clearly not shown. For example, in this data set there are 12 cases between the odds of 2.50 to 3.50-to-1. Of those 12 cases, the attacker wins in 9 of them (75%). The three cases where the defender wins are: 1) Battle of Buena Vista in 1847 where Santa Anna’s Mexican Army attacked Zachary Taylor’s American Army at 2.94-to-1, 2) Battle of Inkeman in 1854 where the Russian Army attacked the French and British armies in Crimea at 2.63-to-1, and 3) Battle of Belfort in 1871 where the French Army attack the German Army at 2.75-to-1. One could certainly argue that in these three cases, the defenders held advantages in training, experience and overall combat effectiveness.

Next post will address the 49 American Civil War battles in our database.

The U.S. Army Three-to-One Rule

Various Three-to-one rules of thumbs have existed in the U.S. Army and in writings possibly as early as the American Civil War (1861-1865). These are fine as “rules of thumb” as long as one does not take them seriously and understands what they really mean. But, unfortunately, we have now seen something that is a loose rule of thumb turned into a codified and quantified rule. This is annoyingly overstating its importance and as given in U.S. Army manuals, is patently false.

The U.S. Army has apparently codified the “three-to-one rule” in its documentation and has given it a value. In the 2014 edition of FM 6-0, paragraph 9-103, it states that “For example, historically, defenders have over a 50 percent probability of defeating an attacking force approximately three times their equivalent strength.” This statement, on the surface, simply is incorrect. For example, the following table from my book War by Numbers is drawn from a series of 116 division-level engagements in France in 1944 against the Germans (see War by Numbers, page 10) They show the following relationship between force ratio and outcome:

European Theater of Operations (ETO) Data, 1944


Force Ratio………………..Result…………………Percent Failure…Number of cases

0.55 to 1.01-to-1.00………Attack Fails…………………..100%……………….5

1.15 to 1.88-to-1.00………Attack usually succeeds……21%………………..48

1.95 to 2.56-to-1.00………Attack usually succeeds……10%………………..21

2.71-to-1.00 and higher…Attacker Advances…………….0%……………….. 42


Now these engagements are from fighting between the U.S., UK and Germany in France and Germany in 1944. These are engagements between forces of roughly equal competence. As can be seen, based upon 42 division-level engagements, in all cases of attacks at three-to-one (more specifically 2.71-to-1 and greater), the attacker advanced. Meaning in all cases of attacks at three-to-one, the attacker won. This directly contradicts the statement in FM 6-0, and contradicts it based upon historical data.

This is supplemented by the following two tables on the next page of War by Numbers. The first table shows the German performance when attacking Soviet units in 1943.

Germans attacking Soviets (Battles of Kharkov and Kursk), 1943


Force Ratio………………..Result………………….Percent Failure…Number of cases

0.63 to 1.06-to-1.00………Attack usually succeeds……..20%……………………..5

1.18 to 1.87-to-1.00………Attack usually succeeds……….6%……………………17

1.91-to-1.00 and higher…Attacker Advances……………….0%……………………21


The next table shows the Soviet performance when attacking German units in 1943:

Soviets attacking Germans (Battles of Kharkov and Kursk), 1943


Force Ratio………………Result…………………..Percent Failure…Number of cases

0.40 to 1.05-to-1…………Attack usually fails…………70%……………………10

1.20 to 1.65-to-1.00…….Attack often fails…………….50%……………………11

1.91 to 2.89-to-1.00…….Attack sometimes fails…….44%……………………..9


These charts are from the fighting around Kharkov in February, March and August of 1943 and the fighting during the Battle of Kursk in July 1943. It is 73 engagements between the German and Soviet armies.

Now, there is a clear performance difference between the German and the Soviet armies at this time. This is discussed in considerable depth in War by Numbers and will not be addressed here. But, what it amounts to is that the German Army has an advantage in the casualty exchange and that advantage also shows up in the outcomes of the battles, as show above. If they attacked at two-to-one odds are greater, they would win. The Soviets attacking at the same odds would win only 56 percent of the time. Clearly, at the division-level, in a unit to unit comparison, the Germans were two or three times better than their Soviet opponents.

Still, even in the worse case, which is the Soviets attacking the Germans, we do not get to the claim made in FM 6-0, which is the defender won 50% of the time when attacked at three-to-one. In fact, the Soviets managed to win 50% of the time when attacking at 1.20 to 1.65-to-1. Something is clearly wrong with the statement in FM 6-0.

Now, at the time I wrote War by Numbers, I was not aware of this sentence planted in FM 6-0 and so therefore did not feel a need to respond to the “three-to-one rule.” It is a rule of thumb, not completely without value, that had been discussed before (see Dupuy, Understanding War, pages 31-37). I thought this issue was properly understood in the U.S. analytical and defense community, therefore I did not feel a need to address it further. It turns out that I do. So, I will take a moment to tap into our databases and properly address this using all the resources at my disposal. This will be in subsequent blog posts.

Dispersion versus Lethality

This is a follow-up post to the post discussing Trevor Dupuy’s work compared to the Army Research Laboratories (ARL) current work:

The Evolution of Weapons and Warfare?

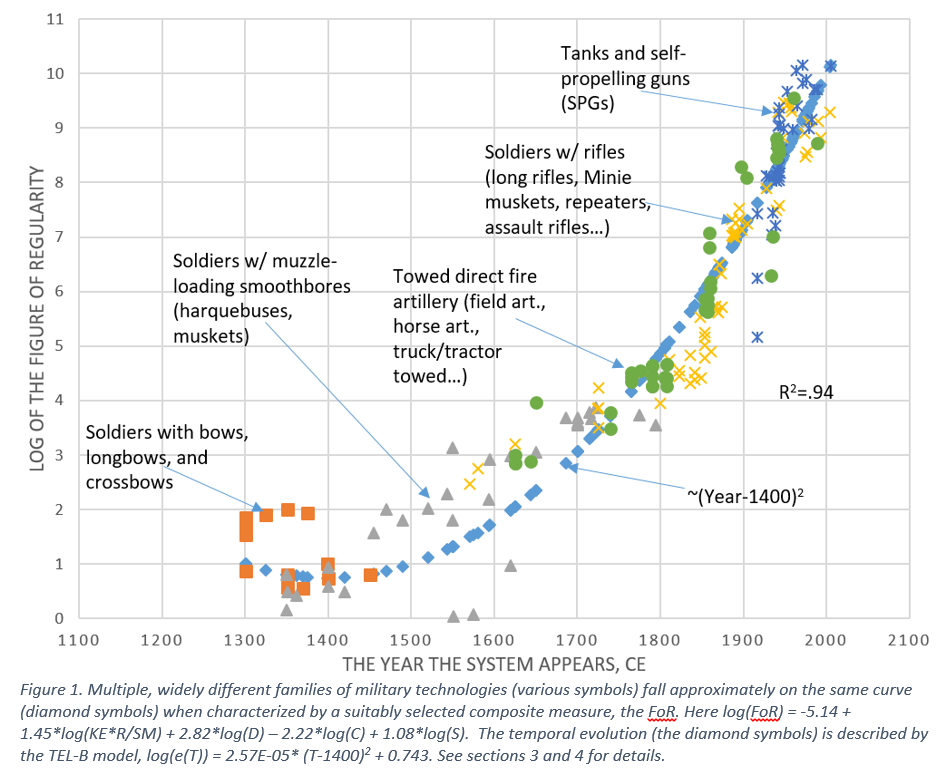
The work by ARL produced a graph similar to this one by Trevor Dupuy, except it was used to forecast the “figure of regularity” (which I gather means firepower or lethality). But if you note there is another significant line on Trevor Dupuy’s graph, besides the weapons’ “theoretical killing capacity.” It is labeled Dispersion. Note the left side of the graph where it is labeled “Disperion: Square Meters per Man in Combat.” It also goes up as the “theoretical killing capacity” of the weapons goes up.

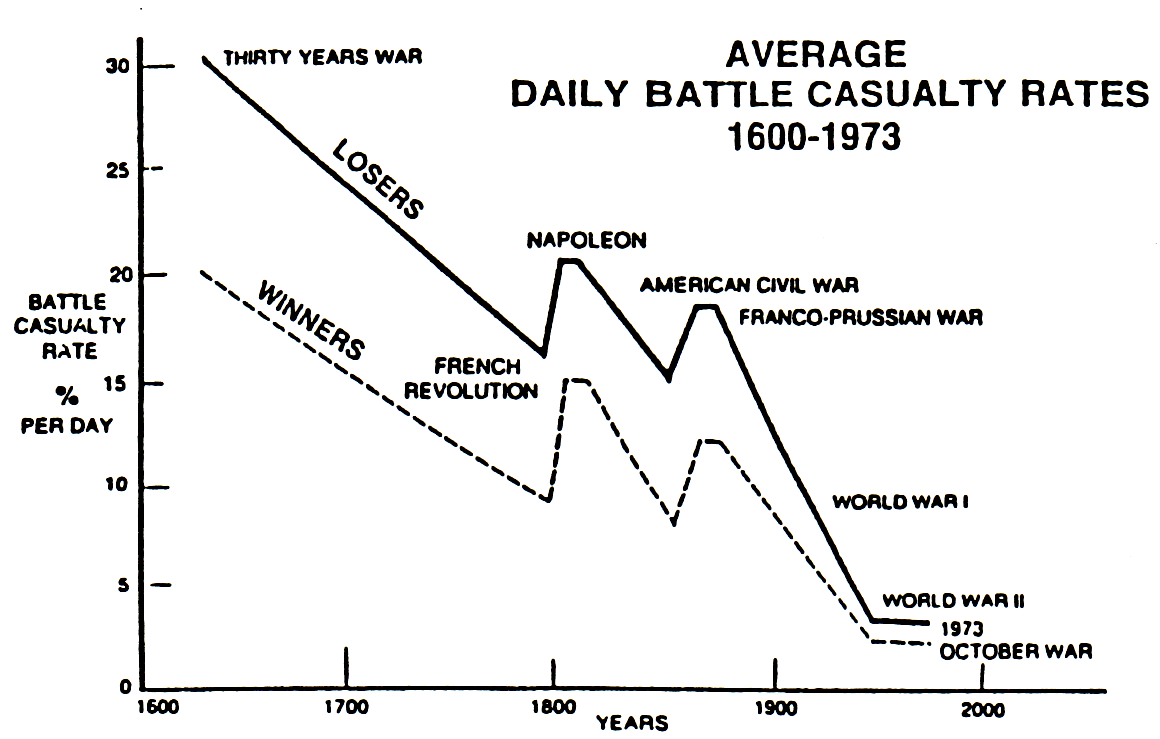
This is the other side of equation. For every action, there is an equal and opposite reaction to paraphrase a famous theorist. This results in this chart from Col. Dupuy:

Now….this is pretty damn significant….for as firepower, or lethality, or “theoretical killing capacity” has gone up, even geometrically…..daily casualty rates have declined. What is happening? Well, not only “for every action, there is an equal and opposite reaction,” but in fact, the reaction has outweighed the increase in firepower/lethality/killing capacity over time. This is worth thinking about. For as firepower has gone up, daily casualty rates have declined.

In fact, I did discuss this in my book War By Numbers (Chapter 13: The Effects of Dispersion on Combat). Clearly there was more to “dispersion” than just dispersion, and I tried to illustrate that with this chart:

To express it in simple English, people are dispersing, increasing engagement ranges and making more individual use of cover and concealment (page 166). Improvements in weapons, which occur on both sides, have also been counteracted by changes in deployment and defense. These changes have been more significant than the increases in lethality. See pages 166-169 of War by Numbers for a more complete explanation of this chart.

The issues related to lethality and forecasting the future of lethality gets a little complex and multifaceted.

Data Used for the ARL Paper

This is a follow-up post to this on the work being done at the Army Research Laboratory (ARL) by Dr. Alexander Kott:

The Evolution of Weapons and Warfare?

On page 9 of Dr. Kott’s paper provides the following table:

This is a sample of the data used for 8 weapons systems. He ended up using 195 weapon systems for his analysis. This is discussed in depth in his paper (referenced in his footnote 12): “Kott A. Initial datasets for explorations in long-range forecasting of military technologies. Adelphi (MD): Army Research Laboratory; 2019. 128 p. Report No.: ARL-SR-0417.” It is here:

https://www.arl.army.mil/arlreports/2019/ARL-SR-0417.pdf

These are all ground-based systems (no aircraft) that are either direct fire, or indirect fire systems using explosive rounds.


————-

P.S. Now the figure of a rate of fire of 30 for the house-mounted harquebusier got my attention, and no other muzzle loading weapon has a rate of fire above 3 rounds per minute. I did discuss this with Dr. Kott. He has a note in his papers that states:

MFS048: I consider the harquebusier (see Wikipedia “Harquebusier”) of the early 17th century (taken as 1620) as light armored at 160 J of protection and with armament that is an interpolation between a light harquebus (which they often could fire only once at the beginning of the engagement and produced about 1600 J KE) and a sword/saber that produced about 100 J per hack (see data for gladius in Note MFS005). I take this intermediate effect as corresponding to about 500 J, and assign an artificial projectile mass and velocity to account for this. I assume that the maximum rate of sword blows could reach 30 per minute.

Note, his figures are based upon cyclic rate of fire, not sustained rate of fire. This will be the subject of a future post.

The Evolution of Weapons and Warfare?

Many years ago, Trevor Dupuy wrote the book The Evolution of Weapons and Warfare. One of great graphics from that book was:

This graphic either intrigued or excited the reader; or gave him serious heartburn. It was a little ambitious in a lot of people’s mind.

Well, I found something more ambitious here: https://www.defenseone.com/technology/2019/09/formula-predicts-soldier-firepower-2050/159931/

It produces this graphic:

There is a “press release” here: https://scitechdaily.com/u-s-army-research-uncovers-pattern-in-progression-of-weapons-technologies/

The actual more detailed article is here: https://admin.govexec.com/media/universallaw.docx

This link leads to the 28-page article by Alexander Kott, chief scientist of the Army Research Laboratory (ARL). It is an interesting idea. It is an idea that I also toyed with at times, but never took the time to actually turn into a meaningful set of formulae.

I will probably have a few more comments on this work in the next couple of weeks.

Congressional Research Report on Uses of Armed Forces

I have recently been perusing the Congressional Research Report on Instances of Use of United States Armed Forces Abroad, 1798-2019, updated July 17, 2019. It is here: https://fas.org/sgp/crs/natsec/R42738.pdf

I do have some real heartburn with this report. For example, for the period from 1950-1959 they report six incidents of the use of U.S. armed forces. They are Korean War (1950-53), Formosa (1950-55), China (1954-55), Egypt (1956), Lebanon (1958) and The Caribbean (1959-1960). No Vietnam.

On 23 October 1954 President Eisenhower offered military aid to Vietnamese tin-pot dictator Prime Minister Diem. From 1957 through 1959 the United States had around 700 troops deployed to Vietnam. In 1957 we suffered our first casualties in 1959 lost our first two soldiers in Vietnam. Yet their first listing for Vietnam starts in 1964.

It does appears that the report uses very different standards over reporting for instances from decade to decade. For example, from 1950-1959 they report six uses of U.S. armed forces abroad, while in 2000-2019 they report 108. Many of the type of instances they report later in their list do not appear to be reported in the previous decades.

For example, the last instance listed on page 45 is the signature of a “defense-cooperation agreement” with Lithuania for 2019. Yet, the list does not record the United States joining NATO (North Atlantic Treaty Organization), which eventually grew to 29 members (including Lithuania). It is clear that we have signed dozens of these types of agreements from 1945-1979, and yet they are not listed back then, but are now being listed in 2019.

In another extreme example, they only have three instance reports for Vietnam, one covering 1964-1973 and two reports for 1975. Yet they have 32 instances for Bosnia from 1993-2006.

It is clear that different standards and levels of research are being used for events in the last few decades on that list than are used for events in the first few decades.

It appears that the list over time has been updated with considerable detail over the last couple of decades without a corresponding backdating to make sure that the listing is reporting the same type of events in the same detail from 1945-1979. Therefore, one cannot directly compare the number of instances from previous decades to the more recent decades because they are based upon a different standard and detail of reporting.

Around 2000, the report also appears to start listing the instances in more detail, and in 2014, they start footnoting the source for each of their listings. So the report is clearly expanding in scope and improving in detail, but this means that it cannot and should not be used for comparisons over time. Still, the absence of major events like the involvement of the United States armed forces in Vietnam before 1964 is a major shortfall. It is clear that this report needs to be properly updated for past events.

As this is the tax payer funded, government supervised Congressional Research Service report, I really do expect better from them.

Counting Holes in Tanks in Tunisia

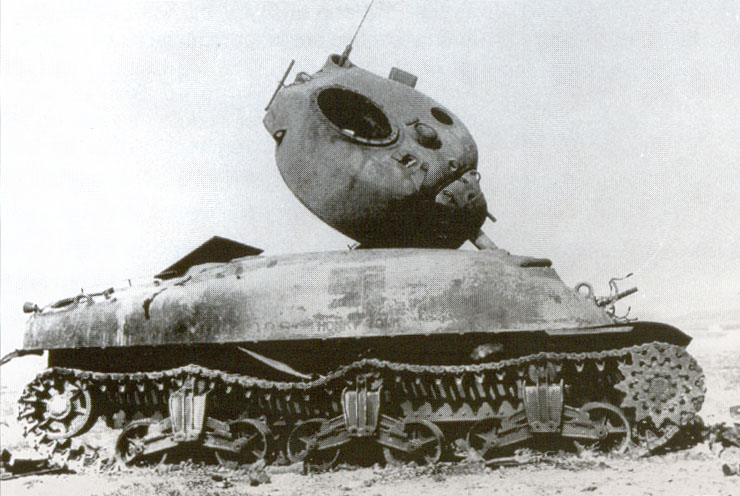
M4A1 Sherman destroyed in combat in Tunisia, 1943.

[NOTE: This piece was originally posted on 23 August 2016]

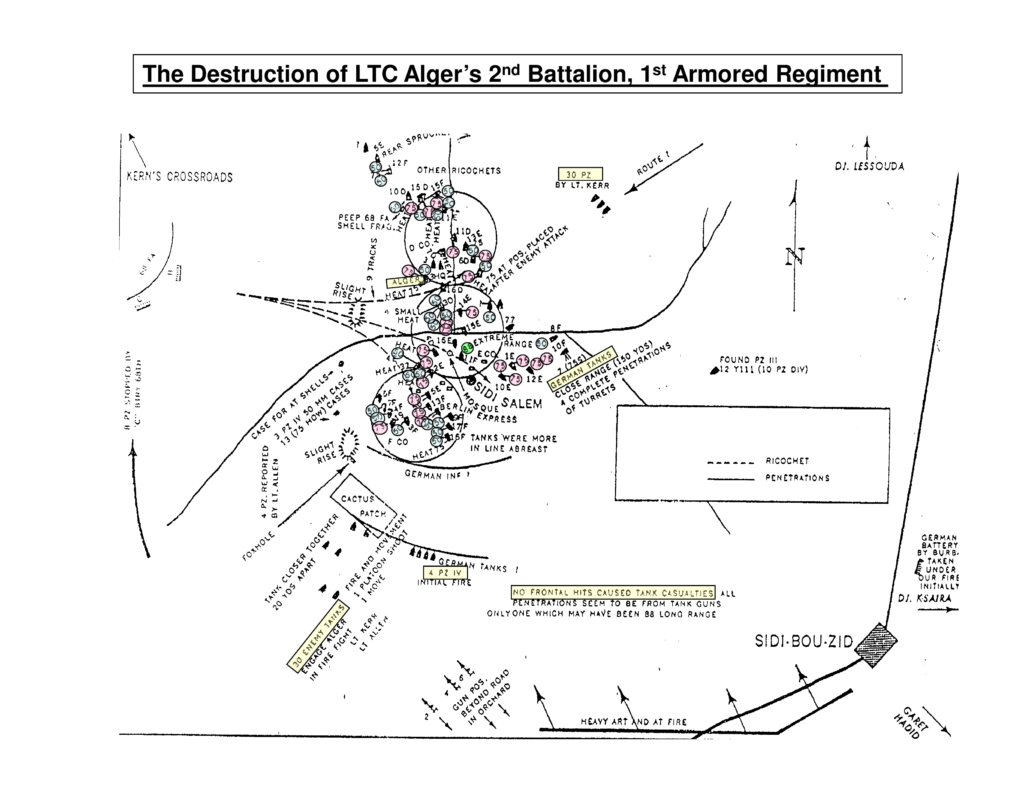
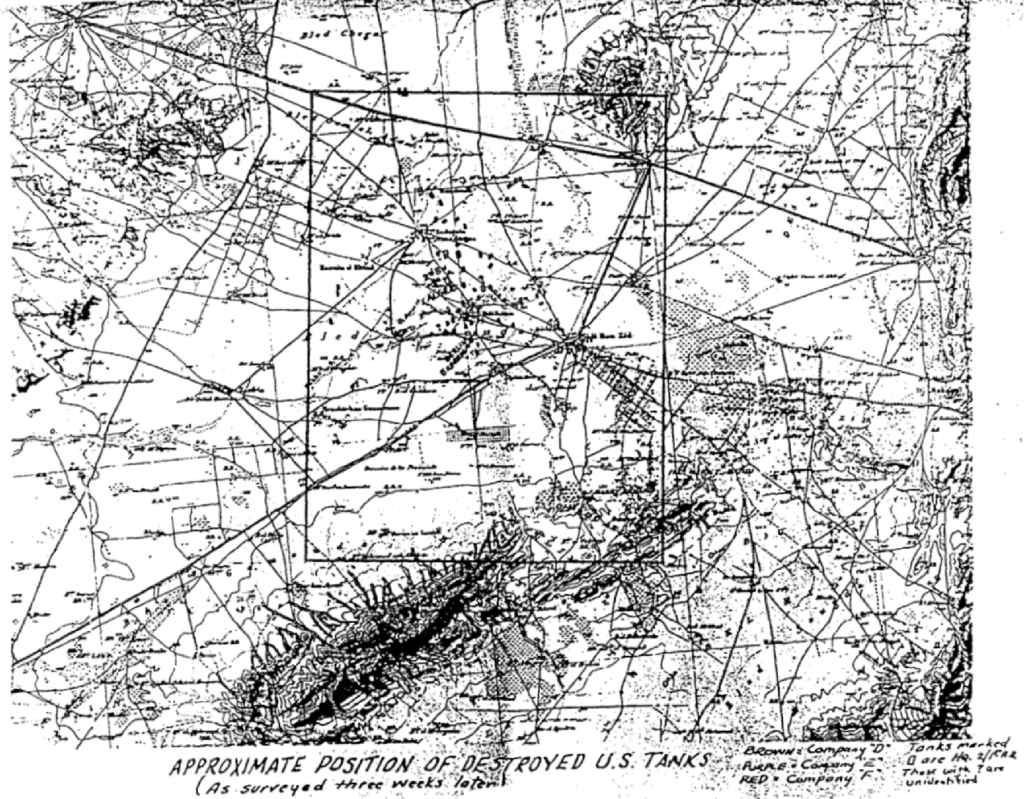
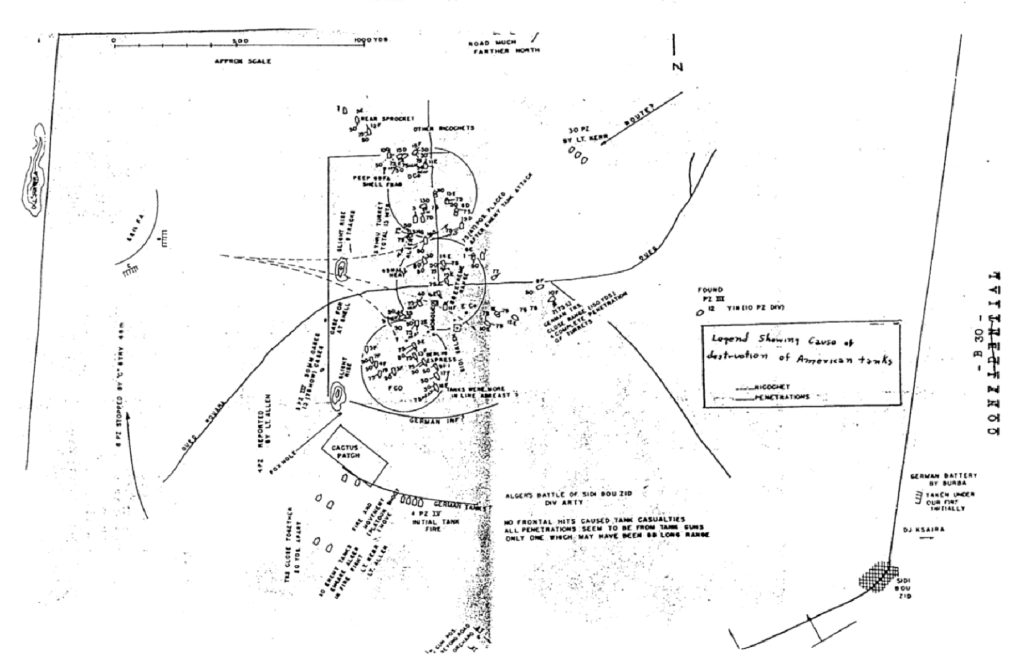
A few years ago, I came across a student battle analysis exercise prepared by the U.S. Army Combat Studies Institute on the Battle of Kasserine Pass in Tunisia in February 1943. At the time, I noted the diagram below (click for larger version), which showed the locations of U.S. tanks knocked out during a counterattack conducted by Combat Command C (CCC) of the U.S. 1st Armored Division against elements of the German 10th and 21st Panzer Divisions near the village of Sidi Bou Zid on 15 February 1943. Without reconnaissance and in the teeth of enemy air superiority, the inexperienced CCC attacked directly into a classic German tank ambush. CCC’s drive on Sidi Bou Zid was halted by a screen of German anti-tank guns, while elements of the two panzer divisions attacked the Americans on both flanks. By the time CCC withdrew several hours later, it had lost 46 of 52 M4 Sherman medium tanks, along with 15 officers and 298 men killed, captured, or missing.

Sidi Bou Zid00During a recent conversation with my colleague, Chris Lawrence, I recalled the diagram and became curious where it had originated. It identified the location of each destroyed tank, which company it belonged to, and what type of enemy weapon apparently destroyed it; significant battlefield features; and the general locations and movements of the enemy forces. What it revealed was significant. None of CCC’s M4 tanks were disabled or destroyed by a penetration of their frontal armor. Only one was hit by a German 88mm round from either the anti-tank guns or from the handful of available Panzer Mk. VI Tigers. All of the rest were hit with 50mm rounds from Panzer Mk. IIIs, which constituted most of the German force, or by 75mm rounds from Mk. IV’s. The Americans were not defeated by better German tanks. The M4 was superior to the Mk. III and equal to the Mk. IV; the dreaded 88mm anti-tank guns and Tiger tanks played little role in the destruction. The Americans had succumbed to superior German tactics and their own errors.

Counting dead tanks and analyzing their cause of death would have been an undertaking conducted by military operations researchers, at least in the early days of the profession. As Chris pointed out however, the Kasserine battle took place before the inception of operations research in the U.S. Army.

After a bit of digging online, I still have not been able to establish paternity of the diagram, but I think it was created as part of a battlefield survey conducted by the headquarters staff of either the U.S. 1st Armored Division, or one of its subordinate combat commands. The only reference I can find for it is as part of a historical report compiled by Brigadier General Paul Robinett, submitted to support the preparation of Northwest Africa: Seizing the Initiative in the West by George F. Howe, the U.S. Army Center of Military History’s (CMH) official history volume on U.S. Army operations in North Africa, published in 1956. Robinett was the commander of Combat Command B, U.S. 1st Armored Division during the Battle of Kasserine Pass, but did not participate in the engagement at Sidi Bou Zid. His report is excerpted in a set of readings (pp. 103-120) provided as background material for a Kasserine Pass staff ride prepared by CMH. (Curiously, the account of the 15 February engagement at Sidi Bou Zid in Northwest Africa [pp. 419-422] does not reference Robinett’s study.)

Robinett’s report appeared to include an annotated copy of a topographical map labeled “approximate location of destroyed U.S. tanks (as surveyed three weeks later).” This suggests that the battlefield was surveyed in late March 1943, after U.S. forces had defeated the Germans and regained control of the area.

Sidi Bou Zid02The report also included a version of the schematic diagram later reproduced by CMH. The notes on the map seem to indicate that the survey was the work of staff officers, perhaps at Robinett’s direction, possibly as part of an after-action report.

Sidi Bou Zid03If anyone knows more about the origins of this bit of battlefield archaeology, I would love to know more about it. As far as I know, this assessment was unique, at least in the U.S. Army in World War II.

Deja Vu all over again

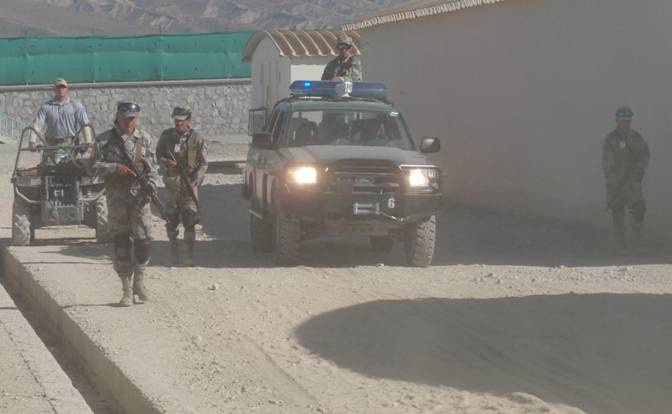
Afghan police in training, 5 October 2010 (taken by William A. Lawrence II)

Recent article on Afghan troop size: https://news.yahoo.com/afghan-troop-numbers-drop-sharply-040851162.html

A few points from the article:

  1. There are now 42,000 less troops reported for the Afghan security forces.
  2. U.S. has 14,000 troops there
    1. Of those, 9,000 involved in training, advising and assisting Afghan security forces.
  3. “The change was part of an effort by the United States and its partners to reduce opportunities for corrupt ANDSF officials to report ‘ghost’ (nonexistent) soldiers and police on personnel rolls in orders to pocket the salaries.”

A few observations:

  1. Didn’t we have the same issue in Vietnam (1965-1973) with the South Vietnamese Army?
  2. Our analysis of counterinsurgency efforts focused on force ratios and the political concept behind the insurgency. This does affect the force ratios (see America’s Modern Wars).
  3. It is good that we are correcting this, but we are in our 18th year of this war. What were we doing the previous 17?
  4. Does this again establish that: “The real lesson from history is that no one learns any lessons from history.”