There are ten references to “Dupuy” in the guide, which I believe is a first. I do not recall any previous Army manual referencing Trevor Dupuy’s work, even though I have seen his work in a manual or two without reference. It is nice that they have properly acknowledged his work.
The references are on:
Page xi: “Acknowledgements”: four references, two for Colonel Trevor N. Dupuy and two to his son Arnold C. Dupuy,. Ph.D.
Page 220: Table D-6. Division opposed rates of advance (km/day). I will have more comments about this table later.
Page 285. Paragraph G-162, Casualty Estimates: Two references. I will probably have a blog post about this later.
Page 402. References: Three references. I will probably have a blog post about this later also.
The two Trevor N. Dupuy books referenced in the Staff Reference Guide are the still out of print Numbers, Predictions & War (1979) and Attrition: Forecasting Battle Casualties and Equipment Losses in Modern War (1995). We still have 40 or so copies of Attrition for sale. See http://www.dupuyinstitute.org/booksfs.htm
“Historical data on direct-fire engagements “shows that our enemies generally shoot first 80 percent of the time,” Sando said. “We don’t like those odds, [so] we want to avoid the close fight if we can. If we can’t avoid it, we want to enter it under conditions that are favorable to us.”
The question was: did this statistic come from us or do we know where it came from? Well, it definitely did not come from our work or Trevor Dupuy’s work. I have never heard of such a claim before.
Does anyone know where this came from? Is there some study or piece of quantitative historical analysis that this claim is based upon. I have my doubts about the accuracy of this claim.
If the data was drawn from unconventional (recent) warfare scenarios, then by nature of those conflicts, the insurgents initiate engagements more often than the counterinsurgents do. Not sure it would be as high as 4-to-1.
If it was drawn from conventional war scenarios, then by their nature it should be 50/50, unless you are always the attacker. Even then I am not it would be as high as 4-to-1.
The Military Conflict Institute (TMCI) decided after a decade of existence that maybe the best use of their time was to write some papers and reports. So this they did over the years, all volunteer (unfunded) work done by some of the “graybeards” of the operations research and combat analysis community.
These three reports are provided here and will be available for as long as this blog exists:
First is called Anatomy of a Combat Model and was written in May 1995 by Lawrence J. Low. It was “prepared as part of a long-term contribution to the field.” It is 81 pages.:
The second paper was from 1997 and is called A Concise Theory of Combat. It was written by Edmund L. DuBois, Wayne P. Hughes, Jr., and Lawrence J. Low “…in collaboration with The Military Conflict Institute.” It is 172 pages.
The third paper was from 2013 and is called A Philosophy of War Its primary authors were Frank Benedict, Rosser Bobbitt, Ted DuBois, Chuck Hawkins, John Honig, Wayne Hughes, John McIver, Roger Mickelson, Clayton Newell, Itzhak Ravid, Russ Vane, Gene Visco and Greg Wilcox. It is 245 pages.
I would also argue that the books Understanding War and Attrition by Trevor Dupuy and my books America’s Modern Wars and War by Numbers are also very much in line with the original mission of TMCI , which Trevor Dupuy co-founded.
We do have the two reports prepared by Dr. Alexander Kott of the Army Research Laboratory (ARL) here. One is already been linked to before and is available on-line. The other has not been released yet:
Initial Data Sets for Explorations in Long-Range Forecasting of Military Technologies (May 2019): ARL-SR-0417
An Extended Data Set for Explorations in Long-Range Forecasting of Military Technologies (Jan 2020): ARL-SR-0423
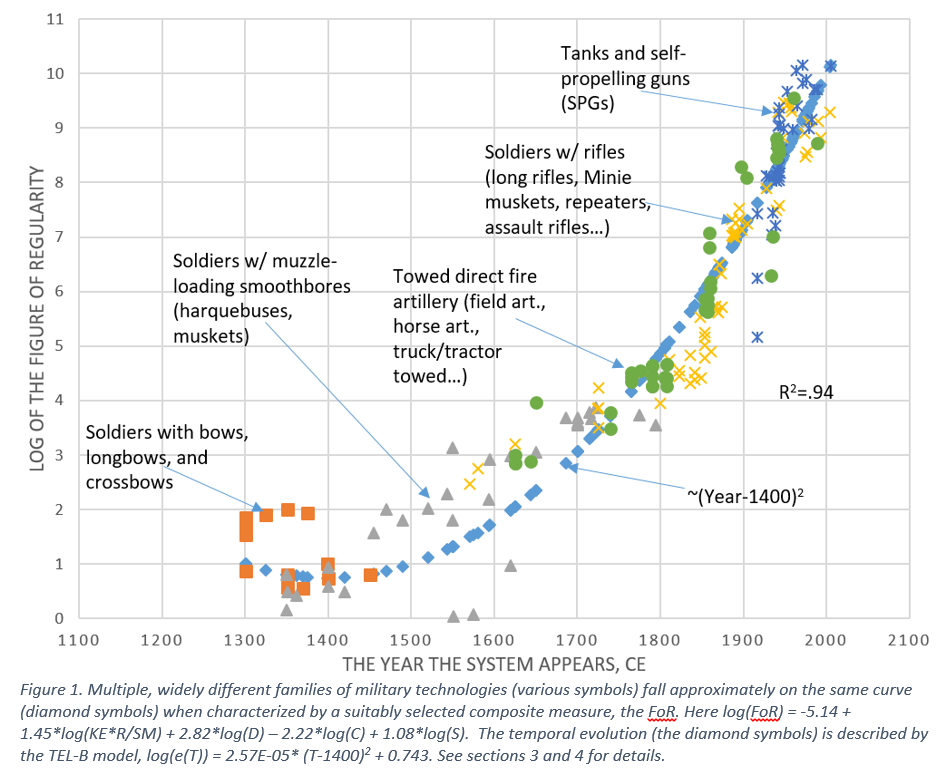
In an effort that is similar to what Trevor Dupuy was doing with his Evolution of Weapons and Warfare, we have another paper from Dr. Kott of Army Research Laboratory. This effort is in many respects Trevor Dupuy’s graph from Evolution of Weapons and Warfare brought forward in time. Many of the weapons and weapons systems calculations used are similar to what was done for Dupuy’s Quantified Judgment Model (QJM), including the use of formulae for determining the combat power of “ground-mobile, direct-fire systems (MFS).” This is very similar to what Trevor Dupuy did with Mobile Fighting Machines (MFM) in Numbers, Predictions and War.
At some point I may systematically analyze the similarities and differences between the two efforts, but this will take some time. Right now, I am trying to get another book finished. Anyhow, Dr. Kott’s latest article is here:
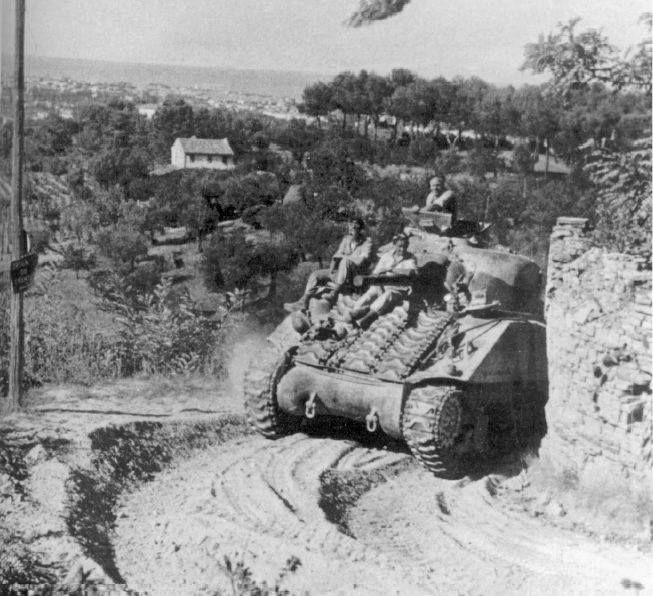
Polish Sherman III after battle on Gothic Line, Italy, September 1944
Having looked at casualty exchanges from my book War by Numbers and in the previous post, it is clear that there are notable differences between the German and Soviet armies, and between the Israeli and Arab armies. These differences show up in the force ratio tables, in the percent of wins, and in the casualty exchange ratios. As shown above, there is also a difference between the German and the U.S. and UK armies in Italy 1943-44, but this difference is no where to the same degree. These differences show up in the casualty exchange ratios. They also will show up in the force ratio comparisons that follow.
The Italian Campaign is an untapped goldmine for research into human factors. In addition to German, American and British armies, there were Brazilian, Canadian, French, French Algerian, French Moroccan, Greek, Indian, Italian, New Zealander, Polish, and South African forces there, among others like the Jewish brigade. There was also an African-American Division and a Japanese-American battalion and regiment actively engaged in this theater. Also the German records are much better than they were in the second half of 1944. So, the primary source data these engagements are built from are better than the engagements from the ETO.
We have 137 engagements from the Italian Campaign. There are 136 from 9 September to 4 June 1944 and one from13-17 September 1944. Of those, 70 consisted of the Americans attacking, 49 consisted of armed forces of the United Kingdom in the offense, and 18 consisted of the Germans attacks, often limited and local counterattacks (eight attacks against the United States and ten attacks against the UK). So, let us compare these based upon force ratios.
American Army attacking the German Army, Italy 1943-44
(70 cases in the complete data set, 62 cases in the culled data set)
Force Ratio……………Percent Attacker Wins………………..Number of Cases
There were seven cases of engagements coded as “limited attacks” and one case of “other”. These eight cases are excluded in the table above on those lines in italics.
Needless to say, this is a fairly good performance by the American Army, with them winning more than 40% the attacks below two-to-one and pretty winning most of them (86%) at odds above two-to-one.
British Army attacking the German Army, Italy 1943-44
(49 cases in the complete data set, 39 cases in the culled data set)
Force Ratio………………..Percent Attacker Wins………………..Number of Cases
There were five cases of limited action and five cases of limited attack. These ten cases are excluded in the table above on those lines in italics.
This again shows the difference in performance between the American Army and the British Army. This is always an uncomfortable comparison, as this author is somewhat of an anglophile with a grandfather from Liverpool; but data is data. In this case they won 44% of the time at attacks below two-to-one, which is similar to what the U.S. Army did. But then, they only won only 63% of the time at odds above two-to-one (using the culled data set). This could just be statistical anomaly as we are only looking at 30 cases, but is does support the results we are seeing from the casualty data.
What is interesting is the mix of attacks. For the American Army 77% of the attacks were at odds below two-to-one, for the British Army only 23% of the attacks were at odds below two-to-one (using the culled data sets). While these 99 cases do not include every engagement in the Italian Campaign at that time, they include many of the major and significant ones. They are probably a good representation. This does probably reflect a little reality here, in that the British tended to be more conservative on the attack then the Americans. This is also demonstrated by the British lower average loss per engagement.[7]
The reverse, which is when the Germans are attacking, does not provide a clear picture.
German Army attacking the American and British Army, Italy 1943-44 – complete data set (18 cases)
Force Ratio…………………..Percent Attacker Wins…………………Number of Cases
0.72 to 0.84………………………….0%………………………………………………7
1.17 to 1.48………………………..50…………………………………………………6
1.89…………………………………….0…………………………………………………1
2.16 to 2.20………………………..50…………………………………………………2
Gap in data
3.12 to 3.24………………………..50…………………………………………………2
The Germans only win in 28% of the cases here. They win in 13% of the engagements versus the U.S. (8 cases) and 40% of the engagements the UK (10 cases). Still, at low odds attacks (1.17 to 1.48-to-1) they are winning 50% of the time. They are conducting 78% of their attacks at odds below two-to-one.
In the end, the analysis here is limited by the number of cases. It is hard to draw any definitive conclusions from only 18 cases of attacks. Clearly the analysis would benefit with a more exhaustive collection of engagements from the Italian Campaign. This would require a significant investment of time (and money).[8]
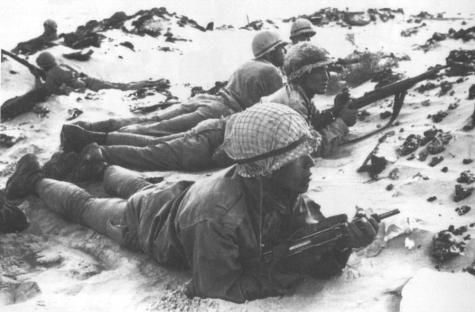
Regiment de Trois-Rivieres tanks entering the ruins of Regabuto, August 4th, 1943. Source: http://www.sfu.ca/tracesofthepast/wwii_html/it.htm
————————–
[1] There were four limited attacks that resulted in three defender wins and a draw. There was one “other” that was an attacker win.
[2] There three limited attacks that resulted in two defender wins and a draw.
[3] There were four “limited actions” that were defender wins and one “limited attack” that was a defender win.
[4] There as one “limited action” that was a defender win and two “limited attacks” that were defender wins.
[5] There were two “limited attacks” that were defender wins.
[6] The author’s grandfather was born in Liverpool and raised in Liverpool, England and Ryls, Wales. He served in the British merchant marine during World War I and afterwards was part of the British intervention at Murmansk Russia in 1918-1919. See the blog post:
[7] See War by Numbers, pages 25-27. The data shows that for the Americans in those 36 cases where their attack was successful they suffered an average of 353 casualties per engagement. For the 34 American attacks that were not successful they suffered an average of 351 casualties per engagement. For the UK, in the 23 cases where their attack was successful, the UK suffered an average of 213 casualties per engagement. Of the 26 cases where the UK attacks were not successful, they suffered an average of 137 casualties per engagement.
[8] Curt Johnson, the vice-president of HERO, estimated that it took an average of three man-days to create an engagement. He was involved in developing the original database that included about half of the 137 Italian Campaign engagements. My estimation parameter, including the primary source research required to conduct this is more like six days. Regardless, this would mean that just to create this 137 case database took an estimated 411 to 822 man-days, or 1.6 to 3.3 man-years of effort. Therefore, to expand this data set to a more useful number of engagements is going to take several years of effort.
We have 66 engagements in our database from after World War II. There are 51 cases from the Arab-Israeli Wars and 15 cases from the 1991 Gulf War.
Arab-Israeli Wars 1956-1973 (51 cases)
Force Ratio…………………Percent Attacker Wins………………..Number of Cases
0.54 to 0.97-to-1……………….76%…………………………………………….17
1.00 to 1.47-to-1……………….82……………………………………………….11
1.51 to 1.99-to-1……………….50…………………………………………………4
2.04 to 2.25-to-1……………….50…………………………………………………4
2.90-to-1……………………….100…………………………………………………1
3.03 to 3.59-to-1…………………0…………………………………………………2
3.50 to 3.96-to-1……………….25…………………………………………………4
4.11 to 5.87-to-1……………….40…………………………………………………5
6.06-to-1……………………….100…………………………………………………1
8.02 to 12.18-to-1…………….100…………………………………………………2
Now, this data is highly variable, with the largest number of attacks being conducted at less than one-to-one odds and the attacker winning 76% of the time. This is because of a significant difference in the combat capability of Israeli forces compared to the Egyptians, Syrians and other Arab armies that they are engaged with. This difference is well documented and discussed in more depth in my book War by Numbers. Of the 17 attacks at less than one-to-one odds, 16 were conducted by the Israelis and only one attack was conducted by the Arab armies. The Iraqi attack at those low odds was resoundingly defeated (Tel el Hara, 11 October 1973).
There is a similar performance disparity between the German and the Soviet armies in 1943. This also affects the force ratio data from World War II. We will separate these cases out by who the attacker is just to clarify the results. In the case of the Gulf War, the difference in morale, motivation and performance of the two armies were extremely disparate. This is a fairly extreme case, although not the only such case in history.
Gulf War (1991):
Force Ratio…………………..Percent Attacker Wins…………………Number of Cases
0.20 to 0.21…………………………0…………………………………………………..2
0.64 to 0.93………………………..67…………………………………………………..3
1.10 to 1.16………………………100…………………………………………………..2
None between 1.16 and 2.47
2.47……………………………….100………………………………………………….1
2.60 to 2.86………………………100………………………………………………….5
3.00 to 3.26………………………..50………………………………………………….2
One is hesitant to draw any conclusions from this data. The one attack that failed at three-to-one was the Iraqi Army attack at Khafji 29 January – 1 February 1991. In fact, all four failed attacks in the data set occurred when the Iraqis were attacking.
Anyhow, these databases can certainly be expanded and further analysis can be done, but good luck finding the three-to-one rule in this data that results in the defender winning 50% of the time. It is clear that from 1600 to 1991 that the attacker won more often than not at two-to-one odds or even lower, depending on the period and the forces involved. There is really no historical evidence supporting the Army version of this rule that I know of. I have been in this industry for over three decades and have not seen such evidence. I am not aware of any databases the size, depth or range of ones used here. If this historical data does not establish the rule, then where is the historical data that does?
There are 576 cases from World War II in our division-level database. There are no engagements from 1939, only two from 1940, seven from 1941, one from 1942 and the rest are from 1943-45.
World War II (576 cases) – complete data set
Force Ratio…………………….Percent Attacker Wins……………….Number of Cases
0.25 to 0.49………………………22%………………………………………………..9
0.50 to 0.98………………………30…………………………………………………50
1.00 to 1.49………………………55……………………………………………….128
1.50 to 1.96………………………61……………………………………………….117
2.01 to 2.49………………………73…………………………………………………48
2.52 to 2.99………………………82…………………………………………………44
3.00 to 3.49………………………76…………………………………………………41
3.50 to 3.98………………………85…………………………………………………26
4.06 to 5.86………………………68…………………………………………………59
6.17 to 7.90………………………87…………………………………………………15
8.20 to 17.87……………………100…………………………………………………20
This clearly makes our point in spades about the U.S. Army three-to-one rule. Above one-to-one odds the attacker wins over half the time and above two-to-one odds the attacker wins over 70% of the time. This is the un-culled data set. The culled data set with 102 cases removed that are “limited action,” limited attack” or “other” consists of only 474 cases. It shows the following:
World War II (474 cases) – culled data set
Force Ratio…………………Percent Attacker Wins…………………Number of Cases
0.25 to 0.49……………………..25%………………………………………………..8
0.50 to 0.98……………………..43………………………………………………….35
1.00 to 1.49……………………..63………………………………………………..111
1.50 to 1.96……………………..68………………………………………………..102
2.01 to 2.49……………………..83………………………………………………….41
2.52 to 2.99……………………..82………………………………………………….39
3.00 to 3.49……………………..79………………………………………………….33
3.50 to 3.98……………………..84………………………………………………….25
4.06 to 5.86……………………..77………………………………………………….48
6.17 to 7.90……………………..87………………………………………………….15
8.20 to 17.87…………………..100………………………………………………….15
22.84-198.69…………………..100…………………………………………………..2
Again, no surprises in this data, and of course, it parallels the patterns seen in the previous data sets.
Now, both World War I and World War II are so massive that with a diligent research effort, thousands of engagements could be assembled. This does take time. Our post-World War II includes almost every significant division-level engagement from the Arab-Israeli fighting of 1956, 1967, 1968 and 1973. The Gulf War category includes every significant division-level engagement from 1991. Let us look at each of them in turn:
World War I and others (30 cases)
Force Ratio……………………Percent Attacker Wins……………..Number of Cases
0.67 to 0.99-to-1………………..29%…………………………………………..7
1.01 to 1.47-to-1………………..11……………………………………………..9
1.58 to 1.80-to-1………………….0……………………………………………..2
2.00 to 2.13-to-1………………..67……………………………………………..3
2.50 to 2.80-to-1………………..67……………………………………………..3
3.00 to 3.20-to-1………………..33……………………………………………..3
4.04 to 4.38-to-1………………..50……………………………………………..2
6.32-to-1………………………..100……………………………………………..1
Note that the attacker is winning to majority of the time at two-to-one odds and higher. The 33% wins in the three-to-one category consists of one victory and two drawn engagements (Bazentin Ridge from the Somme and First Dardanelles Landing from Gallipoli). In both of these cases the attacker advanced, although the engagement is coded as a draw. These three cases do not make a strong argument. This data collection is too small to draw any real conclusions from. The database could certainly be expanded to thousands of cases given time and effort. We also have a collection of engagements from World War I at brigade- and battalion-level and a number of engagements above division-level. These will be explored later.