Category Lessons of History

Force Ratios and Counterinsurgency IV

picture-17Much has changed since James Quinliven kicked off discussion over manpower and counterinsurgency. One of the most significant differences is the availability now of useful collections of historical data for analysis.


Previous posts in this series:
Force Ratios and Counterinsurgency
Force Ratios and Counterinsurgency II
Force Ratios and Counterinsurgency III


Dataset origins

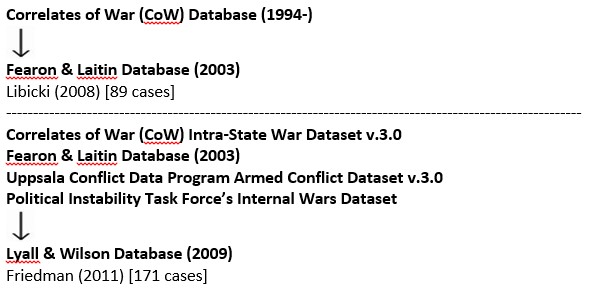
Detailed below are the lineages for the data sets used in six of the seven analyses I have discussed. The cases used by Libicki and Friedman were drawn from databases created by several academic organizations and work by James Fearon and Daivd Laitin [1] and, Jason Lyall and Isaiah Wilson III [2]. Both Libicki and Friedman contributed additional research of their own to complete their datasets.

Datasets 01

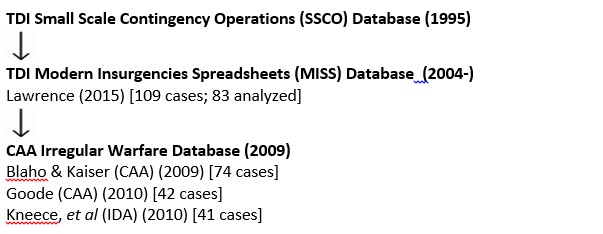
The data used by Lawrence, CAA, and IDA was all researched and compiled by The Dupuy Institute (TDI). Both TDI’s Modern Insurgencies Spreadsheets (MISS) Database and CAA’s Irregular Warfare Database contain data on at least 75 variables for each historical case.

Datasets 02

The details of the dataset created and used by Hossack at Dstl have not been addressed in public forums, but it is likely to be similar.

Future directions for research

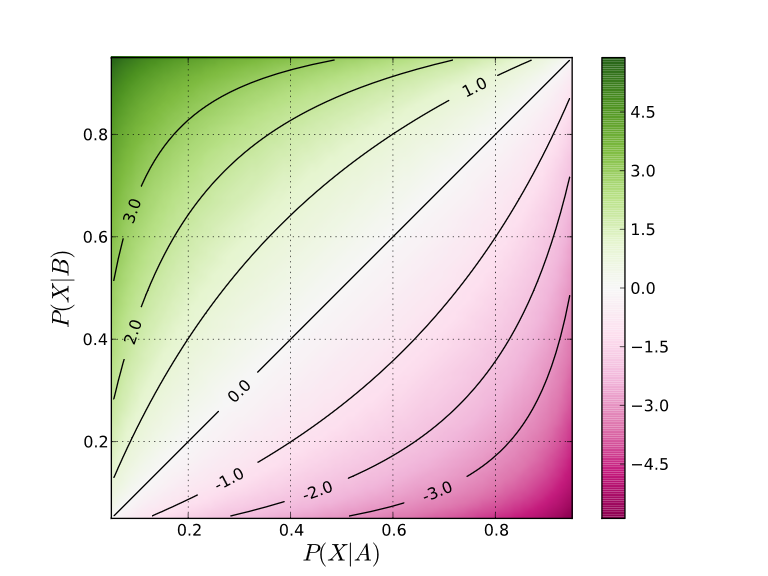
Given the general consensus of all of the studies that counterinsurgent manpower levels do correlate with outcome, the apparent disagreement over force ratio and troop density measures may not be as relevant as previously thought. More data collection and testing should be done to verify the validity of the postulated relationship between counterinsurgent force levels and the local population within an active area of operation.

Though there was consensus on the advantage of counterinsurgent manpower, there was no agreement as to its overall importance. More analysis is needed to examine just how decisive manpower advantages may be. Hossack and Goode suggested that a counterinsurgent manpower advantage may be important largely to prevent insurgent military success. Hossack and Friedman suggested that there may be points of diminishing manpower returns and Lawrence indicated that a force ratio advantage was decisive only against insurgencies with broad popular support. Given the potential difficulties in generating significant additional counterinsurgent manpower, it may be applicable and useful only under particular circumstances.

Due to the limitations of the available data, all of the studies based their analysis on data averages. The figures used for insurgent and counterinsurgent force sizes were usually selected from the highest annual totals across years or decades. All of the studies indicated the need to obtain more detailed data on individual cases to allow for more discreet and dynamic analysis to look for undetected links and patterns. Lawrence in particular called for examination of conditions before insurgencies begin and when they are just getting underway.

Friedman noted the value of quantitative analysis in helping to drive forward discussion and debate on defense and security topics. Research and analysis on insurgency and counterinsurgency was left to languish during the Vietnam War, only to be exhumed under the dire circumstances of the U.S. war in Iraq. It would be deeply unfortunate if promising new lines of inquiry were abandoned again.

Notes

[1] James D. Fearon, and David D. Laitin, “Ethnicity, Insurgency, and Civil WarAmerican Political Science Review 97, 1, Feb 2003

[2] Lyall, Jason and Isaiah Wilson III, “Rage Against the Machines: Explaining Outcomes in Counterinsurgency Wars,” International Organization 63, Winter 2009

Bombing Kosovo in 1999 versus the Islamic State in 2015

I just wanted to do a little ‘back of the envelope” comparison between these two air campaigns. In the case of Kosovo, if you believe the casualty figures provided virtue of Wikipedia (which are not always incorrect), they flew 38,004 sorties and killed 956 supposed hostiles (that is 956 killed, 5,173 wounded and 52 missing for a total of 6,181 casualties). Or, maybe that should be 10,484 “strike sorties.” Regardless, this was either 38 sorties per person killed or 10 “strike sorties” per person killed (missing are counted among the killed for this calculation). Or if based on total casualties, 6 sorties per casualty or 1.7 “strike sorties” per casualty. Now, only 35% of the bombs and missiles used were precision guided.

If you look at the link in my post “Bleeding an Insurgency to Death” you could surmise that in 2015 in Iraq and Syria, the U.S. and its allies dropped 28,714 “munitions.” They claim 25,500 killed. This is 1.13 “munitions dropped” per person claimed killed. So, one bomb kills one person.

Kosovo was 23,614 “air munitions” for 1,008 deaths or 6,181 casualties. This is 23 “air munitions” per person killed or 3.8 “air munitions” per casualty. So, Kosovo in 1999 is 23.42 ‘air munitions” per person killed while Syria and Iraq in 2015 is 1.13 “munitions dropped” per person claimed killed. This is an effectiveness improvement of over 20 times! Of course, these campaigns were conducted against different terrain and somewhat different circumstances that may favor one over the other. We have not evaluated those factors (after all, this is just “back-of-the-envelope” calculations).

Now, in Kosovo, only 35% of the bombs and missiles used were precision guided. Don’t know what the figure is now, but if it was 100%, and if we assumed that only the precision guided munitions in Kosovo hit anything (a questionable assumption), then we still end up with an effectiveness improvement of over seven times.

But maybe the 25,500 killed really means 25,500 killed and wounded (of which the majority would be wounded). In that case using the Kosovo figures for total casualties you end up with 3.82 “air munitions” per casualty versus 1.13 “munitions dropped” per casualty for Syria and Iraq. Again, if we completely discount the effectiveness of non-precision guided munitions in Kosovo, and assume that in Syria and Iraq 100% of the munitions are precision guided, then we end up with similar levels of effectiveness per casualty (1.34 “air munitions” versus 1.13 “munitions dropped” per casualty). There are a lot of “ifs” to get to this point.

Now, one should not put to much stock in the “back of the envelope” calculations, but something doesn’t quite line up here.

Force Ratios and Counterinsurgency III

"Odds ratio map" by Skbkekas - Own work. This graphic was created with matplotlib. Licensed under CC BY-SA 3.0 via Commons
“Odds ratio map” by Skbkekas – Own work. This graphic was created with matplotlib. Licensed under CC BY-SA 3.0 via Commons

Additional posts in this series:
Force Ratios and Counterinsurgency
Force Ratios and Counterinsurgency II
Force Ratios and Counterinsurgency IV


To summarize the findings of the seven large-N case studies of the relationship between manpower and counterinsurgency:

Troop Density (troops per inhabitant)

  • Goode [CAA] (2009) asserted a statistically meaningful relationship between troop density and insurgency outcome.
  • Hossack [Dstl] (2007), Blaho & Kaiser [CAA] (2009), and Lawrence [TDI] (2015) found no statistically meaningful relationship between troop density and insurgency outcome.
  • Kneece, et al [IDA] (2010) and Friedman (2011) found a statistically meaningful relationship between troop density in defined areas of operation and insurgency outcome
  • Friedman (2011) asserted that there was no discernible statistical support for a benchmark troop density level (i.e. 20 troops/1,000 inhabitants).

Force Ratios (counterinsurgents per insurgent)

  • Hossack [Dstl] (2007), Libicki [RAND] (2008), Blaho & Kaiser [CAA] (2009), and Lawrence [TDI] (2015) asserted a statistically meaningful relationship between force ratios and insurgency outcome.
  • Goode [CAA] (2009) and Kneece, et al [IDA] (2010) rejected the validity of a relationship between force ratios and outcome due to an inherent unreliability of relevant data.
  • Friedman (2011) identified a statistically meaningful relationship between force ratios and outcome when controls were applied to the data.
  • Lawrence [TDI] (2015) found a strong relationship between force ratios, the nature of an insurgency, and insurgency outcome.

Manpower and insurgency
At first glance, it would appear that despite the recent availability of historical data on insurgencies, the debate over the relationship of force ratios and troop density to outcomes remains an open one. Amidst the disagreement, however, one salient conclusion stands out: all of the studies generally agree that there is a positive correlation between counterinsurgent force strength and the outcome of an insurgency. The collective analysis suggests that the commitment of larger numbers of counterinsurgent forces has historically correlated with more successful counterinsurgency campaign outcomes. What remains open to dispute is just how significant this finding is, or whether it matters at all.

Troop density (countrywide) vs. troop density (AO)
Another broad conclusion from these studies is that there appears to be no statistical support for the original Quinlivan troop density construct as measured by the number of counterinsurgents per inhabitant. The only study to support this without qualification was Goode [CAA] (2009). The extensive data collection and testing conducted by Friedman (2011) also cast serious doubt on the validity of the notion of force level benchmarks.

However, Kneece, et al [IDA] (2010) and Friedman (2011) both made a compelling case for the usefulness of troop density as measured by the number of counterinsurgents per inhabitant within a defined area of counterinsurgent operations. When measured in this manner, a clear correlation was found to exist between troop density and insurgency outcome. This notion has considerable qualitative appeal. Insurgencies generally do not occur uniformly throughout an entire country. Insurgent activity usually takes place within a specific region or area. Consequently, counterinsurgent forces are not deployed uniformly throughout a country, but rather to areas with the highest insurgent activity. This revised troop density construct definitely merits further study.

Force ratios and data reliability
One argument raised against the applicability of using force ratios is that data relating to insurgents is based on either counterinsurgent estimates or imprecise counts, or unreliable information from insurgent sources. This uncertainty therefore simply renders the data invalid for analysis. This claim seems overstated. While it is relatively certain that there are inaccuracies in such data, it is implausible to think that it is all hopelessly flawed or fictitious. In nearly all the datasets, the data are collected as reported. This variety in sourcing would seem to auger against systematic bias, which would truly render the data invalid.

Data collected in an unsystematic way is definitely going to be fuzzy or noisy, but again, this does not invalidate its usefulness. As my colleague Chris Lawrence contends, even if the insurgent force strength data is inaccurate, it is not incorrect by an order of magnitude. The range of error is probably more like +/- 50%. Random changes in insurgent force size by +/- 50% still produce similar analytical results after regression analysis. Insurgent force size data may be noisy, but that in itself is an insufficient reason alone to discount it.

Sensitivity of results to coding choices/definitions
Given the general agreement that there is a relationship between manpower and outcome, it seems odd that there is still deep disagreement over specific aspects of this. One possible explanation for this is the wide variation in definitions of terms and variables. It should be noted that despite the very large body of research and scholarship on insurgency and counterinsurgency, there is very little consensus on how to define such conflicts. Both Kneece, et al [IDA] (2010) and Friedman (2011) pointed out that analytical outcomes are sensitive to how the variables are defined. Kneece, et al [IDA] (2010) did a quick check on how winning or losing was scored among 36 of the same cases in five different data sets and found agreement on only 11.

Some of the variations in the conclusions may be due to case selection. There are no universally accepted definitions for what insurgency or counterinsurgency are, or any meaningful distinction between these types of conflicts and less violent variants such as peacekeeping operations, interventions, or stabilization operations. The authors of each of the studies established clear but differing criteria for case selection, resulting in analyses of similar datasets with some overlap in common cases.

My next and final post in this series will address the origins of the various datasets and potential future directions for research on this subject.

Bleeding an Insurgency to Death

The most meaningful quote I know of about the value of historical study is “The lessons of history are that nobody learns the lessons of history.” Some may write this off as just cynicism, but unfortunately, “history repeats itself,” and we have seen this all too often. There is 3,400 years of documented military history, and this rather extensive data base of material is often ignored; and when it is accessed, often it is to grab an example or two that supports whatever pre-conceived notion that the user already has. It is a discipline that has been poorly used and often abused. Part of our interest in quantified historical analysis is that we want to study the norms, not the exceptions; not the odd case or two, but what are the overall pattern and trends. Sometimes I think the norms get lost in all the interesting and insightful case studies.

Anyhow, there was a posting in another blog that my fellow blogger, Dr. Woodford, brought to my attention that included the formula 30,000 – 25,000 = 30,000. The link to his post is below:

http://blogs.cfr.org/zenko/2016/01/07/how-many-bombs-did-the-united-states-drop-in-2015/#

Mr. Zenko says in part:

The problem with this “kill-em’-all with airstrikes” rule, is that it is not working. Pentagon officials claim that at least 25,000 Islamic State fighters have been killed (an anonymous official said 23,000 in November, while on Wednesday, Warren added “about 2,500” more were killed in December.) Remarkably, they also claim that alongside the 25,000 fighters killed, only 6 civilians have “likely” been killed in the seventeen-month air campaign. At the same time, officials admit that the size of the group has remained wholly unchanged. In 2014, the Central Intelligence Agency (CIA) estimated the size of the Islamic State to be between 20,000 and 31,000 fighters, while on Wednesday, Warren again repeated the 30,000 estimate. To summarize the anti-Islamic State bombing calculus: 30,000 – 25,000 = 30,000.

This post brings back a few memories of our work on Iraq in 2004-2006. If you note in my book America’s Modern Wars there is an entire chapter on “Estimating Insurgent Strength” (pages 115-120). Part of our concern, which we briefly documented on page 116, was that the officially release estimated of insurgent strength remained at 5,000 forever. It was a constant figure, no matter how nasty the situation got. We really did not believe it. Then, when everything fell apart and the insurgents grabbed Mosul (sound familiar?), the estimate was revised upwards to 20,000. This was better, but it still seemed too low to us, especially as the U.S. was claiming something like 12,000 insurgents killed a year. Needless to say, if they were killing 60% of the insurgents a year, this was an insurgency that was going to quickly be bled to death. As we now know with a decade of hindsight, this did not happen.

This was the reason for section in my book called “Bleeding an Insurgency to Death (pages 156-158). Needless to say, something was wrong with the math somewhere, and our own estimate of insurgent strength was something like 60,000 (see page 116). As Mr. Zenko’s blog post points out, something remains wrong with the math in the air war against ISIL.