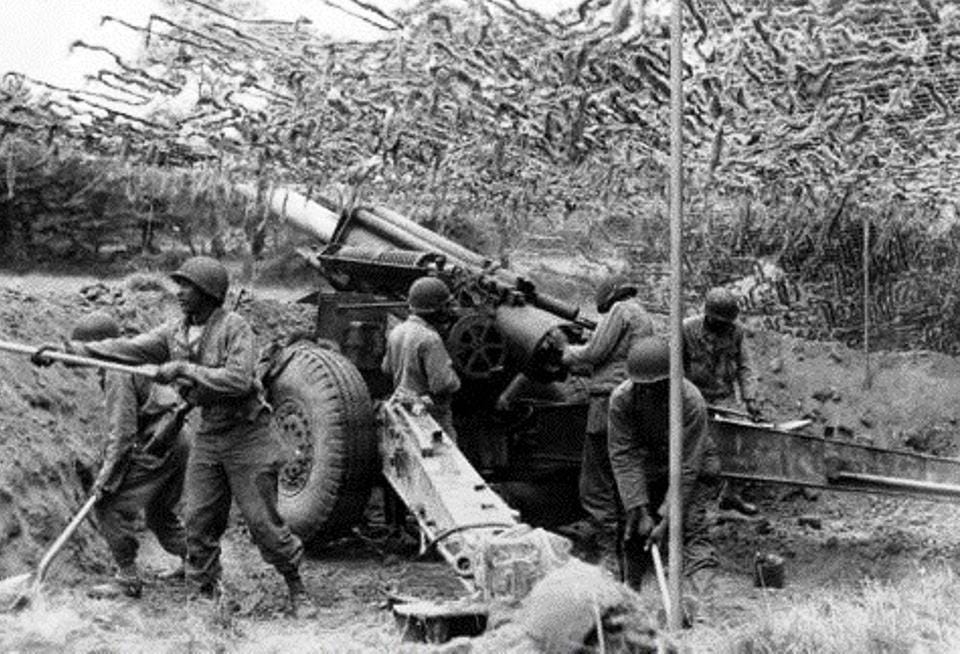
The U.S. Army 333rd Field Artillery Battalion (Colored) in Normandy, July 1944 (US Army Photo/Tom Gregg)
[This series of posts is adapted from the article “Artillery Effectiveness vs. Armor,” by Richard C. Anderson, Jr., originally published in the June 1997 edition of the International TNDM Newsletter.]
[11] Five of the 13 counted as unknown were penetrated by both armor piercing shot and by infantry hollow charge weapons. There was no evidence to indicate which was the original cause of the loss.
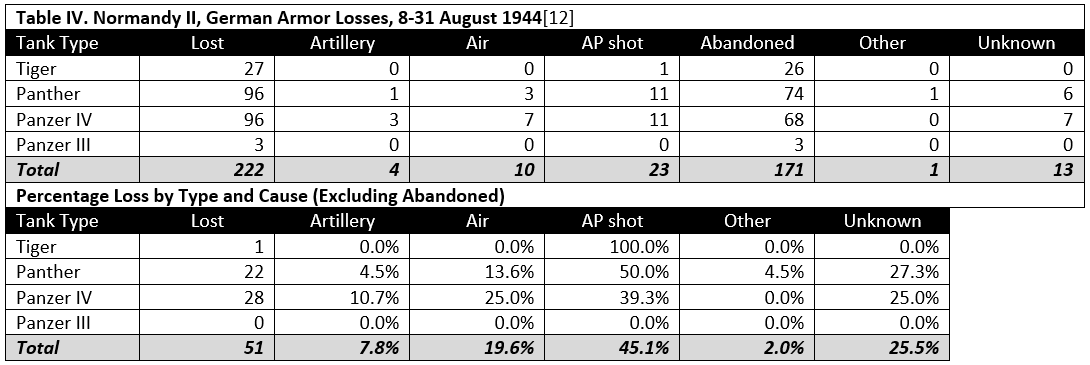
[12] From ORS Report No. 17
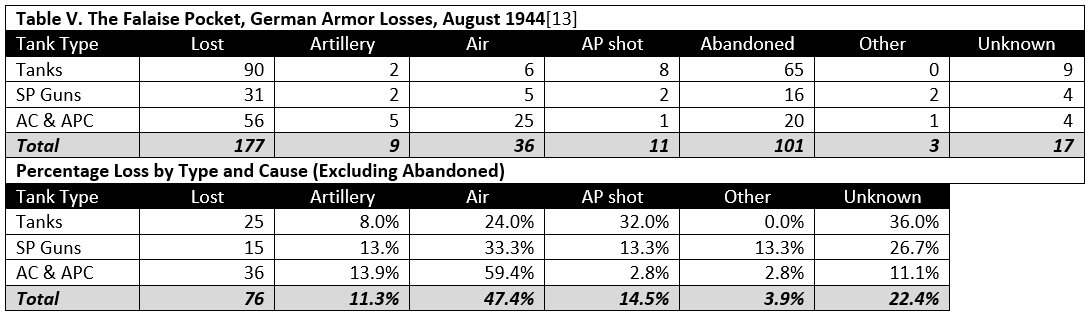
[13] From ORS Report No. 15. The “Pocket” was the area west of the line Falaise-Argentan and east of the line Vassy-Gets-Domfront in Normandy that was the site in August 1944 of the beginning of the German retreat from France. The German forces were being enveloped from the north and south by Allied ground forces and were under constant, heavy air attack.
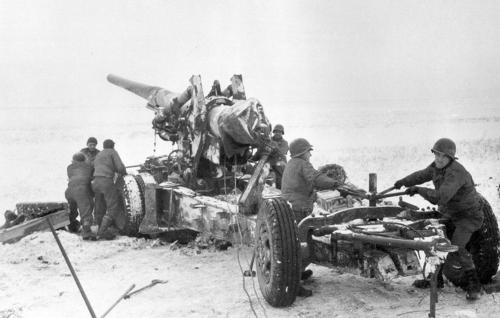
German Army 150mm heavy field howitzer 18 L/29.5 battery. [Panzer DB/Pinterest]
[This series of posts is adapted from the article “Artillery Effectiveness vs. Armor,” by Richard C. Anderson, Jr., originally published in the June 1997 edition of the International TNDM Newsletter.]
Curiously, at Kursk, in the case where the highest percent loss was recorded, the German forces opposing the Soviet 1st Tank Army—mainly the XLVIII Panzer Corps of the Fourth Panzer Army—were supported by proportionately fewer artillery pieces (approximately 56 guns and rocket launchers per division) than the US 1st Infantry Division at Dom Bütgenbach (the equivalent of approximately 106 guns per division)[4]. Nor does it appear that the German rate of fire at Kursk was significantly higher than that of the American artillery at Dom Bütgenbach. On 20 July at Kursk, the 150mm howitzers of the 11th Panzer Division achieved a peak rate of fire of 87.21 rounds per gum. On 21 December at Dom Bütgenbach, the 155mm howitzers of the 955th Field Artillery Battalion achieved a peak rate of fire of 171.17 rounds per gun.[5]
NOTES
[4] The US artillery at Dom Bütgenbach peaked on 21 December 1944 when a total of 210 divisional and corps pieces fired over 10,000 rounds in support of the 1st Division’s 26th Infantry.
[5] Data collected on German rates of fire are fragmentary, but appear to be similar to that of the American Army in World War ll. An article on artillery rates of fire that explores the data in more detail will be forthcoming in a future issue of this newsletter. [NOTE: This article was not completed or published.]
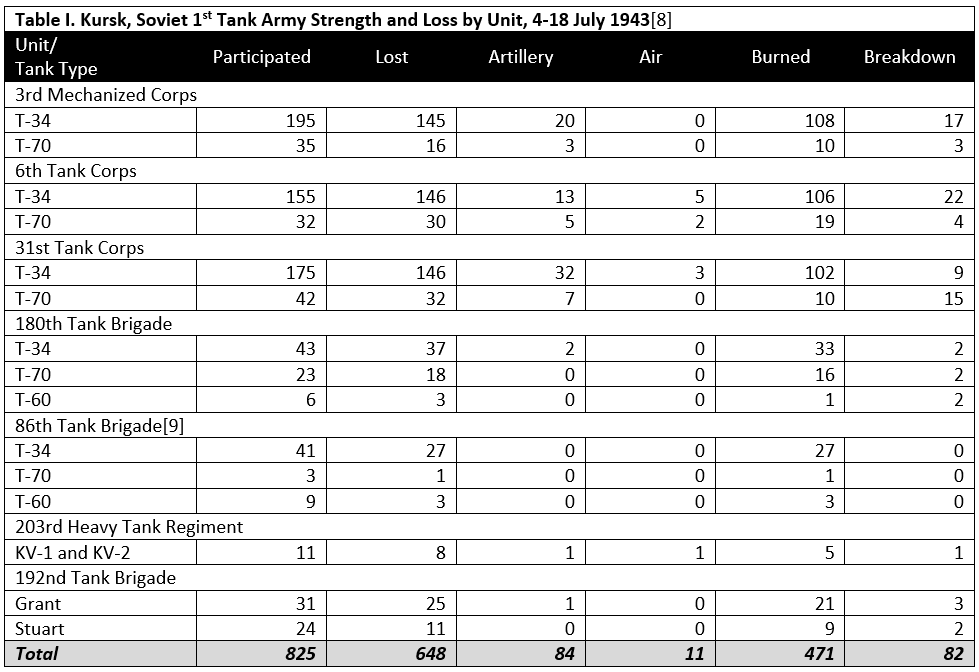
Notes to Table I.
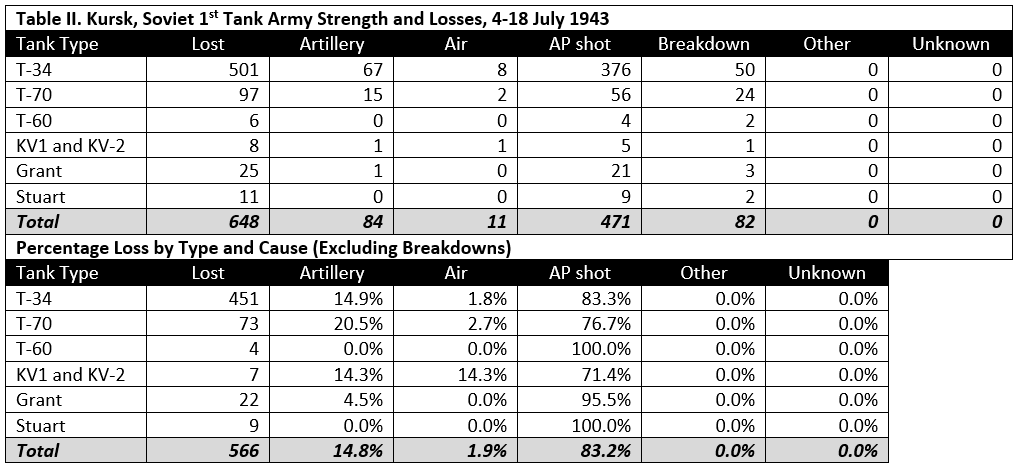
[8] The data were found in reports of the 1st Tank Army (Fond 299, Opis‘ 3070, Delo 226). Obvious math errors in the original document have been corrected (the total lost column did not always agree with the totals by cause). The total participated column evidently reflected the starting strength of the unit, plus replacement vehicles. “Burned'” in Soviet wartime documents usually indicated a total loss, however it appears that in this case “burned” denoted vehicles totally lost due to direct fire antitank weapons. “Breakdown” apparently included both mechanical breakdown and repairable combat damage.
[9] Note that the brigade report (Fond 3304, Opis‘ 1, Delo 24) contradicts the army report. The brigade reported that a total of 28 T-34s were lost (9 to aircraft and 19 to “artillery”) and one T-60 was destroyed by a mine. However, this report was made on 11 July, during the battle, and may not have been as precise as the later report recorded by 1st Tank Army. Furthermore, it is not as clear in the brigade report that “artillery” referred only to indirect fire HE and not simply lo both direct and indirect fire guns.
A U.S. M1 155mm towed artillery piece being set up for firing during the Battle of the Bulge, December 1944.
[This series of posts is adapted from the article “Artillery Effectiveness vs. Armor,” by Richard C. Anderson, Jr., originally published in the June 1997 edition of the International TNDM Newsletter.]
The effectiveness of artillery against exposed personnel and other “soft” targets has long been accepted. Fragments and blast are deadly to those unfortunate enough to not be under cover. What has also long been accepted is the relative—if not total—immunity of armored vehicles when exposed to shell fire. In a recent memorandum, the United States Army Armor School disputed the results of tests of artillery versus tanks by stating, “…the Armor School nonconcurred with the Artillery School regarding the suppressive effects of artillery…the M-1 main battle tank cannot be destroyed by artillery…”
This statement may in fact be true,[1] if the advancement of armored vehicle design has greatly exceeded the advancement of artillery weapon design in the last fifty years. [Original emphasis] However, if the statement is not true, then recent research by TDI[2] into the effectiveness of artillery shell fire versus tanks in World War II may be illuminating.
The TDI search found that an average of 12.8 percent of tank and other armored vehicle losses[3] were due to artillery fire in seven eases in World War II where the cause of loss could be reliably identified. The highest percent loss due to artillery was found to be 14.8 percent in the case of the Soviet 1st Tank Army at Kursk (Table II). The lowest percent loss due to artillery was found to be 5.9 percent in the case of Dom Bütgenbach (Table VIII).
The seven cases are split almost evenly between those that show armor losses to a defender and those that show losses to an attacker. The first four cases (Kursk, Normandy l. Normandy ll, and the “Pocket“) are engagements in which the side for which armor losses were recorded was on the defensive. The last three cases (Ardennes, Krinkelt. and Dom Bütgenbach) are engagements in which the side for which armor losses were recorded was on the offensive.
Four of the seven eases (Normandy I, Normandy ll, the “Pocket,” and Ardennes) represent data collected by operations research personnel utilizing rigid criteria for the identification of the cause of loss. Specific causes of loss were only given when the primary destructive agent could be clearly identified. The other three cases (Kursk, Krinkelt, and Dom Bütgenbach) are based upon combat reports that—of necessity—represent less precise data collection efforts.
However, the similarity in results remains striking. The largest identifiable cause of tank loss found in the data was, predictably, high-velocity armor piercing (AP) antitank rounds. AP rounds were found to be the cause of 68.7 percent of all losses. Artillery was second, responsible for 12.8 percent of all losses. Air attack as a cause was third, accounting for 7.4 percent of the total lost. Unknown causes, which included losses due to hits from multiple weapon types as well as unidentified weapons, inflicted 6.3% of the losses and ranked fourth. Other causes, which included infantry antitank weapons and mines, were responsible for 4.8% of the losses and ranked fifth.
NOTES
[1] The statement may be true, although it has an “unsinkable Titanic,” ring to it. It is much more likely that this statement is a hypothesis, rather than a truism.
[2] As pan of this article a survey of the Research Analysis Corporation’s publications list was made in an attempt to locate data from previous operations research on the subject. A single reference to the study of tank losses was found. Group 1 Alvin D. Coox and L. Van Loan Naisawald, Survey of Allied Tank Casualties in World War II, CONFIDENTIAL ORO Report T-117, 1 March 1951.
[3] The percentage loss by cause excludes vehicles lost due to mechanical breakdown or abandonment. lf these were included, they would account for 29.2 percent of the total lost. However, 271 of the 404 (67.1%) abandoned were lost in just two of the cases. These two cases (Normandy ll and the Falaise Pocket) cover the period in the Normandy Campaign when the Allies broke through the German defenses and began the pursuit across France.
I have taken a look in previous posts at how the historical relationship identified by Trevor Dupuy between weapon lethality, battlefield dispersion, and casualty rates argues against this assumption with regard to personnel attrition and tank loss rates. What about artillery loss rates? Will long-range precision fires make ground-based long-range precision fire platforms themselves more vulnerable? Historical research suggests that trend was already underway before the advent of the new technology.
In 1976, Trevor Dupuy and the Historical Evaluation and Research Organization (HERO; one of TDI’s corporate ancestors) conducted a study sponsored by Sandia National Laboratory titled “Artillery Survivability in Modern War.” (PDF) The study focused on looking at historical artillery loss rates and the causes of those losses. It drew upon quantitative data from the 1973 Arab-Israel War, the Korean War, and the Eastern Front during World War II.
Conclusions
1. In the early wars of the 20th Century, towed artillery pieces were relatively invulnerable, and they were rarely severely damaged or destroyed except by very infrequent direct hits.
2. This relative invulnerability of towed artillery resulted in general lack of attention to the problems of artillery survivability through World War II.
3. The lack of effective hostile counter-artillery resources in the Korean and Vietnam wars contributed to continued lack of attention to the problem of artillery survivability, although increasingly armies (particularly the US Army) were relying on self-propelled artillery pieces.
4. Estimated Israeli loss statistics of the October 1973 War suggest that because of size and characteristics, self-propelled artillery is more vulnerable to modern counter-artillery means than was towed artillery in that and previous wars; this greater historical physical vulnerability of self-propelled weapons is consistent with recent empirical testing by the US Army.
5. The increasing physical vulnerability of modern self-propelled artillery weapons is compounded by other modern combat developments, including:
a. Improved artillery counter-battery techniques and resources; b. Improved accuracy of air-delivered munitions; c..increased lethality of modern artillery ammunition; and d. Increased range of artillery and surface-to-surface missiles suitable for use against artillery.
6. Despite this greater vulnerability of self-propelled weapons, Israeli experience in the October war demonstrated that self-propelled artillery not only provides significant protection to cannoneers but also that its inherent mobility permits continued effective operation under circumstances in which towed artillery crews would be forced to seek cover, and thus be unable to fire their weapons. ‘
7. Paucity of available processed, compiled data on artillery survivability and vulnerability limits analysis and the formulation of reliable artillery loss experience tables or formulae.
8. Tentative analysis of the limited data available for this study indicates the following:
a. In “normal” deployment, percent weapon losses by standard weight classification are in the following proportions:
b. Towed artillery losses to hostile artillery (counterbattery) appear in general to very directly with battle intensity (as measured by percent personnel casualties per day), at a rate somewhat less than half of the percent personnel losses for units of army strength or greater; this is a straight-line relationship, or close to it; the stronger or more effective the hostile artillery is, the steeper the slope of the curve;
c. Towed artillery losses to all hostile anti-artillery means appears in general to vary directly with battle intensity at a rate about two-thirds of the-percent personnel losses for units of army strength or greater; the curve rises slightly more rapidly in high intensity combat than in normal or low-intensity combat; the stronger or more effective the hostile anti-artillery means (primarily air and counter-battery), the steeper the slope of the curve;
d. Self-propelled artillery losses appear to be generally consistent with towed losses, but at rates at least twice as great in comparison to battle intensity.
9. There are available in existing records of US and German forces in World war II, and US forces in the Korean and Vietnam Wars, unit records and reports that will permit the formulation of reliable artillery loss experience tables and formulae for those conflicts; these, with currently available and probably improved, data from the Arab-Israeli wars, will permit the formulation of reliable artillery loss experience tables and formulae for simulations of modern combat under current and foreseeable future conditions.
The study caveated these conclusions with the following observations:
Most of the artillery weapons in World War II were towed weapons. By the time the United States had committed small but significant numbers of self-propelled artillery pieces in Europe, German air and artillery counter-battery retaliatory capabilities had been significantly reduced. In the Korean and Vietnam wars, although most American artillery was self-propelled, the enemy had little counter-artillery capability either in the air or in artillery weapons and counter-battery techniques.
It is evident from vulnerability testing of current Army self-propelled weapons, that these weapons–while offering much more protection to cannoneers and providing tremendous advantages in mobility–are much more vulnerable to hostile action than are towed weapons, and that they are much more subject to mechanical breakdowns involving either the weapons mountings or the propulsion elements. Thus there cannot be a direct relationship between aggregated World War II data, or even aggregated Korean war or October War data, and current or future artillery configurations. On the other hand, the body of data from the October war where artillery was self-propelled is too small and too specialized by environmental and operational circumstances to serve alone as a paradigm of artillery vulnerability.
Despite the intriguing implications of this research, HERO’s proposal for follow on work was not funded. HERO only used easily accessible primary and secondary source data for the study. It noted much more primary source data was likely available but that it would require a significant research effort to compile it. (Research is always the expensive tent-pole in quantitative historical analysis. This seems to be why so little of it ever gets funded.) At the time of the study in 1976, no U.S. Army organization could identify any existing quantitative historical data or analysis on artillery losses, classified or otherwise. A cursory search on the Internet reveals no other such research as well. Like personnel attrition and tank loss rates, it would seem that artillery loss rates would be another worthwhile subject for quantitative analysis as part of the ongoing effort to develop the MDB concept.
A 155mm Paladin howitzer with 1st Battery, 10th Field Artillery, 3rd Brigade Combat Team, Task Force Liberty stands ready for a fire mission at forward operating base Gabe April 16, 2005. [U.S. Department of Defense/DVIDS]
Strategic strike? The Army needs to worry about increasing tubes (more than just 155s) and less on fancy munitions. Quantity is a quality all its own in tactical and operational level fires.
— Schrödinger’s Strategist (@barefootboomer) October 1, 2018
@barefootboomer makes a fair point. It appears that the majority of the U.S. Army’s current efforts to improve its artillery capabilities are aimed at increasing lethality and capability of individual systems, but not actually adding additional guns to the force structure.
Are Army combat units undergunned in the era of multi-domain battle? The Mobile Protected Firepower program is intended to provide additional light tanks high-caliber direct fire guns to the Infantry Brigade Combat Teams. In his recent piece at West Point’s Modern War Institute blog, Captain Brandon Morgan recommended increasing the proportion of U.S. corps rocket artillery to tube artillery systems from roughly 1:4 to something closer to the current Russian Army ratio of 3:4.
Should the Army be adding other additional direct or indirect fires systems to its combat forces? What types and at what levels? Direct or indirect fire? More tubes per battery? More batteries? More battalions?
What do you think?
UPDATE: I got a few responses to my queries. The balance reflected this view:
Quantity has a quality all its own until it’s outranged, then it has none at all. The Army shouldn’t seek range, precision, responsiveness, and capacity in isolation, but holistically.
More is always better when it comes to Indirect fires. We’ve shifted to reliance on Joint fires and reduced our organic capability, in number of tubes and battalions. All our potential peer/near-peer adversaries outrange and out gun us. We need to fix that.
— Schrödinger’s Strategist (@barefootboomer) October 5, 2018
There were not many specific suggestions about changes to the existing forces structure, except for this one:
More mortars of all types (light, medium, heavy) at battalion and below.
Are there any other thoughts or suggestions out there about this, or is the consensus that the Army is already pretty much on the right course toward fixing its fires problems?
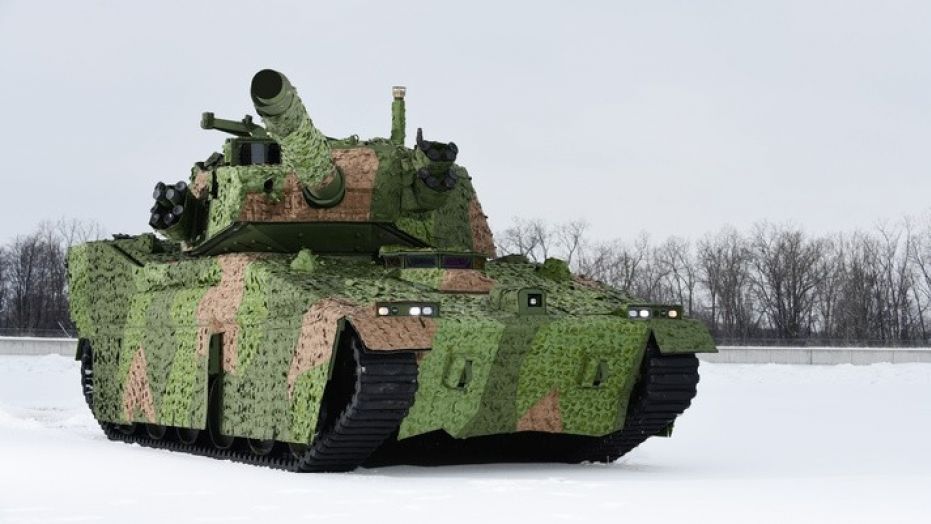
BAE Systems has submitted its proposal to the U.S. Army to build and test the Mobile Protected Firepower (MPF) vehicle [BAE Systems/Fox News]
When we last checked in with the U.S. Army’s Mobile Protected Firepower (MPF) program—an effort to quickly field a new light tank lightweight armored vehicle with a long-range direct fire capability—Request for Proposals (RFPs) were expected by November 2017 and the first samples by April 2018. It now appears the first MPF prototypes will not be delivered before mid-2020 at the earliest.
According to a recent report by Kris Osborn on Warrior Maven, “The service expects to award two Engineering Manufacturing and Development (EMD) deals by 2019 as part of an initial step to building prototypes from multiple vendors, service officials said. Army statement said initial prototypes are expected within 14 months of a contract award.”
Part of the delay appears to stem from uncertainty about requirements. As Osborn reported, “For the Army, the [MPF} effort involves what could be described as a dual-pronged acquisition strategy in that it seeks to leverage currently available or fast emerging technology while engineering the vehicle with an architecture such that it can integrate new weapons and systems as they emerge over time.”
Among the technologies the Army will seek to integrate into the MPF are a lightweight, heavy caliber main gun, lightweight armor composites, active protection systems, a new generation of higher-resolution targeting sensors, greater computer automation, and artificial intelligence.
Osborn noted that
the Army’s Communications Electronics Research, Development and Engineering Center (CERDEC) is already building prototype sensors – with this in mind. In particular, this early work is part of a longer-range effort to inform the Army’s emerging Next-Generation Combat Vehicle (NGCV). The NGCV, expected to become an entire fleet of armored vehicles, is now being explored as something to emerge in the late 2020s or early 2030s.
These evolving requirements are already impacting the Army’s approach to fielding MPF. It originally intended to “do acquisition differently to deliver capability quickly.” MPF program director Major General David Bassett declared in October 2017, “We expect to be delivering prototypes off of that program effort within 15 months of contract award…and getting it in the hands of an evaluation unit six months after that — rapid!“
It is now clear the Army won’t be meeting that schedule after all. Stay tuned.
This series of posts was based on the article “Iranian Casualties in the Iran-Iraq War: A Reappraisal,” by H. W. Beuttel, originally published in the December 1997 edition of the International TNDM Newsletter. Mr Beuttel was a former U.S. Army intelligence officer employed as a military analyst by Boeing Research & Development at the time of original publication. He also authored several updates to this original article, to be posted at a later date, which refined and updated his analysis.
[This post is based on “Iranian Casualties in the Iran-Iraq War: A Reappraisal,” by H. W. Beuttel, originally published in the December 1997 edition of the International TNDM Newsletter.]
If we estimate that at least 5,000,000 troops (about 12% of Iran’s then population) served in the war zone, then the military casualty distribution is not less than the following (Bold indicates the author’s choice from ranges):
Killed in Action/Died of Wounds: 188,000 (156,000-196,000) (17%)
Wounded in Action: 945,000 (754,000-1,110,000) (83%)
Severely Wounded/Disabled: 200,000 (18%) (Note: carve out of total wounded)
Missing in Action: 73,000 (6%) (Note: Carve out of total KIA plus several thousand possible defectors/collaborators)
PoW: 39,000-44,000
Total Military Battle Casualties (KIA + WIA): 1,133,000-1,302,000 (28% theater rate)
Possible Non-Battle Military Deaths: 74,000
Non-Battle Military Injuries: No idea.
With Civilian KIA (11,000) and WIA (34,000) and “chemical” (45,000) Total Hostile Action Casualties: 1,223,000
Possible Military Non-Battle Deaths (74,000):1,297,000
Total Deaths Due to the Imposed War: 273,000 (104% of Pentagon estimate of 262,000)
Of 5,000,000 estimated Iranian combatants (1 million regular army, 2 million Pasdaran, 2 million Baseej)
~ 4% were Killed in Action/Missing in Action
~ 4% were Disabled
~ 13% were Wounded
~ 1% were Non-Battle Deaths
~ 1% were PoWs
Total military losses all known causes ~ 27%
The military battle casualty total percentile (27%) is intermediate between that of World War I (50% ~ British Army) and World War II (13% ~ U.S. Army/U.S. Marine Corps, 22% British Army).[118]
The author acknowledges the highly speculative nature of much of the data and argument presented above. It is offered as a preliminary starting point to further study. As such, the author would appreciate hearing from anyone with additional data on this subject. In particular he would invite the Government of the Islamic Republic of Iran to provide any information that would corroborate, correct or expand on the information presented in this article.
U.S.S. Racine, serving as a target ship for a sinking exercise on 12 July 2018. [YouTube Screencap/The Drive]
The U.S. Navy has uploaded video of a recent sinking exercise (SINKEX) conducted during the 2018 Rim Of The Pacific (RIMPAC) exercises, hosted bi-annually by the U.S. Pacific Fleet based in Honolulu, Hawaii. As detailed by Tyler Rogoway in The Drive, the target of the SINKEX on 12 July 2018 was the U.S.S. Racine, a Newport class Landing Ship-Tank amphibious ship decommissioned 25 years ago.
As dramatic as the images are, the interesting thing about this demonstration was that it included a variety of land-based weapons firing across domains to strike a naval target. The U.S. Army successfully fired a version of the Naval Strike Missile that it is interested in acquiring, as well as a half-dozen High-Mobility Artillery Rocket System [HIMARS] rounds.Japanese troops fired four Type 12 land-based anti-ship missiles at the Racine as well. For good measure, an Australian P-8 Poseidon also hit the target with an air-launched AGM-84 Harpoon.
The coup de gras was provided by a Mk-48 torpedo launched from the Los Angeles class nuclear fast attack submarine USS Olympia, which broke the Racine‘s back and finally sank it an hour later.
Between 2001 and 2004, TDI undertook a series of studies on the effects of urban combat in cities for the U.S. Army Center for Army Analysis (CAA). These studies examined a total of 304 cases of urban combat at the divisional and battalion level that occurred between 1942 and 2003, as well as 319 cases of concurrent non-urban combat for comparison.
The primary findings of Phases I-III of the study were:
Urban terrain had no significantly measurable influence on the outcome of battle.
Attacker casualties in the urban engagements were less than in the non-urban engagements and the casualty exchange ratio favored the attacker as well.
One of the primary effects of urban terrain is that it slowed opposed advance rates. The average advance rate in urban combat was one-half to one-third that of non-urban combat.
There is little evidence that combat operations in urban terrain resulted in a higher linear density of troops.
Armor losses in urban terrain were the same as, or lower than armor losses in non-urban terrain. In some cases it appears that armor losses were significantly lower in urban than non-urban terrain.
Urban terrain did not significantly influence the force ratio required to achieve success or effectively conduct combat operations.
Overall, it appears that urban terrain was no more stressful a combat environment during actual combat operations than was non-urban terrain.
Overall, the expenditure of ammunition in urban operations was not greater than that in non-urban operations. There is no evidence that the expenditure of other consumable items (rations; water; or fuel, oil, or lubricants) was significantly different in urban as opposed to non-urban combat.
Since it was found that advance rates in urban combat were significantly reduced, then it is obvious that these two effects (advance rates and time) were interrelated. It does appear that the primary impact of urban combat was to slow the tempo of operations.
In order to broaden and deepen understanding of the effects of urban combat, TDI proposed several follow-up studies. To date, none of these have been funded:
Conduct a detailed study of the Battle of Stalingrad. Stalingrad may also represent one of the most intense examples of urban combat, so may provide some clues to the causes of the urban outliers.
Conduct a detailed study of battalion/brigade-level urban combat. This would begin with an analysis of battalion-level actions from the first two phases of this study (European Theater of Operations and Eastern Front), added to the battalion-level actions completed in this third phase of the study. Additional battalion-level engagements would be added as needed.
Conduct a detailed study of the outliers in an attempt to discover the causes for the atypical nature of these urban battles.
Conduct a detailed study of urban warfare in an unconventional warfare setting.
Details of the Phase I-III study reports and conclusions can be found below:

 NOTES
NOTES


 This series of posts was based on the article “Iranian Casualties in the Iran-Iraq War: A Reappraisal,” by H. W. Beuttel, originally published in the
