Category Insurgency & Counterinsurgency

New York Military Affairs Symposium

There is an 37-year old organization called the New York Military Affair Symposium that regular hosts speakers. Their website and speaker schedule is here: http://www.nymas.org/

This Friday (Jan 18), Max Boot will be presenting about his book The Road Not Taken: Edward Lansdale and the American Tragedy in Vietnam.

I will be presenting on 26 April based upon my book War by Numbers: Understanding Conventional Combat.

The presentations are at the Soldier Sailors Club, 283 Lexington Avenue, New York City at 7 PM.

A Force Ratio Model Applied to Afghanistan

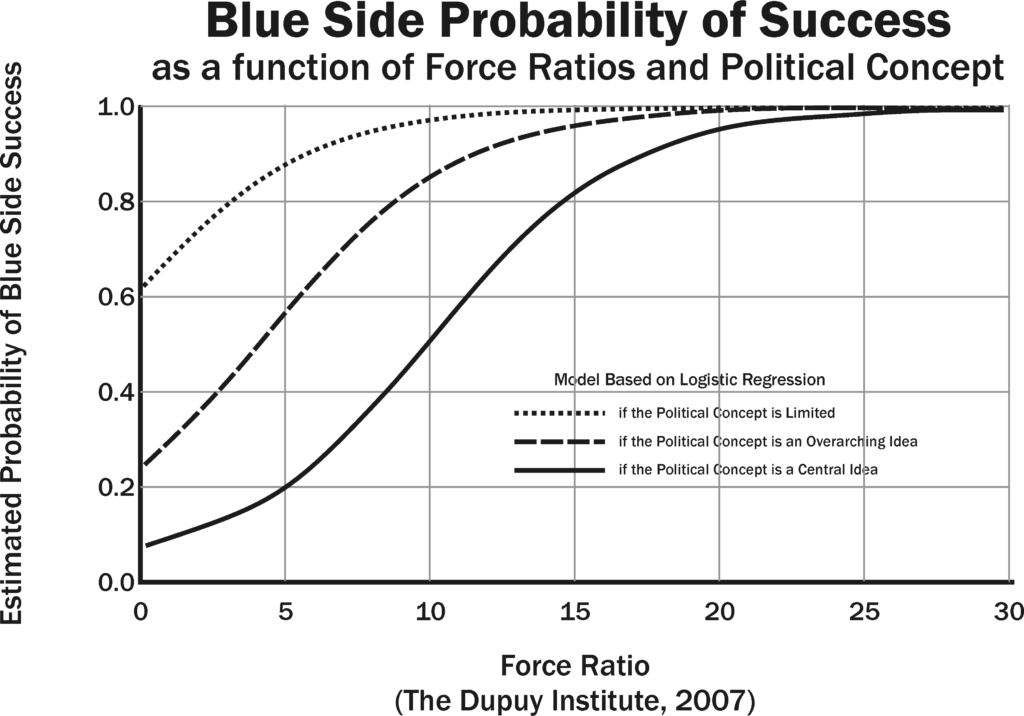
As many people are aware, the one logit regression that we had confidence in from the 83 insurgency cases we tested was a force ratio versus outcome model. This is discussed in the following blog post and in Chapter 6 of my book America’s Modern Wars.

We probably need to keep talking about Afghanistan

The key was that we ended up with two very different curves: one if the insurgency was based upon a central idea (like nationalism) and a lesser curve if the insurgency was based upon limited political concept (a regional or factional insurgency). Now, we never really determined which applied to Afghanistan, because we actually never had a contract to do any work or analysis on Afghanistan. I am hesitant to reach conclusions without some research.

But let us look at the force ratios there now. I estimate that the insurgency has at least 60,000 full-time and part-time insurgents. There may have more than that. But, working backwards from the incident count of 20,000+ a year, and comparing those incident counts with insurgent strengths in past insurgencies, leads me to conclude that it is at least 60,000 insurgents. This process is discussed in depth in Chapter 11 of my book. Let’s work with that figure for a moment.

The counterinsurgent forces consist of supposedly almost 400,000 people. Except…in our model we only counted army and air force, and only counted police only if it was clear that counterinsurgent operations was their primary duty. Therefore our model did not count most police.

Parsing out the data in Wikipedia shows that the Afghan Army and Air Force total around 195,000 active in 2014. The Wikipedia source was this article: https://www.pajhwok.com/en/2015/03/10/mohammadi-asks-troops-stand-united. I have no idea how correct this number is. It might be a little optimistic (see my comments about auditing the police force rolls).

The Afghan National Police (ANP) have 157,000 members in September 2013 (again Wikipedia). I note that the UNAMA report in December 2018 on the audit reduced the ANP payroll from 147,875 to 106,189. But, this is a national police force. It includes uniformed police, border police, a criminal investigation division of 4,148 investigators, etc. Let’s say for convenience that half of them are doing traditional police work and half are doing counterinsurgent work. I have no idea if this is a good or reasonable split. So let’s say 53,000 ANP police involved in the counterinsurgency effort. The Afghan Local Police (ALP) are 19,600 as of February 2013. As they are clearly part of the counterinsurgency effort, I will count them.

The 18,000 ISAF are mostly training, so I am not sure how they should be counted, but we will count them. No sure if we should count the 20,000 contractors, as quite simply, there were not a lot of contractors in our previous 83 cases. The use of private contractors to fight insurgencies is a relatively new approach. For now I will not count them.

So, let’s count counterinsurgent strength at 195,000 + 53,000 ANP + 19,600 ALP + 18,000 ISAF. This gives a counterinsurgent strength of 285,600 compared to an insurgent strength of 60,000. This is a 4.76-to-1 force ratio. This is a very precise number created from some very fuzzy data.

Now, if I look at the curve for an insurgency based upon an limited political concept, and I see that an 4.76-to-1 force ratio means that the counterinsurgent won roughly 86% of the time (see page 65 of my book). This is favorable. But right now, it doesn’t really look like we have been winning in Afghanistan over the last eight years.

On the other hand, if I code this as an insurgency based upon a central idea I see that a 4.76-to-1 force ratio results in the counterinsurgent winning 19% of the time. This is much worse.

So…I have yet to make a determination as to which curve should apply in this case. Perhaps neither do, as Afghanistan is a unique and complex case. Properly analyzing this would require a level-of-effort beyond what I am willing to invest. Keep in mind that our Iraq estimate was funded in 2004 (see Chapter 1 of my book). It was also ignored.

Force Draw Downs

I do discuss force draw downs in my book America’s Modern Wars: Understanding Iraq, Afghanistan and Vietnam. It is in Chapter 19 called “Withdrawal and War Termination” (pages 237-242). To quote from parts of that chapter:

The missing piece of analysis in both our work and in that of many of the various counterinsurgent theorists is how does one terminate or end these wars, and what is the best way to do so? This is not an insignificant point. We did propose doing exactly such a study in several of our reports, briefings and conversations, but no one expressed a strong interest in examining war termination…..

In our initial look at 28 cases, we found only three cases where the counterinsurgents were able to reduce or choose to significantly reduce force strength during the course of an insurgency. These are Malaya, Northern Ireland and Vietnam. With our expanded database of 83 cases, these are still the only three cases of such.

Let us look at each in turn. The case of Malaya is illustrated below:
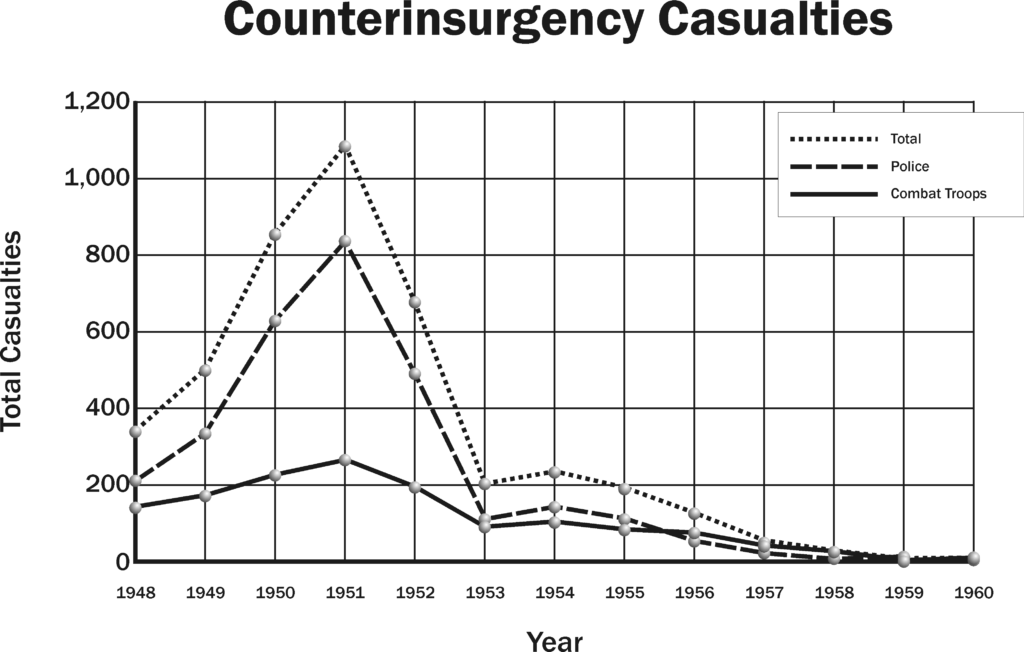
The most intense phase of the insurgency was from 1958 to 1952. Peak counterinsurgent deaths were 488 in 1951, with 272 in 1952 and only 95 in 1953. Over the course of 1959 and 1960, there were only three deaths.

When one looks at counterinsurgent force strength over that period, one notes a large decline in strength, but in fact, it is a decline in militia strength. Commonwealth troop strength peaked at 29,656 in 1956, consisting of UK troops, Gurkhas and Australians. It declined to 16,939 in 1960. Basically, even with no combat occurring for two years, the troop strength of the intervening forces (“UK Combat Troops” on the first graph) was reduced by one half and only during last couple of years. The decline is Malayan strength is primarily due to police force declining after 1953 and the “Special Constabulary” declining after 1952 and eventually being reduced to zero. There was also a Malayan Home Guard that was briefly up to 300,000 people, but most of them were never armed and were eventually disbanded.

This is the best case we have of a force draw down, and it was only done to any significance late in the war, where the insurgency was pretty much reduced to 400 or so fighters sitting across the narrow border with Thailand and scattered remnants being policed inside of Malaya.

Northern Ireland is another case in which the degree of activity was very intense early on. For example:
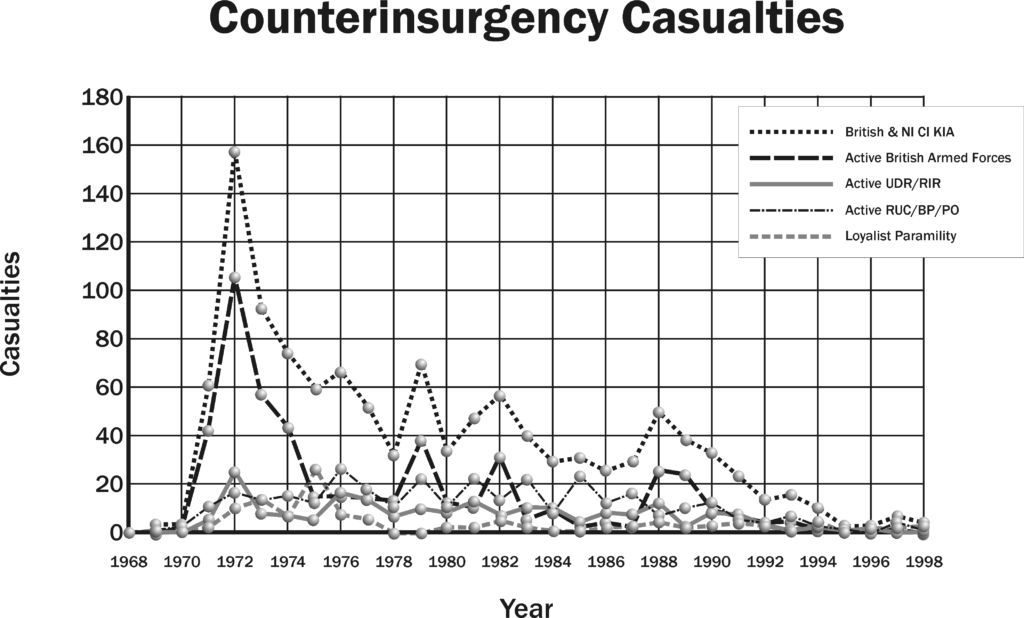
On the other hand, force strength does not draw down much.
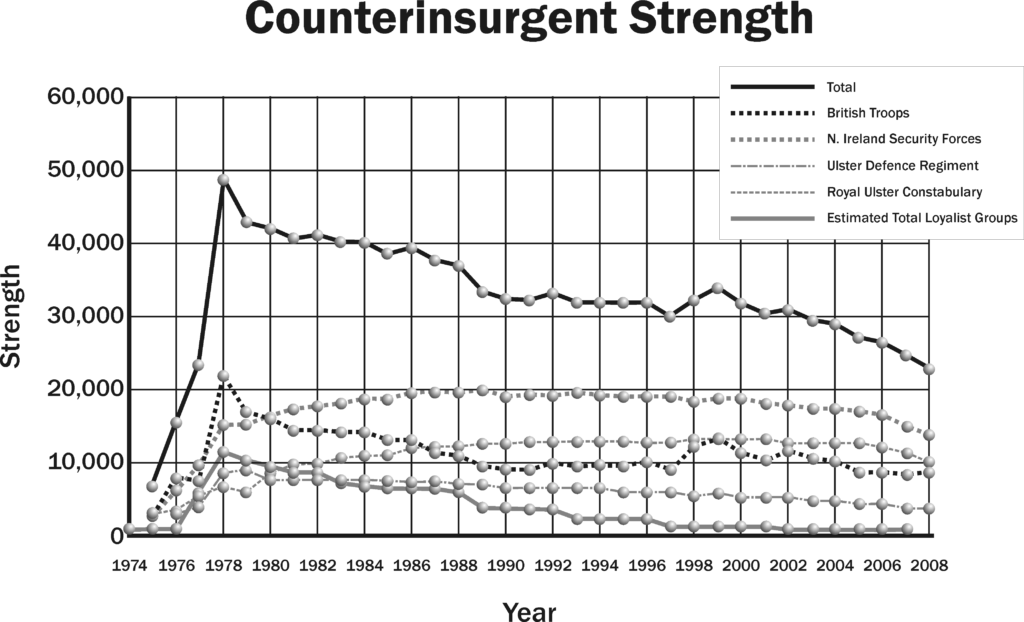
In this case the peak counterinsurgent strength was 48,341 in 1972, and the counterinsurgent strength is still 22,691 in 2002. These two cases show the limitation of a draw down.

In the case of Vietnam, there was a four-year-long massive build up, and then four years of equally hasty withdrawal. This is clearly not the way to conduct a war and is discussed in more depth in Chapter Twenty-Two. Vietnam is clearly is not a good example of a successful force drawn down.

Besides these three cases, we do not have any other good examples of a force draw down except that which occurs in the last year of the war, and agreements are reached and the war ended. In general, this strongly indicates that draw downs are not very practical until you have resolved the war.

A basic examination needs to be done concerning how insurgencies end, how withdrawals are conducted, and what the impact of various approaches towards war termination is. This also needs to address long-term outcome, that is, what happened following war termination.

We have nothing particularly unique and insightful to offer in this regard. Therefore, we will avoid the tendency to pontificate generally and leave this discussion for later. Still, we are currently observing with Afghanistan and Iraq two wars where the intervening power is withdrawing or has withdrawn. These are both interesting cases of war termination strategies, although it we do not yet know the outcome in either case.

The bolding was added for this post.
Peacekeeping Institute?

It appears that the Army is looking at shuttering the rather small Peacekeeping and Stability Operations Institute: https://www.yahoo.com/news/army-push-end-peacekeeping-institute-sparks-wider-debate-100019830.html

Now, I have never had any intersection with this organization, so I have no idea of how effective, productive or useful it is. I gather they are looking at renaming it (because peacekeeping is a bad word?) and cutting it more than 2/3rds. This is minimal savings.

Now, my experience is that DOD, being command driven and mission oriented, tends to forget about missions that are not currently getting “command attention.” I discussed this problem in some depth in my book America’s Modern Wars. We have seen parts of DOD go from ignoring the study of insurgencies before 2001 to recently not being able to properly model conventional combat for training exercises. As outrageous as this last sentence sounds, I can back it up with real world examples, except I really don’t want to embarrass anyone. But let us say, that we have seen multiple examples over the years of DOD being overly focused on the mission de jure at the expense of its other missions. DOD missions range from conventional wars, to counterinsurgencies, to irregular operations, to peacekeeping, nation building, and even border protection. These missions come and go, but they always show back up. It has been the case for over 200 years. The DOD always needs to be ready to conduct all missions. The failures in Iraq, which cost American lives, drives home that point in blood.

U.S. Military Deaths from 2006

Interesting chart from the Congressional Research Service (CRS). Source: https://fas.org/sgp/crs/natsec/IF10899.pdf

OCO Deaths = Overseas Contingency Operations — meaning mostly Iraq and Afghanistan.

Non-OCO Deaths = means mostly accident, self-inflicted wounds, and illness. There are the almost 1,000 deaths a year that are going to occur in the U.S. military even when at peace. They listed accidents as 4,599 cases, self-inflicted deaths as 3,258 cases and illness/injury as 2,650 cases. Note that OCO operations also include accidents (471), self-inflicted wounded (282) and illness and injury (119). There are also 458 homicides in non-OCO and 41 homicides among the OCO deaths (along with 2,698 killed in action and 874 died of wounds).

It would have been more interesting if they started those charts in 2000 or 2001.

A few other interesting charts from that link:

The chart below is Iraq war deaths from 2006. Total Iraq war deaths since 2003 were over 4,500.

And these are Afghanistan war deaths from 2006. Total Afghanistan war deaths since 2001 add up to over 2,300.

These are, of course, only U.S. DOD deaths. There are also U.S. contractors, NATO allies, other U.S. allies, Iraq and Afghanstani forces, militia, civilians, insurgents, etc. It starts adding up.

Measuring the Effects of Combat in Cities, Phase III – part 3

Am 25.10.1941 konnte die faschistische deutsche Wehrmacht mit überlegenen Kräften Charkow, die Hauptstadt der Ukraine erobern.
UBz.: Panzer und Infanterie bei Strassenkämpfen in der Stadt

Description: Street fighting at Kharkov on 25 October 1941: infantry advancing covered by a StuG III assault gun and Sd.Kfz. 250 halftrack(Bundesarchiv Bild 183-L20582)

So, in our three phases of urban warfare study, taking place over three years, how much urban warfare did we examine? Well by count of engagements, we looked at 304 urban cases, division-level and battalion-level. Mostly what this means is one division or battalion-level engagement per day. Still, this is not insignificant.

We did assemble back in 2003 a listing of all the significant urban engagements we had identified since 1904. There are not all that common. We counted 117 of them in conventional combat between 1904 and 2003 (they are listed on pages 3-7 of the Phase III report). Of those 117, we had examined 22 of them (18.8 percent). We considered that 38 or so of them were major urban battles (division-level or larger). Of those, we examined 17 (44.7%). Only three of the remaining 21 major urban battles are known to have good data for both sides. The biggest remaining untapped source of data was the Battle of Stalingrad, which could yield over a hundred division-level engagements. This led us to make four points (page 10-11 of the report):

We suggest that there remain a number of ways in which we can broaden and deepen or knowledge of the effects of urban warfare.

  1. Conduct a detailed study of the Battle of Stalingrad. Stalingrad may also represent one of the most intense examples of urban combat, so may provide some clues to the causes of the urban outliers.
  2. Conduct a detailed study of battalion/brigade-level urban combat. This would begin with an analysis of battalion-level actions from the first two phases of this study (European Theater of Operations and Eastern Front), added to the battalion-level actions completed in this third phase of the study. Additional battalion-level engagements would be added as needed.
  3. Conduct a detailed study of the outliers in an attempt to discover the causes for the atypical nature of these urban battles.
  4. Conduct a detailed study of urban warfare in an unconventional warfare setting.

Anyhow, it was clear that our next step was Stalingrad. You will also note that in 2003/2004 we were also suggesting we study urban warfare in an unconventional warfare setting. This suggestion seemed to get no attention.


Measuring the Effects of Combat in Cities, Phase III – part 2

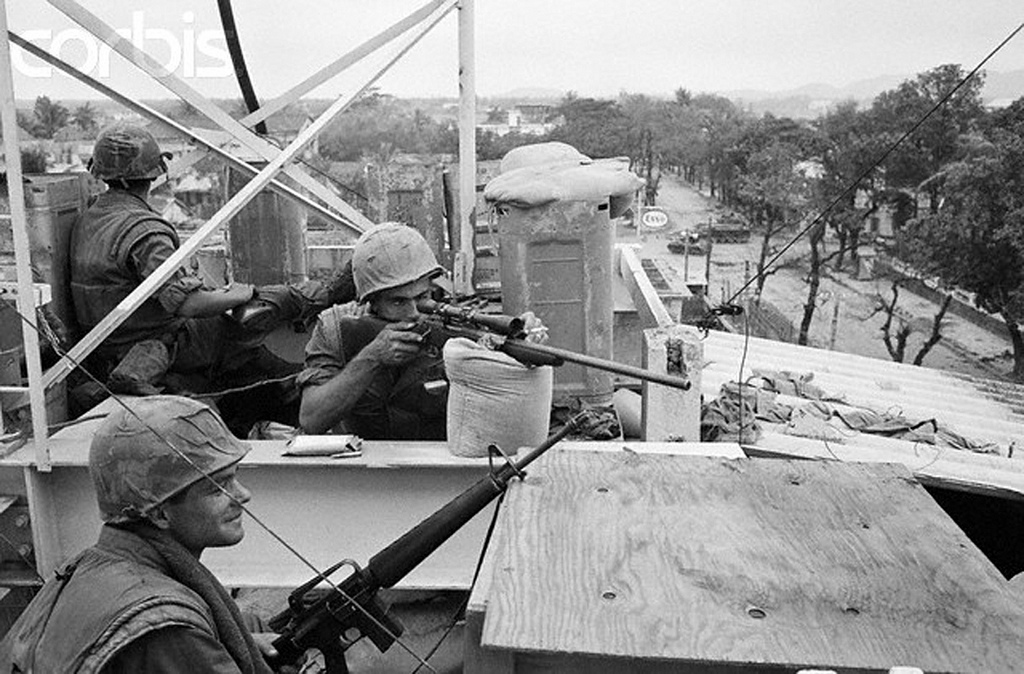
U.S. Army troops in Hue, South Vietnam monitor the streets below during the Tet Offensive, 1968. [Bettmann/CORBIS]

Another part of our Phase III effort was to look at post-World War II cases. This is, by its nature, invariably one-sided data. Maybe at some point we will get the Chinese, North Koreans, Vietnamese, Syrians, etc. to open up their archives to us researchers, but, except for possibly Vietnam, I don’t think that is going to happen any time in the near future. So, we ended up building our post-World War II cases primarily from U.S. data.

We added 10 engagements from the Inchon/Seoul operation in 1950. For Vietnam we added  65 division-level urban engagements from the Tet Offensive in 1968 and 57 division-level non-urban engagements. We also added 56 battalion-level urban engagements from the Tet Offensive (all in Hue). We had 14 division-level urban engagements and 65 division-level non-urban engagements from various contingencies and conventional operations from 1944 to 2003. This included ELAS Insurgency, Arab-Isreali Wars, Panama, Mogadishu, the 1991 Gulf War and Baghdad in 2003. We also added 9 battalion-level urban cases, mostly from Beirut 1982-1984.

To add it all up this was:

                                                 Urban       Non-urban

Phase I (ETO)                              46              91

Phase II (Kharkov/Kursk)             51              65

Phase III (Manila/PTO)                53              41

Post-WWII – Division-level           89            123

Post-WWII – Battalion-level          65               0

                                                   ——-         ——

Total cases                                 304           319

This is a lot of cases for comparisons.

Just to show how they match up (from page 28 of the report):

Attackers in Division-Level Engagements:

Urban

PTO Kor Tet Oth ETO EF (Ger Atk) EF (Sov Atk)
Avg Str/day 12,099 28,304 6,294 10,903 34,601 17,080 17,001
Avg Cas 78 30 94 254 178 86 371
Avg Cas/day 78 30 39 59 169 86 371
Avg % Loss/day 0.63 0.71 0.78 0.56 0.50 0.49 1.95
Wgt % Loss/day 0.65 0.71 0.62 0.54 0.49 0.50 2.18


Non-urban

PTO Tet Oth ETO EF (Ger Atk) EF (Sov Atk)
Avg Str/day 17,445 13,232 18,991 21,060 27,083 27,044
Avg Cas 663 44 377 469 276 761
Avg Cas/day 221 22 191 237 206 653
Avg % Loss/day 0.83 0.19 1.56 1.09 1.00 2.39
Wgt % Loss/day 1.27 0.17 1.01 1.13 0.76 2.41

I will pick up more on the Phase III effort in a subsequent posting (a part 3 to this series). These charts are also on page 238 of War by Numbers.


P.S. The blog the image was taken from (it is a collection of pictures taken from the fighting in Hue): https://vulep-photo.blogspot.com/2013/01/hue-1968-tet-mau-than_3410.html


Afghan Migration

Fascinating article from a British-based analyst, Dermot Rooney: http://www.wapentakes.com/wp-content/uploads/2016/11/2016-Newsbrief_May_Rooney.pdf

A few highlights:

  1. “…war alone cannot account for the vast number of Afghan migrants or the great distance they are travelling.”
    1. “Globally, up until 1960, the ratio of refuges to fatalities in conflict zones was below 5:1.”
    2. “…in 2015 there was an almost unprecedented 50 as asylum applicants for every civilian killed.”
    3. “Whereas in 1979 over 90% of the Afghan refugees travelled less than 500 km and cross one border, now more than 90% travel over 5,000 km to seek asylum…”
  2. “There are now 1.3 million internally displaced Afghans, with the total increasing by 400,000 a year.”
  3. “The pull of economic opportunity plays a large part in the decision to migrate.”
  4. “In 2015, the population of Afghanistan was 32 million.”
    1. “…it is nonetheless obliged to import enough wheat to feed 10 million people…”
  5. “…Afghanistan’s population will pass 40 million in ten years.”
    1. “the natural growth rate of 2.3% a year added 700,000 to the Afghan population in 2015.”
    2. “Unless there is a dramatic improvement in the economy and security in that time, 16 million will depend on food aid…”


Why it is difficult to withdraw from (Syria, Iraq, Afghanistan….)

Leaving an unstable country in some regions is an invite to further international problems. This was the case with Afghanistan in the 1990s, which resulted in Al-Qaeda being hosted there. This was the case with Somalia, which not only hosted elements of Al-Qaeda, but also conducted rampant piracy. This was the case with Iraq/Syria, which gave the Islamic State a huge opening and resulted in them seizing the second largest city in Iraq. It seems a bad idea to ignore these areas, even though there is a cost to not ignoring them.

The cost of not ignoring them is one must maintain a presence of something like 2,000 to 20,000 or more support troops, Air Force personnel, trainers, advisors, special operations forces, etc. And they must be maintained for a while. It will certainly result in the loss of a few American lives, perhaps even dozens. It will certainly cost hundreds of millions to pay for deployment, security operations, develop the local forces, and to re-build and re-vitalize these areas. In fact, the bill usually ends up costing billions. Furthermore, these operations go on for a decade or two or more. The annual cost times 20 years gets considerable. We have never done any studies of “security operations” or “advisory missions.” The focus of our work was on insurgencies, but we have no doubt that these things tend to drag on a while before completion.

The cost of ignoring these countries may be nothing. If there is no international terror threat and no direct threat to our interests, then there may not be a major cost to withdrawing. On the other hand, the cost of ignoring Somalia was a pirate campaign that started around 2005 and where they attacked at least 232 ships. They captured over 3,500 seafarers. At least 62 of them died. The cost of ignoring Afghanistan in the 1990s? Well, was it 9-11? Would 9-11 have occurred anyway if Al-Qaeda was not free to reside, organize, recruit and train in Afghanistan? I don’t know for sure…..but I think it was certainly an enabling factor.

I have never seen a study that analyzes/estimates the cost of these interventions (although some such studies may exist).  Conversely, I have never seen a study that analyzes/estimates the cost of not doing these interventions (and I kind of doubt that such a study exists).

Hard to do analyze the cost of the trade-off if we really don’t know the cost.