Much has changed since James Quinliven kicked off discussion over manpower and counterinsurgency. One of the most significant differences is the availability now of useful collections of historical data for analysis.
Detailed below are the lineages for the data sets used in six of the seven analyses I have discussed. The cases used by Libicki and Friedman were drawn from databases created by several academic organizations and work by James Fearon and Daivd Laitin [1] and, Jason Lyall and Isaiah Wilson III [2]. Both Libicki and Friedman contributed additional research of their own to complete their datasets.
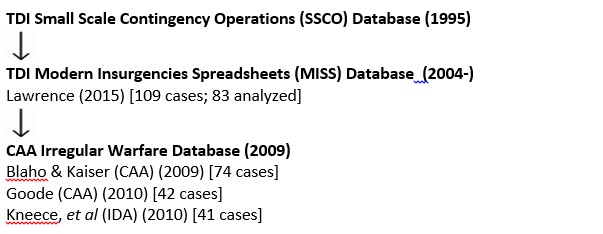
The data used by Lawrence, CAA, and IDA was all researched and compiled by The Dupuy Institute (TDI). Both TDI’s Modern Insurgencies Spreadsheets (MISS) Database and CAA’s Irregular Warfare Database contain data on at least 75 variables for each historical case.
The details of the dataset created and used by Hossack at Dstl have not been addressed in public forums, but it is likely to be similar.
Future directions for research
Given the general consensus of all of the studies that counterinsurgent manpower levels do correlate with outcome, the apparent disagreement over force ratio and troop density measures may not be as relevant as previously thought. More data collection and testing should be done to verify the validity of the postulated relationship between counterinsurgent force levels and the local population within an active area of operation.
Though there was consensus on the advantage of counterinsurgent manpower, there was no agreement as to its overall importance. More analysis is needed to examine just how decisive manpower advantages may be. Hossack and Goode suggested that a counterinsurgent manpower advantage may be important largely to prevent insurgent military success. Hossack and Friedman suggested that there may be points of diminishing manpower returns and Lawrence indicated that a force ratio advantage was decisive only against insurgencies with broad popular support. Given the potential difficulties in generating significant additional counterinsurgent manpower, it may be applicable and useful only under particular circumstances.
Due to the limitations of the available data, all of the studies based their analysis on data averages. The figures used for insurgent and counterinsurgent force sizes were usually selected from the highest annual totals across years or decades. All of the studies indicated the need to obtain more detailed data on individual cases to allow for more discreet and dynamic analysis to look for undetected links and patterns. Lawrence in particular called for examination of conditions before insurgencies begin and when they are just getting underway.
Friedman noted the value of quantitative analysis in helping to drive forward discussion and debate on defense and security topics. Research and analysis on insurgency and counterinsurgency was left to languish during the Vietnam War, only to be exhumed under the dire circumstances of the U.S. war in Iraq. It would be deeply unfortunate if promising new lines of inquiry were abandoned again.
Hossack [Dstl] (2007), Blaho & Kaiser [CAA] (2009), and Lawrence [TDI] (2015) found no statistically meaningful relationship between troop density and insurgency outcome.
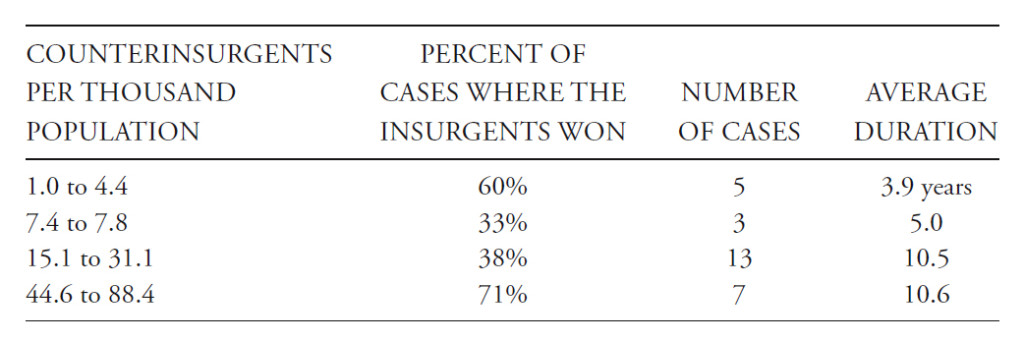
Just to clarify, I went only far enough to prepare the following table:
This was work I did back in 2004 using the original 28 cases we developed the Iraq Casualty Estimate from. At that time, Quinliven had only used 13 cases to establish his theme, and none had a density above 23.7. We did not rigorously test and analyze this theme, as it was clear from even a quick look that there was little value to it “…as a relationship that can be used analytically for predictive purposes for an insurgency.” The original purpose of Quinliven’s estimate was to look at “stability operations.” This is discussed in pages 70-71 of my book.
To summarize the findings of the seven large-N case studies of the relationship between manpower and counterinsurgency:
Troop Density (troops per inhabitant)
Goode [CAA] (2009) asserted a statistically meaningful relationship between troop density and insurgency outcome.
Hossack [Dstl] (2007), Blaho & Kaiser [CAA] (2009), and Lawrence [TDI] (2015) found no statistically meaningful relationship between troop density and insurgency outcome.
Kneece, et al [IDA] (2010) and Friedman (2011) found a statistically meaningful relationship between troop density in defined areas of operation and insurgency outcome
Friedman (2011) asserted that there was no discernible statistical support for a benchmark troop density level (i.e. 20 troops/1,000 inhabitants).
Force Ratios (counterinsurgents per insurgent)
Hossack [Dstl] (2007), Libicki [RAND] (2008), Blaho & Kaiser [CAA] (2009), and Lawrence [TDI] (2015) asserted a statistically meaningful relationship between force ratios and insurgency outcome.
Goode [CAA] (2009) and Kneece, et al [IDA] (2010) rejected the validity of a relationship between force ratios and outcome due to an inherent unreliability of relevant data.
Friedman (2011) identified a statistically meaningful relationship between force ratios and outcome when controls were applied to the data.
Lawrence [TDI] (2015) found a strong relationship between force ratios, the nature of an insurgency, and insurgency outcome.
Manpower and insurgency
At first glance, it would appear that despite the recent availability of historical data on insurgencies, the debate over the relationship of force ratios and troop density to outcomes remains an open one. Amidst the disagreement, however, one salient conclusion stands out: all of the studies generally agree that there is a positive correlation between counterinsurgent force strength and the outcome of an insurgency. The collective analysis suggests that the commitment of larger numbers of counterinsurgent forces has historically correlated with more successful counterinsurgency campaign outcomes. What remains open to dispute is just how significant this finding is, or whether it matters at all.
Troop density (countrywide) vs. troop density (AO)
Another broad conclusion from these studies is that there appears to be no statistical support for the original Quinlivan troop density construct as measured by the number of counterinsurgents per inhabitant. The only study to support this without qualification was Goode [CAA] (2009). The extensive data collection and testing conducted by Friedman (2011) also cast serious doubt on the validity of the notion of force level benchmarks.
However, Kneece, et al [IDA] (2010) and Friedman (2011) both made a compelling case for the usefulness of troop density as measured by the number of counterinsurgents per inhabitant within a defined area of counterinsurgent operations. When measured in this manner, a clear correlation was found to exist between troop density and insurgency outcome. This notion has considerable qualitative appeal. Insurgencies generally do not occur uniformly throughout an entire country. Insurgent activity usually takes place within a specific region or area. Consequently, counterinsurgent forces are not deployed uniformly throughout a country, but rather to areas with the highest insurgent activity. This revised troop density construct definitely merits further study.
Force ratios and data reliability
One argument raised against the applicability of using force ratios is that data relating to insurgents is based on either counterinsurgent estimates or imprecise counts, or unreliable information from insurgent sources. This uncertainty therefore simply renders the data invalid for analysis. This claim seems overstated. While it is relatively certain that there are inaccuracies in such data, it is implausible to think that it is all hopelessly flawed or fictitious. In nearly all the datasets, the data are collected as reported. This variety in sourcing would seem to auger against systematic bias, which would truly render the data invalid.
Data collected in an unsystematic way is definitely going to be fuzzy or noisy, but again, this does not invalidate its usefulness. As my colleague Chris Lawrence contends, even if the insurgent force strength data is inaccurate, it is not incorrect by an order of magnitude. The range of error is probably more like +/- 50%. Random changes in insurgent force size by +/- 50% still produce similar analytical results after regression analysis. Insurgent force size data may be noisy, but that in itself is an insufficient reason alone to discount it.
Sensitivity of results to coding choices/definitions
Given the general agreement that there is a relationship between manpower and outcome, it seems odd that there is still deep disagreement over specific aspects of this. One possible explanation for this is the wide variation in definitions of terms and variables. It should be noted that despite the very large body of research and scholarship on insurgency and counterinsurgency, there is very little consensus on how to define such conflicts. Both Kneece, et al [IDA] (2010) and Friedman (2011) pointed out that analytical outcomes are sensitive to how the variables are defined. Kneece, et al [IDA] (2010) did a quick check on how winning or losing was scored among 36 of the same cases in five different data sets and found agreement on only 11.
Some of the variations in the conclusions may be due to case selection. There are no universally accepted definitions for what insurgency or counterinsurgency are, or any meaningful distinction between these types of conflicts and less violent variants such as peacekeeping operations, interventions, or stabilization operations. The authors of each of the studies established clear but differing criteria for case selection, resulting in analyses of similar datasets with some overlap in common cases.
My next and final post in this series will address the origins of the various datasets and potential future directions for research on this subject.
Even as James Quinliven’s assertion of the importance of force density became axiomatic during the dark days of the U.S. war in Iraq, other researchers began to take a closer look at the role force strength played in past insurgencies. What quickly became evident was that the lack of available empirical data to analyze limited the validity of the analysis. Quinliven’s conclusions had been based on just 13 cases. The persuasiveness of conclusions of similar studies were also limited by small sample sizes.[1] Larger data sets, such as those provided by the Correlates of War Project or the Empirical Studies of Conflict Project were available but did not contain the detailed strength data needed for force ratio analysis. The urgency of the Iraq conflict led to government funding to collect the specific data needed to facilitate large-N case studies based on samples that approached statistical significance.
The Dupuy Institute (TDI) undertook one of the earliest efforts to gather a significant sample of historical insurgency data for serious analysis. Between 2004 and 2009, sponsored by the U.S. Army Center for Army Analysis (CAA); Office of the Secretary of Defense, Net Assessment; and the National Intelligence Council of the Central Intelligence Agency, TDI amassed data on 109 cases of post-World War II insurgencies, interventions, and peacekeeping operations. 83 cases were used for analysis.
Led by Chris Lawrence, TDI’s analytical effort found that insurgency outcomes closely tracked the force ratio of counterinsurgents to insurgents. While overwhelming numbers were not required to defeat an insurgency, force ratios above 10-to-1 nearly always guaranteed a counterinsurgent victory. Conversely, lower force ratios did not preclude success, but conflicts with two or fewer counterinsurgents per insurgent greatly favored an insurgent victory.
When force ratios were assessed together with the nature of the motivation for the insurgency, TDI found that force ratios had little impact on the outcome of insurgencies with a limited political or ideological basis. However, when facing broadly popular insurgencies, counterinsurgents lost every time they possessed a force ratio advantage of 5-1 or less, failed half the time with odds between 6-1 and 10-1, but succeeded three-quarters of the time when outnumbering the insurgents by 10-1 or more.
TDI also examined the relationship between force density and conflict outcome, but was unable to find any correlation in the data.
In 2004, the Defence Science and Technology Laboratory (Dstl) of the British Ministry of Defence initiated a multi-year research program into counterterrorist/counterinsurgency campaigns as an extension of previous research on asymmetric warfare. The three-year effort, led by Andrew Hossack, involved data collection on 44 post-World War I asymmetric conflicts, of which 34 were used for analysis.
Hossack’s study concluded that there is a relationship, albeit weak, between between the odds of military campaign success and force ratios as measured in terms of a ratio of median annual force strengths. The advantages were relatively modest. Each tenfold increase in the ratio of counterinsurgents to insurgents improved the chances of success by only 30%. A 10-1 manpower advantage yielded a 47% chance of success. Improving the ratio to 100-1 still only afforded a 77% chance of winning.
In 2006, the Office of the Secretary of Defense contracted RAND’s National Defense Research Institute for a comprehensive study of insurgency and counterinsurgency. In support of the project, Martin Libicki directed the compilation of data on 89 post-World War II insurgencies to analyze why they began, grew, and were resolved. The original list of cases was based upon a dataset of 127 insurgencies created by James D. Fearon and David D. Laitin[5] and modified.
With regard to force ratios, Libicki concluded that “as a general rule, the greater the government-to-insurgent force ratio, the lower the odds of an insurgent victory,” but that “the relationship is not particularly strong.”
CAA
In 2008, CAA contracted with TDI to code the data for it had collected for 102 post-World War II conflicts and design a database for it, which was designated the CAA Irregular Warfare Database. The availability of the Irregular Warfare Database spawned two CAA analytical efforts.
The first was conducted by Justine Blaho and Lisa Kaiser in 2009, who sought to build a model to predict the outcome of irregular wars. They tested 34 independent variables from 74 of the cases in the database and found 11 with significant correlations to outcome, including the peak counterinsurgent-to-insurgent ratio for each conflict. Blaho and Kaiser removed the variable for counterinsurgent-per-civilian (force density) from their analysis because it did not demonstrate a significant correlation to outcome. Among other conclusions, they determined that counterinsurgents had a greater probability of winning an irregular war if the peak year counterinsurgent-to-insurgent ratio is high.[6]
In 2009, CAA undertook another study aimed at providing historical context for U.S. force levels in Iraq and Afghanistan. Their goal was to find the number of counterinsurgent forces required to arrest and reverse a given level of insurgent violence. The analysts whittled the number of cases from the Irregular Warfare Database to be analyzed to 42 by eliminating those not deemed to be insurgencies, those lacking complete data, and third-party interventions on the side of the insurgents.
In contrast to the previous work using data collected by TDI, the study analysts rejected the validity of counterinsurgent to insurgent force ratios. As justification, they cited the unreliability of data on insurgent force size, insurgent and civilian casualties, and counts of insurgent attacks. Instead, they adopted the force density construct “in accordance with doctrine and previous studies.” In contrast to Quinliven’s 20/1,000 ratio, the CAA analysis concluded that “the minimum counterinsurgent force is 2.8 soldiers per 1,000 residents, with more forces required as the violence level increases.”[7]
In preparation for the 2010 Quadrennial Defense Review, Office of the Director, Cost Assessment and Program Evaluation (CAPE), Department of Defense asked the Institute for Defense Analysis to update a previous study estimating ground force requirements for stability operations. For the revised study, the IDA analysts also made use of the CAA Irregular Warfare Database, selecting 41 cases “with the objective of establishing a relationship between force density and outcomes.”
Like the second CAA study, the IDA analysts deemed force ratios to be a “flawed and unreliable indicator,” stating that “we do not believe that information about the size of insurgent forces is sufficiently credible to be subjected to statistical analysis.” Acknowledging previous studies that did not find a statistically meaningful link between force density and outcome, the IDA analysts adjusted the dataset in three ways: to use force densities based on their estimates for the local population of the actual areas of operation in historical cases (as opposed to the entire country); to count indecisive outcomes as military operational successes for the counterinsurgents; and rescoring several outcomes as indecisive, rather than failure for counterinsurgents.
Using this adjusted data, the IDA analysts found a statistically significant, though not robust, relationship between force density and outcome. They concluded that a density of 20‐25 troops per thousand population was consistent with a 50‐60% chance of success. Successful outcomes decreased greatly for force densities below 15 troops per 1,000, and for operations with ratios above 40 troops per 1,000, the success rate exceeded 75%.
In 2011, Jeffery Friedman, then a doctoral candidate in the Harvard Kennedy School, published a large-N academic study on insurgency force strengths, which addressed the basic question “how does manpower affect counterinsurgency?” As his starting point, Friedman adopted the dataset created by Jason Lyall and Isaiah Wilson III of 173 post-World War I insurgencies.[10] After dropping two cases, he added his own data from 400 additional sources on foreign and indigenous counterinsurgent force strengths, the size and population of areas of operations, and insurgent force size.
Friedman subjected his data to a broader range of statistical testing than the previous studies. He concluded that there was no statistical correlation between overall numbers of counterinsurgents or counterinsurgents per area and outcome. He found that counterinsurgent to insurgent force ratios were significant only with controls on the data. However, troop density – measured as the ratio of counterinsurgents per inhabitant in the specific area of operations that the counterinsurgents sought to control – demonstrated a consistent, positive correlation with insurgent success.
Perhaps of greater significance, Friedman also found that manpower did not necessarily have a decisive impact on insurgency outcome. He could find no discernible empirical support for Quinliven’s 20/1,000 ratio. A counterinsurgent troop density of 80 troops per 1,000 inhabitants was less than twice as likely to succeed as a counterinsurgent force sized an order of magnitude lower. In a model derived from his analysis, as force size increased from 5 to 80 troops per 1,000 inhabitants in the area of operations, the probability of success rose by less than 15 percent.
Conclusion
The quality of quantitative analyses of force strengths in insurgencies and counterinsurgencies improved greatly between 2003 and 2011, but the debate remains unresolved. My next post will look at the conclusions of these studies and evaluate whether they tip the scales one way or another in favor of force ratios or troop density.
Notes
[1] John J. McGrath, Boots on the Ground: Troop Density in Contingency Operations. Fort Leavenworth, KS: Combat Studies Institute, 2006; James Dobbins, Keith Crane, and Seth G. Jones, The Beginner’s Guide to Nation-Building. Santa Monica, CA: The RAND Corporation, 2007; Joshua Thiel, “COIN Manpower Ratios: Debunking the 10 to 1 Ratio and Surges,” Small Wars Journal, 2011; Riley M. Moore, “Counterinsurgency Force Ratio: Strategic Utility or Nominal Necessity?” Small Wars & Insurgencies, 24:5, 2013
[2] Christopher A. Lawrence, “The Analysis of the Historical Effectiveness of Different Counterinsurgency Tactics and Strategies,” Presentation at the Cornwallis Group XIII: Analysis in Support of Policy, The Pearson Peacekeeping Centre Cornwallis Park, Nova Scotia, Canada, 17-20 March 2008; Christopher A. Lawrence, America’s Modern Wars: Understanding Iraq, Afghanistan and Vietnam, Philadelphia, PA: Casemate, 2015
[3] Andrew Hossack, “Security Force & Insurgent Success Factors in Counter-Insurgency Campaigns,” Presentation at the Cornwallis Group XII: Analysis for Multi-Agency Support, The Pearson Peacekeeping Centre Cornwallis Park, Nova Scotia, Canada, 2-5 April 2007; Andrew Hossack, “Strategic Success Factors in Counter-Insurgency Campaigns: With Discussion of the Modelling Approach,” Presentation to ORS Defence Special Interest Group, 24 February 2010
[4] Martin C. Libicki, “Eighty-Nine Insurgencies: Outcomes and Endings,” Appendix A in David C. Gompert and John Gordon IV, War by Other Means: Building Complete and Balanced Capabilities for Counterinsurgency, Santa Monica, CA: RAND Corporation, 2008
[5] James D. Fearon and David D. Laitin, “Ethnicity, Insurgency, and Civil War” American Political Science Review 97, 1, Feb 2003
[6] Justine Blaho and Lisa Kaiser, “A Predictive Model for Irregular Wars Based on a Structured Historical Database.” Presentation at the 48th AORS Symposium, Working Group 5 – Irregular Warfare and Counterinsurgency, 14-15 October 2009
[7] Steven M. Goode, “A Historical Basis for Force Requirements in Counterinsurgency,” Parameters, Winter, 2009-10
[8] R. Royce Kneece, Jr., David A. Adesnik, Jason A. Dechant, Michael F. Fitzsimmons, Arthur Fries, and Mark E. Tillman, “Force Sizing for Stability Operations,” Arlington, VA, Institute for Defense Analysis, 2010
[9] Jeffery A. Friedman, “Manpower and Counterinsurgency: Empirical Foundations for Theory and Doctrine,” Security Studies, 20:556–591, 2011
[10] Jason Lyall and Isaiah Wilson III, “Rage against the Machines: Explaining Outcomes in Counterinsurgency Wars,” International Organization 63, no. 1, Winter 2009
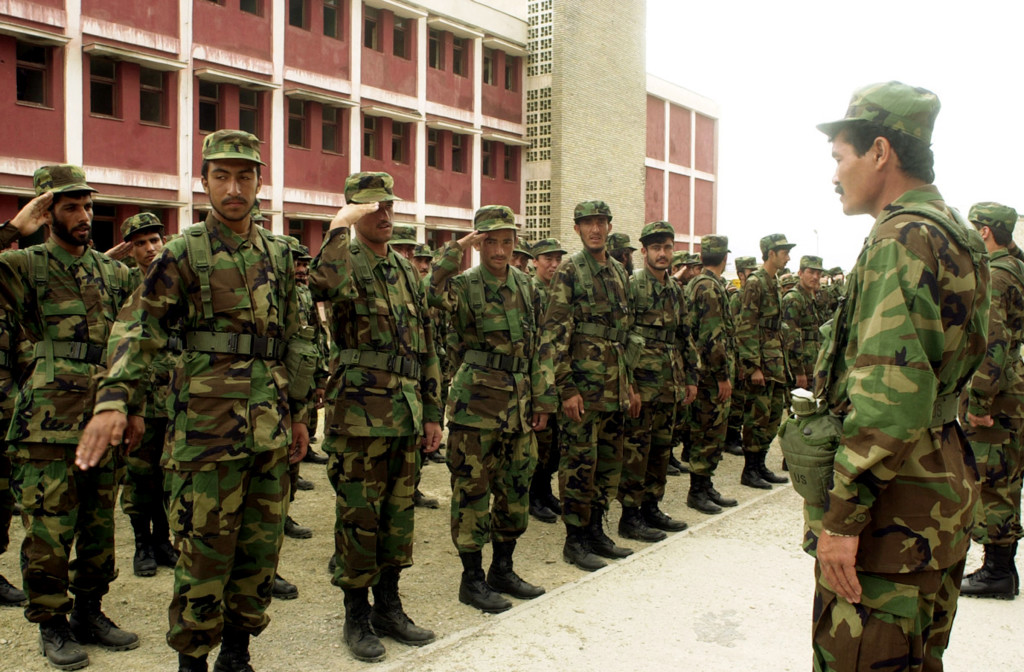
DoD photo by Sgt. Kevin P. Bell, U.S. Army. (Released)
How many troops are needed to defeat an insurgency? This deceptively innocuous question is laden with political and military peril. The answer is, of course, that it depends. Some contend that a precise ratio of counterinsurgents to insurgents or to the local population will lead to victory, while others argue that force strengths are irrelevant to success or failure. In the wake of America’s decidedly ambivalent experiences in Iraq and Afghanistan, the debate remains unresolved. However, there have been several recent analytical efforts focused on resolving the question. This will be the first in a series of posts that will review these studies and their conclusions.
It is not clear where the notion originated that force ratios mattered in counterinsurgency. It appears to have become an article of faith during the British campaign in Malaya, although Sir Robert Thompson — a British staff officer in that conflict and a counterinsurgency theorist influential during the Vietnam War — subsequently claimed that the rule-of-thumb that 20 troops were needed per 1,000 insurgents to succeed was the invention of a journalist.[1] Another Mayalan campaign veteran, Richard Clutterbuck, likewise later derided the validity of a “tie-down” ratio:
Much nonsense is heard on the subject of tie-down ratios in guerrilla warfare–that 10 to 12 government troops are needed to tie down a single guerrilla, for instance. This is a dangerous illusion, arising from a disregard of the facts.[2]
The relevance of force ratios made a comeback in the mid-1990s, albeit measured in a different way. Seeking a way of projecting force requirements necessary for sustained stability operations, RAND analyst James T. Quinliven looked at 13 historical cases and concluded that success required 20 troops were needed per 1,000 local inhabitants.[3] Defining ratios by the number of troops per population became known as force density.
The political volatility of force requirements for stability operations and counterinsurgency became vividly apparent during the lead up to the U.S. invasion of Iraq in 2003. Quinlivan published an update of his analysis to address Iraq and asserted that to meet a ratio of 20 troops per 1,000 inhabitants, 500,000 foreign troops were necessary to stabilize 25 million Iraqis.[4] U.S. Army Chief of Staff General Eric Shinseki told Congress that “several hundred thousand” American troops would be necessary to stabilize Iraq following the fall of Saddam Hussein. This drew a quick rebuttal from Deputy Secretary of Defense Paul Wolfowitz, who testified that Shinseki’s estimate was “wildly off the mark.” The public disagreement led to Shinseki’s premature retirement and replacement as Army Chief of Staff.
Although the initial phase of Operation IRAQI FREEDOM quickly defeated the Iraqi military and toppled Saddam’s regime, the chaotic stabilization effort that followed and the emergence of an insurgency appeared to bear out the validity of Qunilivan’s and Shinseki’s assessments for force requirements. Certainly one influential group thought so: the authors of the revised U.S. Army and Marine Corps doctrinal manual FM 3-24/MCWP 3-33.5 Counterinsurgency, published in 2006. The manual rejected tie-down ratios but endorsed Quinlivan’s force density concept:
During previous conflicts, planners assumed that combatants required a 10 or 15 to 1 advantage over insurgents to win. However, no predetermined, fixed ratio of friendly troops to enemy combatants ensures success in COIN. The conditions of the operational environment and the approaches insurgents use vary too widely. A better force requirement gauge is troop density, the ratio of security forces (including the host nation’s military and police forces as well as foreign counterinsurgents) to inhabitants. Most density recommendations fall within a range of 20 to 25 counterinsurgents for every 1000 residents in an AO. Twenty counterinsurgents per 1000 residents is often considered the minimum troop density required for effective COIN operations; however as with any fixed ratio, such calculations remain very dependent upon the situation.[5]
FM 3-24 was often cited as the intellectual foundation for the subsequent success of the so-called Iraqi “Surge” in 2007 under General David Petraeus, who had overseen revision of the manual as the commander of the U.S. Army’s Combined Arms Center at Ft. Leavenworth.
Interestingly enough, however, this endorsement of force density ratios was qualified in the subsequent joint doctrinal manual, JP 3-24 Counterinsurgency Operations, published just three years later in 2009. While force density was still considered a useful measure, mention of the specific 20/1,000 ratio was omitted:
No force level guarantees victory for either side, insurgent or counterinsurgent. No predetermined, fixed ratio of friendly forces to enemy forces ensures success in COIN. The OE and insurgents’ approaches vary too widely. Such calculations remain very dependent upon the assets available and the situation. A better force requirement gauge is counterinsurgent force density, which is the ratio of land security forces (including both indigenous and foreign contributions) and supporting elements (which must account for technological sophistication and applicability) to inhabitants. Force density will depend on the overall context, especially the size and density of the population, and can change over time. In some situations, the necessary force ratio may be unattainable. In these situations, the commander will have to determine if there are ways to leverage other advantages through innovative operational design and interdependent joint operations. If not, this may lead the commander to adopt limited objectives or plan for a prolonged, multiphased campaign as alternatives.[6]
When JP 3-24 and FM 3-24 were again revised in 2013 and 2014, respectively, neither contained any references to force level requirements, tie-down ratios, or troop density.[7] As quickly as the concepts had been adopted, they were abandoned. This is likely the result of more careful examinations of the relationship between force strength and counterinsurgency outcomes conducted during the 2000s. I will take a closer look at these studies in subsequent posts.
[5] Field Manual (FM) 3-24 Counterinsurgency, Washington, DC: Headquarters, Department of the Army, December 2006, p. I-13
[6] Joint Publication (JP) 3-24 Counterinsurgency Operations, Washington, DC: Joint Staff of the Joint Chiefs of Staff, 5 October 2009, p. III-3
[7] Joint Publication (JP) 3-24 Counterinsurgency, Washington, DC: Joint Staff of the Joint Chiefs of Staff, 22 November 2013; Field Manual (FM) 3-24Insurgencies and Countering Insurgencies, Washington, DC: Headquarters, Department of the Army, May 2014
 Much has changed since James Quinliven kicked off discussion over manpower and counterinsurgency. One of the most significant differences is the availability now of useful collections of historical data for analysis.
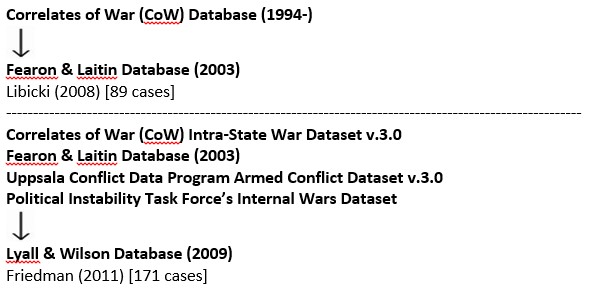
![By Perhelion [CC0], via Wikimedia Commons](https://dupuyinstitute.dreamhosters.com/wp-content/uploads/2016/01/1024px-Balanced_scale_of_Justice.svg_-1024x804.png)