Category Force Ratios

The U.S. Army Three-to-One Rule versus 243 Battles 1600-1900

Now, at the time I wrote War by Numbers, I was not aware of this sentence planted in FM 6-0 and so therefore did not feel a need to respond to the “3-to-1 rule.” It is a rule of thumb, not completely without value, that had been discussed before. I thought this issue was properly understood in the U.S. analytical and defense community, therefore I did not feel a need to address it further. It turns out that I do. So, let me take a moment to tap into our databases and properly address this using all the resources at my disposal.

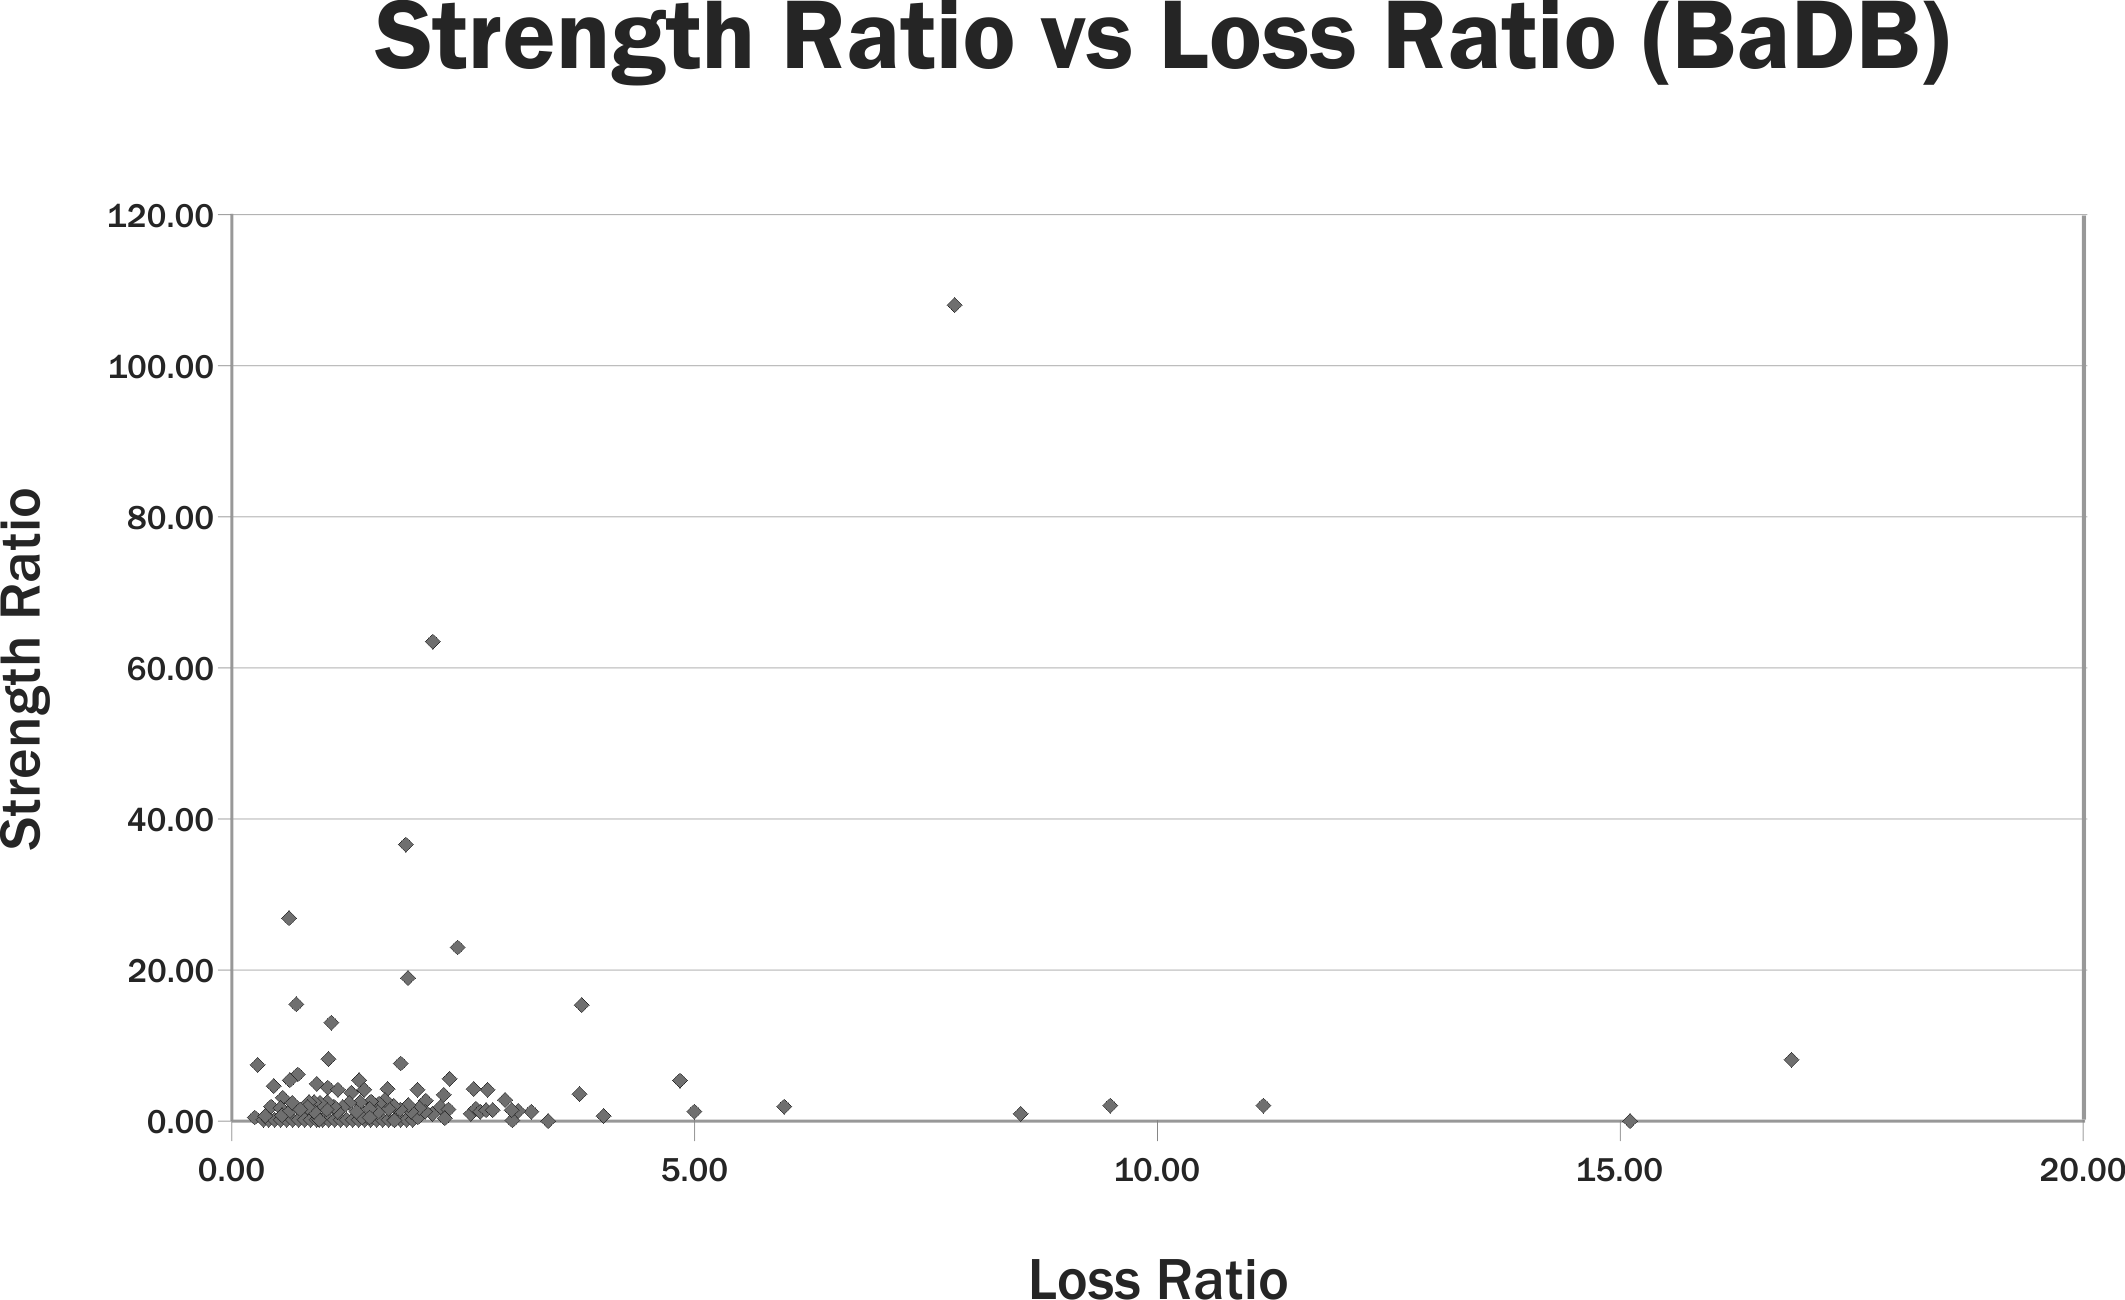
First of all, The Dupuy Institute has a database of 243 engagements from 1600-1900 called the Battles Data Base (BaDB). These are almost all field battles, where the two sides deployed their forces of tens of thousands of people and resolve their dispute that day. Of the 243 battles, only 40 of them last longer than a day. The largest engagement has the attacker fielding 365,000 men (Leipzig, 1813) and the smallest engagement had the defender fielding but 350 men (Majuba Hill, 1881).

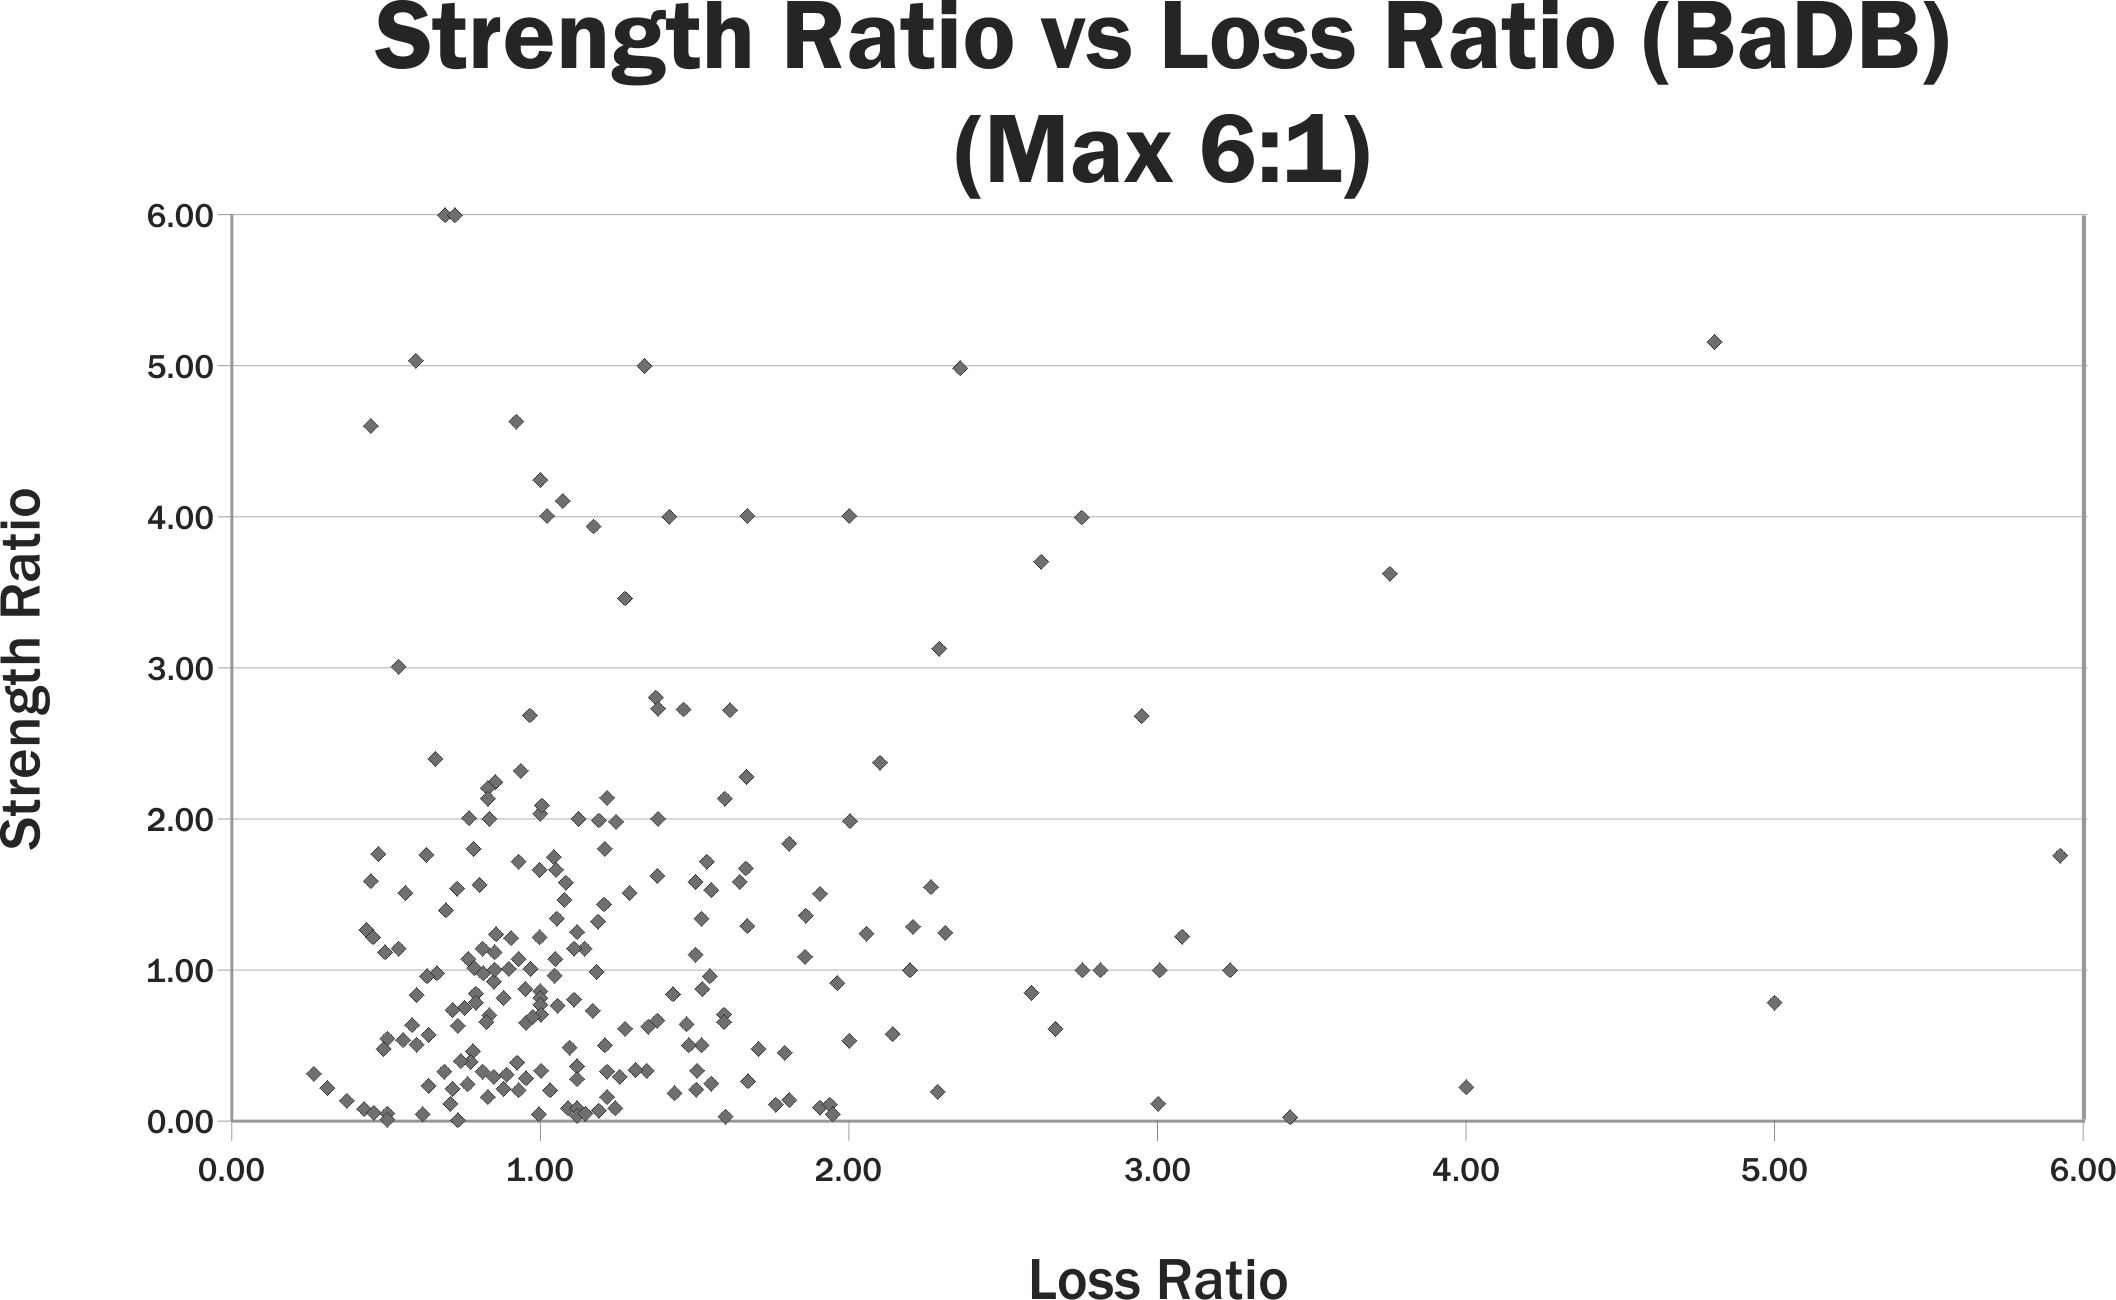
As this rule of thumb evolved out of the U.S. Civil War, then an examination of historical field battles from 1600-1900 is particularly relevant. Looking at the force ratio for these battles shows:

Force Ratio…………………..Percent Attacker Wins………………..Number of Cases

0.26 to 04.9-to-1………………54%……………………………………………13

0.50 to 0.98-to-1………………54………………………………………………81

1.00 to 1.47-to-1………………56………………………………………………71

1.50 to 1.96-to-1………………63………………………………………………38

2.00 to 2.44-to-1………………50………………………………………………16

2.58 to 2.94-to-1………………57………………………………………………..7

3.00 to 3.43-to-1…………….100………………………………………………..5

3.75 to 3.76-to-1………………..0………………………………………………..2

4.00 to 4.93-to-1………………75………………………………………………..4

7.78 to 16.82-to-1……………..67………………………………………………..6


The pattern here is not particularly clear, as low odds attack, where the attacker is outnumbered, succeed over half the time, as do attacks at higher odds. Some of this is due to the selection of battles, some of this is due to the lack of regular trained armies, and some of this is due to the attacker choosing to attack because they have advantages in morale, training, experience, position, etc. that outweigh the numbers. But, the argument that is made in FM 6-0 that based upon historical data at three-to-one odds the defender wins 50% of the time is clearly not shown. For example, in this data set there are 12 cases between the odds of 2.50 to 3.50-to-1. Of those 12 cases, the attacker wins in 9 of them (75%). The three cases where the defender wins are: 1) Battle of Buena Vista in 1847 where Santa Anna’s Mexican Army attacked Zachary Taylor’s American Army at 2.94-to-1, 2) Battle of Inkeman in 1854 where the Russian Army attacked the French and British armies in Crimea at 2.63-to-1, and 3) Battle of Belfort in 1871 where the French Army attack the German Army at 2.75-to-1. One could certainly argue that in these three cases, the defenders held advantages in training, experience and overall combat effectiveness.

Next post will address the 49 American Civil War battles in our database.

The U.S. Army Three-to-One Rule

Various Three-to-one rules of thumbs have existed in the U.S. Army and in writings possibly as early as the American Civil War (1861-1865). These are fine as “rules of thumb” as long as one does not take them seriously and understands what they really mean. But, unfortunately, we have now seen something that is a loose rule of thumb turned into a codified and quantified rule. This is annoyingly overstating its importance and as given in U.S. Army manuals, is patently false.

The U.S. Army has apparently codified the “three-to-one rule” in its documentation and has given it a value. In the 2014 edition of FM 6-0, paragraph 9-103, it states that “For example, historically, defenders have over a 50 percent probability of defeating an attacking force approximately three times their equivalent strength.” This statement, on the surface, simply is incorrect. For example, the following table from my book War by Numbers is drawn from a series of 116 division-level engagements in France in 1944 against the Germans (see War by Numbers, page 10) They show the following relationship between force ratio and outcome:

European Theater of Operations (ETO) Data, 1944


Force Ratio………………..Result…………………Percent Failure…Number of cases

0.55 to 1.01-to-1.00………Attack Fails…………………..100%……………….5

1.15 to 1.88-to-1.00………Attack usually succeeds……21%………………..48

1.95 to 2.56-to-1.00………Attack usually succeeds……10%………………..21

2.71-to-1.00 and higher…Attacker Advances…………….0%……………….. 42


Now these engagements are from fighting between the U.S., UK and Germany in France and Germany in 1944. These are engagements between forces of roughly equal competence. As can be seen, based upon 42 division-level engagements, in all cases of attacks at three-to-one (more specifically 2.71-to-1 and greater), the attacker advanced. Meaning in all cases of attacks at three-to-one, the attacker won. This directly contradicts the statement in FM 6-0, and contradicts it based upon historical data.

This is supplemented by the following two tables on the next page of War by Numbers. The first table shows the German performance when attacking Soviet units in 1943.

Germans attacking Soviets (Battles of Kharkov and Kursk), 1943


Force Ratio………………..Result………………….Percent Failure…Number of cases

0.63 to 1.06-to-1.00………Attack usually succeeds……..20%……………………..5

1.18 to 1.87-to-1.00………Attack usually succeeds……….6%……………………17

1.91-to-1.00 and higher…Attacker Advances……………….0%……………………21


The next table shows the Soviet performance when attacking German units in 1943:

Soviets attacking Germans (Battles of Kharkov and Kursk), 1943


Force Ratio………………Result…………………..Percent Failure…Number of cases

0.40 to 1.05-to-1…………Attack usually fails…………70%……………………10

1.20 to 1.65-to-1.00…….Attack often fails…………….50%……………………11

1.91 to 2.89-to-1.00…….Attack sometimes fails…….44%……………………..9


These charts are from the fighting around Kharkov in February, March and August of 1943 and the fighting during the Battle of Kursk in July 1943. It is 73 engagements between the German and Soviet armies.

Now, there is a clear performance difference between the German and the Soviet armies at this time. This is discussed in considerable depth in War by Numbers and will not be addressed here. But, what it amounts to is that the German Army has an advantage in the casualty exchange and that advantage also shows up in the outcomes of the battles, as show above. If they attacked at two-to-one odds are greater, they would win. The Soviets attacking at the same odds would win only 56 percent of the time. Clearly, at the division-level, in a unit to unit comparison, the Germans were two or three times better than their Soviet opponents.

Still, even in the worse case, which is the Soviets attacking the Germans, we do not get to the claim made in FM 6-0, which is the defender won 50% of the time when attacked at three-to-one. In fact, the Soviets managed to win 50% of the time when attacking at 1.20 to 1.65-to-1. Something is clearly wrong with the statement in FM 6-0.

Now, at the time I wrote War by Numbers, I was not aware of this sentence planted in FM 6-0 and so therefore did not feel a need to respond to the “three-to-one rule.” It is a rule of thumb, not completely without value, that had been discussed before (see Dupuy, Understanding War, pages 31-37). I thought this issue was properly understood in the U.S. analytical and defense community, therefore I did not feel a need to address it further. It turns out that I do. So, I will take a moment to tap into our databases and properly address this using all the resources at my disposal. This will be in subsequent blog posts.

Do Training Models Need Validation?

Do we need to validate training models? The argument is that as the model is being used for training (vice analysis), it does not require the rigorous validation that an analytical model would require. In practice, I gather this means they are not validated. It is an argument I encountered after 1997. As such, it is not addressed in my letters to TRADOC in 1996: See http://www.dupuyinstitute.org/pdf/v1n4.pdf

Over time, the modeling and simulation industry has shifted from using models for analysis to using models for training. The use of models for training has exploded, and these efforts certainly employ a large number of software coders. The question is, if the core of the analytical models have not been validated, and in some cases, are known to have problems, then what are the models teaching people? To date, I am not aware of any training models that have been validated.

Let us consider the case of JICM. The core of the models attrition calculation was the Situational Force Scoring (SFS). Its attrition calculator for ground combat is based upon a version of the 3-to-1 rule comparing force ratios to exchange ratios. This is discussed in some depth in my book War by Numbers, Chapter 9, Exchange Ratios. To quote from page 76:

If the RAND version of the 3 to 1 rule is correct, then the data should show a 3 to 1 force ratio and a 3 to 1 casualty exchange ratio. However, there is only one data point that comes close to this out of the 243 points we examined.

That was 243 battles from 1600-1900 using our Battles Data Base (BaDB). We also tested it to our Division Level Engagement Data Base (DLEDB) from 1904-1991 with the same result. To quote from page 78 of my book:

In the case of the RAND version of the 3 to 1 rule, there is again only one data point (out of 628) that is anywhere close to the crossover point (even fractional exchange ratio) that RAND postulates. In fact it almost looks like the data conspire to leave a noticeable hole at that point.

So, does this create negative learning? If the ground operations are such that an attacking ends up losing 3 times as many troops as the defender when attacking at 3-to-1 odds, does this mean that the model is training people not to attack below those odds, and in fact, to wait until they have much more favorable odds? The model was/is (I haven’t checked recently) being used at the U.S. Army War College. This is the advanced education institute that most promotable colonels attend before advancing to be a general officer. Is such a model teaching them incorrect relationships, force ratios and combat requirements?

You fight as you train. If we are using models to help train people, then it is certainly valid to ask what those models are doing. Are they properly training our soldiers and future commanders? How do we know they are doing this. Have they been validated?

Combat Adjudication

As I stated in a previous post, I am not aware of any other major validation efforts done in the last 25 years other than what we have done. Still, there is one other effort that needs to be mentioned. This is described in a 2017 report: Using Combat Adjudication to Aid in Training for Campaign Planning.pdf

I gather this was work by J-7 of the Joint Staff to develop Joint Training Tools (JTT) using the Combat Adjudication Service (CAS) model. There are a few lines in the report that warm my heart:

  1. “It [JTT] is based on and expanded from Dupuy’s Quantified Judgement Method of Analysis (QJMA) and Tactical Deterministic Model.”
  2. “The CAS design used Dupuy’s data tables in whole or in part (e.g. terrain, weather, water obstacles, and advance rates).”
  3. “Non-combat power variables describing the combat environment and other situational information are listed in Table 1, and are a subset of variables (Dupuy, 1985).”
  4. “The authors would like to acknowledge COL Trevor N. Dupuy for getting Michael Robel interested in combat modeling in 1979.”

Now, there is a section labeled verification and validation. Let me quote from that:

CAS results have been “Face validated” against the following use cases:

    1. The 3:1 rules. The rule of thumb postulating an attacking force must have at least three times the combat power of the defending force to be successful.
    2. 1st (US) Infantry Divison vers 26th (IQ) Infantry Division during Desert Storm
    3. The Battle of 73 Easting: 2nd ACR versus elements of the Iraqi Republican Guards
    4. 3rd (US) Infantry Division’s first five days of combat during Operation Iraqi Freedom (OIF)

Each engagement is conducted with several different terrain and weather conditions, varying strength percentages and progresses from a ground only engagement to multi-service engagements to test the effect of CASP [Close Air Support] and interdiction on the ground campaign. Several shortcomings have been detected, but thus far ground and CASP match historical results. However, modeling of air interdiction could not be validated.

So, this is a face validation based upon three cases. This is more than what I have seen anyone else do in the last 25 years.

The Great 3-1 Rule Debate

coldwarmap3[This piece was originally posted on 13 July 2016.]

Trevor Dupuy’s article cited in my previous post, “Combat Data and the 3:1 Rule,” was the final salvo in a roaring, multi-year debate between two highly regarded members of the U.S. strategic and security studies academic communities, political scientist John Mearsheimer and military analyst/polymath Joshua Epstein. Carried out primarily in the pages of the academic journal International Security, Epstein and Mearsheimer argued the validity of the 3-1 rule and other analytical models with respect the NATO/Warsaw Pact military balance in Europe in the 1980s. Epstein cited Dupuy’s empirical research in support of his criticism of Mearsheimer’s reliance on the 3-1 rule. In turn, Mearsheimer questioned Dupuy’s data and conclusions to refute Epstein. Dupuy’s article defended his research and pointed out the errors in Mearsheimer’s assertions. With the publication of Dupuy’s rebuttal, the International Security editors called a time out on the debate thread.

The Epstein/Mearsheimer debate was itself part of a larger political debate over U.S. policy toward the Soviet Union during the administration of Ronald Reagan. This interdisciplinary argument, which has since become legendary in security and strategic studies circles, drew in some of the biggest names in these fields, including Eliot Cohen, Barry Posen, the late Samuel Huntington, and Stephen Biddle. As Jeffery Friedman observed,

These debates played a prominent role in the “renaissance of security studies” because they brought together scholars with different theoretical, methodological, and professional backgrounds to push forward a cohesive line of research that had clear implications for the conduct of contemporary defense policy. Just as importantly, the debate forced scholars to engage broader, fundamental issues. Is “military power” something that can be studied using static measures like force ratios, or does it require a more dynamic analysis? How should analysts evaluate the role of doctrine, or politics, or military strategy in determining the appropriate “balance”? What role should formal modeling play in formulating defense policy? What is the place for empirical analysis, and what are the strengths and limitations of existing data?[1]

It is well worth the time to revisit the contributions to the 1980s debate. I have included a bibliography below that is not exhaustive, but is a place to start. The collapse of the Soviet Union and the end of the Cold War diminished the intensity of the debates, which simmered through the 1990s and then were obscured during the counterterrorism/ counterinsurgency conflicts of the post-9/11 era. It is possible that the challenges posed by China and Russia amidst the ongoing “hybrid” conflict in Syria and Iraq may revive interest in interrogating the bases of military analyses in the U.S and the West. It is a discussion that is long overdue and potentially quite illuminating.

NOTES

[1] Jeffery A. Friedman, “Manpower and Counterinsurgency: Empirical Foundations for Theory and Doctrine,” Security Studies 20 (2011)

BIBLIOGRAPHY

(Note: Some of these are behind paywalls, but some are available in PDF format. Mearsheimer has made many of his publications freely available here.)

John J. Mearsheimer, “Why the Soviets Can’t Win Quickly in Central Europe,” International Security, Vol. 7, No. 1 (Summer 1982)

Samuel P. Huntington, “Conventional Deterrence and Conventional Retaliation in Europe,” International Security 8, no. 3 (Winter 1983/84)

Joshua Epstein, Strategy and Force Planning (Washington, DC: Brookings, 1987)

Joshua M. Epstein, “Dynamic Analysis and the Conventional Balance in Europe,” International Security 12, no. 4 (Spring 1988)

John J. Mearsheimer, “Numbers, Strategy, and the European Balance,” International Security 12, no. 4 (Spring 1988)

Stephen Biddle, “The European Conventional Balance,” Survival 30, no. 2 (March/April 1988)

Eliot A. Cohen, “Toward Better Net Assessment: Rethinking the European Conventional Balance,International Security Vol. 13, No. 1 (Summer 1988)

Joshua M. Epstein, “The 3:1 Rule, the Adaptive Dynamic Model, and the Future of Security Studies,” International Security 13, no. 4 (Spring 1989)

John J. Mearsheimer, “Assessing the Conventional Balance,” International Security 13, no. 4 (Spring 1989)

John J. Mearsheimer, Barry R. Posen, Eliot A. Cohen, “Correspondence: Reassessing Net Assessment,” International Security 13, No. 4 (Spring 1989)

Trevor N. Dupuy, “Combat Data and the 3:1 Rule,” International Security 14, no. 1 (Summer 1989)

Stephen Biddle et al., Defense at Low Force Levels (Alexandria, VA: Institute for Defense Analyses, 1991)

Force Ratios in Conventional Combat

American soldiers of the 117th Infantry Regiment, Tennessee National Guard, part of the 30th Infantry Division, move past a destroyed American M5A1 “Stuart” tank on their march to recapture the town of St. Vith during the Battle of the Bulge, January 1945. [Wikipedia]
[This piece was originally posted on 16 May 2017.]

This post is a partial response to questions from one of our readers (Stilzkin). On the subject of force ratios in conventional combat….I know of no detailed discussion on the phenomenon published to date. It was clearly addressed by Clausewitz. For example:

At Leuthen Frederick the Great, with about 30,000 men, defeated 80,000 Austrians; at Rossbach he defeated 50,000 allies with 25,000 men. These however are the only examples of victories over an opponent two or even nearly three times as strong. Charles XII at the battle of Narva is not in the same category. The Russian at that time could hardly be considered as Europeans; moreover, we know too little about the main features of that battle. Bonaparte commanded 120,000 men at Dresden against 220,000—not quite half. At Kolin, Frederick the Great’s 30,000 men could not defeat 50,000 Austrians; similarly, victory eluded Bonaparte at the desperate battle of Leipzig, though with his 160,000 men against 280,000, his opponent was far from being twice as strong.

These examples may show that in modern Europe even the most talented general will find it very difficult to defeat an opponent twice his strength. When we observe that the skill of the greatest commanders may be counterbalanced by a two-to-one ratio in the fighting forces, we cannot doubt that superiority in numbers (it does not have to more than double) will suffice to assure victory, however adverse the other circumstances.

and:

If we thus strip the engagement of all the variables arising from its purpose and circumstance, and disregard the fighting value of the troops involved (which is a given quantity), we are left with the bare concept of the engagement, a shapeless battle in which the only distinguishing factors is the number of troops on either side.

These numbers, therefore, will determine victory. It is, of course, evident from the mass of abstractions I have made to reach this point that superiority of numbers in a given engagement is only one of the factors that determines victory. Superior numbers, far from contributing everything, or even a substantial part, to victory, may actually be contributing very little, depending on the circumstances.

But superiority varies in degree. It can be two to one, or three or four to one, and so on; it can obviously reach the point where it is overwhelming.

In this sense superiority of numbers admittedly is the most important factor in the outcome of an engagement, as long as it is great enough to counterbalance all other contributing circumstance. It thus follows that as many troops as possible should be brought into the engagement at the decisive point.

And, in relation to making a combat model:

Numerical superiority was a material factor. It was chosen from all elements that make up victory because, by using combinations of time and space, it could be fitted into a mathematical system of laws. It was thought that all other factors could be ignored if they were assumed to be equal on both sides and thus cancelled one another out. That might have been acceptable as a temporary device for the study of the characteristics of this single factor; but to make the device permanent, to accept superiority of numbers as the one and only rule, and to reduce the whole secret of the art of war to a formula of numerical superiority at a certain time and a certain place was an oversimplification that would not have stood up for a moment against the realities of life.

Force ratios were discussed in various versions of FM 105-5 Maneuver Control, but as far as I can tell, this was not material analytically developed. It was a set of rules, pulled together by a group of anonymous writers for the sake of being able to adjudicate wargames.

The only detailed quantification of force ratios was provided in Numbers, Predictions and War by Trevor Dupuy. Again, these were modeling constructs, not something that was analytically developed (although there was significant background research done and the model was validated multiple times). He then discusses the subject in his book Understanding War, which I consider the most significant book of the 90+ that he wrote or co-authored.

The only analytically based discussion of force ratios that I am aware of (or at least can think of at this moment) is my discussion in my upcoming book War by Numbers: Understanding Conventional Combat. It is the second chapter of the book: https://dupuyinstitute.dreamhosters.com/2016/02/17/war-by-numbers-iii/

In this book, I assembled the force ratios required to win a battle based upon a large number of cases from World War II division-level combat. For example (page 18 of the manuscript):

I did this for the ETO, for the battles of Kharkov and Kursk (Eastern Front 1943, divided by when the Germans are attacking and when the Soviets are attacking) and for PTO (Manila and Okinawa 1945).

There is more than can be done on this, and we do have the data assembled to do this, but as always, I have not gotten around to it. This is why I am already considering a War by Numbers II, as I am already thinking about all the subjects I did not cover in sufficient depth in my first book.

The 3-to-1 Rule in Histories

I was reading a book this last week, The Blitzkrieg Legend: The 1940 Campaign in the West by Karl-Heinz Frieser (originally published in German in 1996). On page 54 it states:

According to a military rule of thumb, the attack should be numerically superior to the defender at a ratio of 3:1. That ratio goes up if the defender can fight from well developed fortification, such as the Maginot Line.

This “rule” never seems to go away. Trevor Dupuy had a chapter on it in Understanding War, published in 1987. It was Chapter 4: The Three-to-One Theory of Combat. I didn’t really bother discussing the 3-to-1 rule in my book, War by Numbers: Understanding Conventional Combat. I do have a chapter on force ratios: Chapter 2: Force Ratios. In that chapter I show a number of force ratios based on history. Here is my chart from the European Theater of Operations, 1944 (page 10):

Force Ratio…………………..Result……………..Percentage of Failure………Number of Cases

0.55 to 1.01-to-1.00…………Attack Fails………………………….100……………………………………5

1.15 to 1.88-to-1.00…………Attack usually succeeds………21…………………………………..48

1.95 to 2.56-to-1.00…………Attack usually succeeds………10…………………………………..21

2.71 to 1.00 and higher….Attack advances……………………..0…………………………………..42


We have also done a number of blog posts on the subject (click on our category “Force Ratios”), primarily:

Trevor Dupuy and the 3-1 Rule

You will also see in that blog post another similar chart showing the odds of success at various force ratios.

Anyhow, I kind of think that people should probably quit referencing the 3-to-1 rule. It gives it far more weight and attention than it deserves.


Aussie OR

Over the years I have run across a number of Australian Operations Research and Historical Analysis efforts. Overall, I have been impressed with what I have seen. Below is one of their papers written by Nigel Perry. He is not otherwise known to me. It is dated December 2011: Applications of Historical Analyses in Combat Modeling

It does address the value of Lanchester equations in force-on-force combat models, which in my mind is already a settled argument (see: Lanchester Equations Have Been Weighed). His is the latest argument that I gather reinforces this point.

The author of this paper references the work of Robert Helmbold and Dean Hartley (see page 14). He does favorably reference the work of Trevor Dupuy but does not seem to be completely aware of the extent or full nature of it (pages 14, 16, 17, 24 and 53). He does not seem to aware that the work of Helmbold and Hartley was both built from a database that was created by Trevor Dupuy’s companies HERO & DMSI. Without Dupuy, Helmbold and Hartley would not have had data to work from.

Specifically, Helmbold was using the Chase database, which was programmed by the government from the original paper version provided by Dupuy. I think it consisted of 597-599 battles (working from memory here). It also included a number of coding errors when they programmed it and did not include the battle narratives. Hartley had Oakridge National Laboratories purchase a computerized copy from Dupuy of what was now called the Land Warfare Data Base (LWDB). It consisted of 603 or 605 engagements (and did not have the coding errors but still did not include the narratives). As such, they both worked from almost the same databases.

Dr. Perrty does take a copy of Hartley’s  database and expands it to create more engagements. He says he expanded it from 750 battles (except the database we sold to Harley had 603 or 605 cases) to around 1600. It was estimated in the 1980s by Curt Johnson (Director and VP of HERO) to take three man-days to create a battle. If this estimate is valid (actually I think it is low), then to get to 1600 engagements the Australian researchers either invested something like 10 man-years of research, or relied heavily on secondary sources without any systematic research, or only partly developed each engagement (for example, only who won and lost). I suspect the latter.

Dr. Perry shows on page 25:

Data-segment……..Start…….End……Number of……Attacker…….Defender

Epoch…………………Year…….Year……..Battles………Victories……Victories

Ancient………………- 490…….1598………….63………………36……………..27

17th Century……….1600…….1692………….93………………67……………..26

18th Century……….1700…….1798………..147…………….100……………..47

Revolution…………..1792……1800…………238…………….168…………….70

Empire……………….1805……1815…………327……………..203…………..124

ACW………………….1861……1865…………143……………….75…………….68

19th Century……….1803…….1905…………126……………….81…………….45

WWI………………….1914…….1918…………129……………….83…………….46

WWII…………………1920…….1945…………233……………..165…………….68

Korea………………..1950…….1950…………..20……………….20………………0

Post WWII………….1950……..2008…………118……………….86…………….32


We, of course, did something very similar. We took the Land Warfare Data Base (the 605 engagement version), expanded in considerably with WWII and post-WWII data, proofed and revised a number of engagements using more primarily source data, divided it into levels of combat (army-level, division-level, battalion-level, company-level) and conducted analysis with the 1280 or so engagements we had. This was a much more powerful and better organized tool. We also looked at winner and loser, but used the 605 engagement version (as we did the analysis in 1996). An example of this, from pages 16 and 17 of my manuscript for War by Numbers shows:

Attacker Won:


                        Force Ratio                Force Ratio    Percent Attack Wins:

                        Greater than or         less than          Force Ratio Greater Than

                        equal to 1-to-1            1-to1                or equal to 1-to-1

1600-1699        16                              18                         47%

1700-1799        25                              16                         61%

1800-1899        47                              17                         73%

1900-1920        69                              13                         84%

1937-1945      104                                8                         93%

1967-1973        17                              17                         50%

Total               278                              89                         76%


Defender Won:


                        Force Ratio                Force Ratio    Percent Defense Wins:

                        Greater than or         less than          Force Ratio Greater Than

                        equal to 1-to-1            1-to1                or equal to 1-to-1

1600-1699           7                                6                       54%

1700-1799         11                              13                       46%

1800-1899         38                              20                       66%

1900-1920         30                              13                       70%

1937-1945         33                              10                       77%

1967-1973         11                                5                       69%

Total                130                              67                       66%


Anyhow, from there (pages 26-59) the report heads into an extended discussion of the analysis done by Helmbold and Hartley (which I am not that enamored with). My book heads in a different direction: War by Numbers III (Table of Contents)


We probably need to keep talking about Afghanistan

image description

Shawn posted a very nice summary a couple of days ago. It is worth reading if you have not already: Meanwhile in Afghanistan

Recent article reports the same trends: Afghan-government-lost-2-percent-territory

A couple of things get my attention in all this:

  1. They are talking about control of territory. I believe control of population is a lot better metric.
    1. One notes in Shawn’s write up that control of population is 68.5% (vice 61.3% of area).
  2. The insurgent level of activity is very high:
    1. 5,523 Afghan Army and police killed (15,000 casualties)
    2. 22,733 incidents from 8/1/2015 to 8/15/2016

Based on Chapter 11 (Estimating Insurgent Force Size) of my book America’s Modern Wars, working backward from this incident data would mean that there are something like 60,000 – 80,000 full-time and part-time insurgents operating. There is a lot comparing apples to oranges to get there: for example, how are they counting incidents in Afghanistan vice how were they counting incidents in the past cases we use for this estimate, what is the mix of full-time and part-time insurgents, how active and motivated are the insurgents, and so forth; but that level of activity is similar to the level of activity in Iraq at its worse (26,033 incidents in 2005, 45,330 in 2006 and 19,125 in 2007 according to one count). We had over 180,000 U.S. and coalition troops there to deal with that. The Afghani’s have 170,000 Army and Air Force or around 320,000 if you count police (and we did not count police in our database unless there were actively involved in counterinsurgent work). The 5,500+ Afghan Army and police killed a year indicates a pretty active insurgency. We lost less than 5,500 for the entire time we were in Iraq. The low wounded-to-killed ratio in the current Afghan data may well be influenced by who they choose to report as wounded and how they address lightly wounded (as discussed in Chapter 15, Casualties, in my upcoming book War by Numbers). Don’t know what current U.S. Army estimates are of Afghan insurgent strength.

Now, in Chapter Six of my book America’s Modern Wars, we developed a force ratio model based upon 83 historical cases (see chart at top of this post). It was very dependent on the cause of the insurgency, whether it was based on a central idea (like nationalism) or was regional or factional, or whether it was based on a overarching idea (like communism). I don’t still don’t really know the nature of the Afghan insurgency, and we were never funded to study this insurgency (we were only funded for Iraq work). So, I have not done the in-depth analysis of the Afghan insurgency that I did for Iraq. But…….nothing here looks particularly positive.

We never did an analysis of stalemated insurgencies. It could be done, although there are not that many cases of these. One could certainly examine any insurgency that lasts more than 15 years for this purpose. Does a long stalemated insurgency mean that the government (or counterinsurgents) eventually win? Or does a long stalemated insurgency mean that the insurgents eventually win? I don’t know. I would have to go back through our database of 100+ cases, update the data, sort out the cases and then I could make some predictions. That takes time and effort, and right now my effort is focused elsewhere. Is anyone inside DOD doing this type of analysis? I doubt it. Apparently a stalemate means that you can now pass the problem onto the next administration. While it solves the immediate political problem, is really does not answer the question of whether we are winning or losing. Is what we are doing good enough that this will revolve in our favor in the next ten years, or do we need to do more? I think this is the question that needs to be addressed.

Trevor Dupuy and the 3-1 Rule

rulesDr. Reina Pennington, a professor of history at Norwich University, recently published an analysis of the Eastern Front during World War II which made the case that the Soviet superiority in manpower over Germany was not as large as is often claimed. In support of her argument, Pennington provided a table comparing the total number of Soviet and German combat forces and force ratios at different times during the conflict. She pointed out that for much of the war, Soviet forces were either outnumbered, or achieved modest numerical superiorities that did not exceed 3 to 1 until late in 1944. “A 2:1 advantage is significant,” Pennington argued, “but falls short of the 3:1 force ratio that is generally regarded as necessary for attacking forces, and it’s a long way from the double-digit advantage that is often claimed.”

To support her assertion of the relevance of the 3-1 force ratio, Pennington linked to an article by Trevor N. Dupuy, “Combat Data and the 3:1 Rule,” published in the summer 1989 edition of International Security. The problem with citing Dupuy is that his assessment of the 3-1 rule contradicts her assertion of it.

Dupuy criticized the 3-1 rule on empirical grounds. The so-called “3-1 rule” is a military aphorism that holds that attacking forces require a 3 to 1 advantage over defending forces in order to succeed. Although this rule has become widely-known and widely-held, especially in Western militaries, its origin is unknown and unattributed. It is not exactly clear to what exactly it refers, and there is no known original statement of the rule that can be consulted for clarification.

Dupuy questioned the ambiguity of the rule, which in turn undermined its relevance.

[W]hat is the force ratio to be used with the 3:1 force ratio planning factor? Is it numbers of men, or weapons? Is it firepower? Is it some other calculation of a combat power ratio? In any event, it is clear that neither numbers nor firepower tells us much unless we know the circumstances under which these numbers face each other and the manner in which the firepower is applied.[1]

In 1984, Dupuy’s Historical Evaluation Research Organization (HERO) compiled a database of battles from 1600 to 1973 for the U.S. Army Concepts Analysis Agency (CAA; now known as the U.S. Army Center for Army Analysis). CAA’s examination of the numerical force ratios in the database showed that attackers with advantages of 3-1 or more in manpower succeeded 74% of the time. It also showed that attackers won between 58% and 63% of the time when attacking with between a 1.5-1 numerical disadvantage and less than a 3-1 advantage. Attackers also managed to obtain a manpower advantage of 3-1 or greater in just 106 of 598 cases (17.7%) examined.[2]

CAA, Battle Outcome vs. Force Ratio

Dupuy concurred that a 3-1 ratio based on a simple numerical total of troop numbers had limited use as a general rule-of-thumb guide for military planning, but asserted that it was useless for analytical purposes Simply put, while there are many historical cases where an attacking force with a 3-1 numerical advantage succeeded, there are also many cases where attackers won with less than a 3-1 advantage, and even with a numerical inferiority. On the Eastern Front during World War II, for example, the German Army regularly conducted successful attacks against numerically superior Soviet forces.

Dupuy was so certain of the validity of the data on this that he made it an aphorism of his own: In the average modem battle, the attacker’s numerical strength is about double the defender’s.

This is because the attacker has the initiative and can initiate combat at a time and place of his choosing and in the manner of his choosing. The attacker can mass his forces at critical points on the battlefield to gain the advantage in strength which he believes necessary to assure the success of the attack.

A battle usually does not take place unless each side believes it has some chance for success. Otherwise, the attacker would avoid taking the initiative. The defender, if he could not avoid battle by withdrawal, would make every possible effort to reinforce the prospective battle area sufficiently to have a chance for successful defense. One circumstance in which a battle occurs without the tacit agreement or acceptance of the defender, is when the attacker achieves surprise. Alternatively, surprise by a defender (for instance, by ambush) may result in a battle taking place before the prospective attacker is ready.

Most military men are aware of the rule of thumb that an attacker can count on success if he has a three-to-one numerical superiority, while a defender can expect success if his inferiority is not less than one-to-two. But the side achieving surprise can count on the effects of surprise multiplying its force strength by a factor ranging between 1.5 and 2.5 (or even more in some cases). Thus, an attacker expecting to achieve surprise would be willing to attack with less than a three-to-one superiority.

Another factor which can influence an attacker to seek battle with less than a three-to-one superiority is confidence in the superior quality of his troops. This accounts for many instances in which the Germans attacked in World War II with less than the desirable numerical superiority, and for the similar instances of Israeli attacks in the Arab-Israeli wars without great numerical superiority.[3]

Dr. Pennington is on fairly firm ground in rejecting the idea that numerical superiority was the sole reason the Red Army defeated the German Army in World War II, but numbers did play an extremely important role in the Soviet success. The lack of a 3-1 manpower advantage did not preclude the Soviets from battlefield success; 2-1 was sufficient. By the time the Soviets achieved a 3-1 advantage, success was well in hand and the end in sight.

NOTES

[1] Trevor N. Dupuy. Numbers, Predictions and War: Using History to Evaluate Combat Factors and Predict the Outcome of Battles. Indianapolis; New York: The Bobbs-Merrill Co., 1979, p. 13

[2] Joshua M. Epstein, “Dynamic Analysis and the Conventional Balance in Europe,” International Security, Spring 1988, p. 156; Robert Helmbold and Aqeel A. Khan. “Combat History Analysis Study Effort (CHASE): Progress Report for the Period August 1984-June 1985,” Bethesda, MD: U.S. Army Concepts Analysis Agency, August 1986

[3] Trevor N. Dupuy. Attrition: Forecasting Battle Casualties and Equipment Losses in Modern War. Falls Church (VA): Nova Publications, 1995, pp. 98-99