Category Economics

U.S. versus The World (GDP)

There has been a lot of statements lately coming out of Russia (Putin in particular), China and other places about how the U.S. is in decline. Not sure what is the basis of these statements. Right now the United States GDP is $19.391 Trillion. The entire world’s GDP, according to the World Bank, is $80.684 Trillion. This means that the U.S.’s GPD makes up only 24% of the world’s GDP. This hardly puts us out in the dumpster.

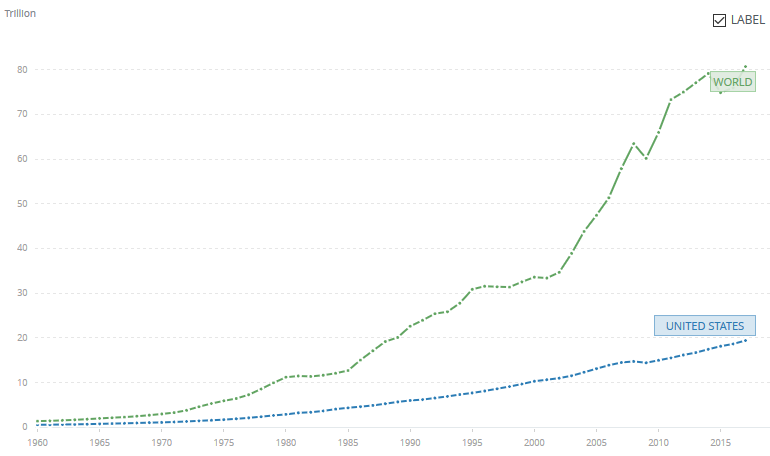
Now, it has changed over time. In 1960 the U.S. GDP was $543.3 billion while the World’s was $1.366 Trillion. This is 40%. So we have declined from having 40% of all the goods and services of the world to only having 24% of all the goods and services in the world. I would argue that in fact this is not a decline, but a growth on the part of the rest of the world, and in many cases a well-deserved growth. In fact, it was the intention of the Marshall Plan to restore the European economy for the purpose of making stable democratic economically viable counties. This is a plan that succeeded in spades. The data from 1960 is only 15 years after the devastating World War II, so it is really no surprise that the U.S. economy, living in “splendid isolationism” or at least conveniently isolated by two very large bodies of water, was in much better shape than those people who had panzers running back and forth across their front lawns.

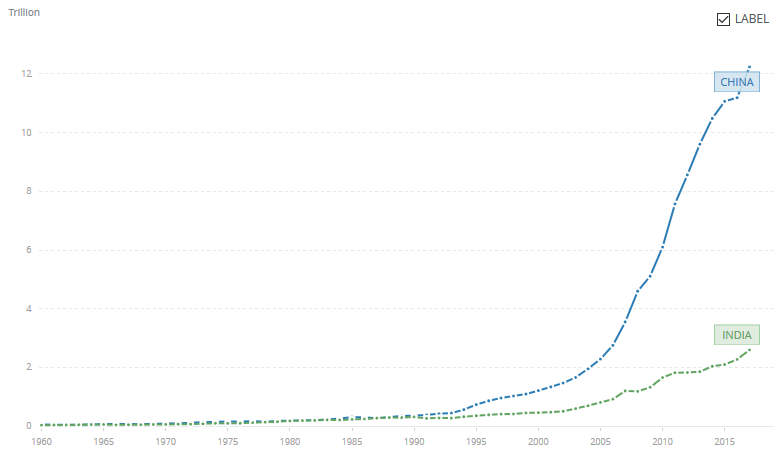
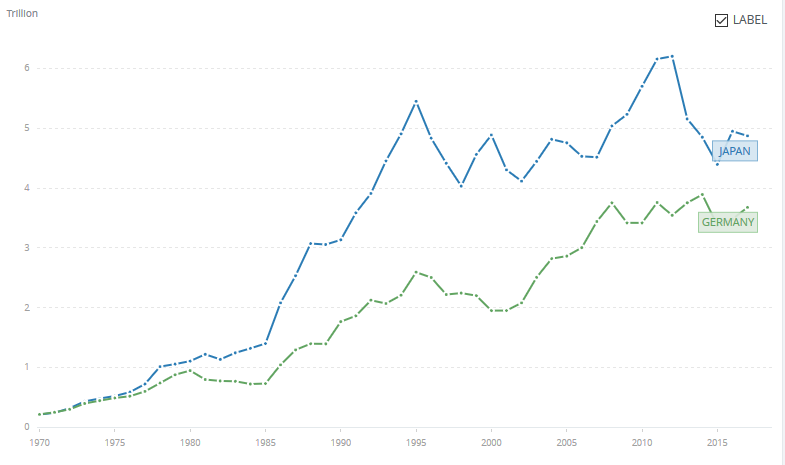
As of 1980 the United States GDP was 26% of the world GDP. Much of this change was a result of the growth of the western European and Japanese economies. It was before the later boom of the Chinese economy. But this is close to the same percentage as it is now. Just to compare over time:

Year…………Percent GDP

1960             40%

1970             39%

1980             26%

1990             26%

2000             31%

2010             23%

2017             24%


There is definitely a trend here, but it is a trend caused by the rest of the world growing, not by the United States declining. You can definitely see the world economy growing significantly after 2000. But most significant relative shift occurred between 1970, when the U.S. economy made up 39% of the world’s economy, to 1980, when it was down to 26%. It is now 24%, so really not a hugely significant shift in the last 40 or so years from the 26% it was in 1980. Not sure how you then conclude the United States is now in decline.

In the 57 years on this graph, the U.S. GPD actually only declined in one year (2009). That is a pretty good run.

U.S. versus China (GDP)

Right now (as of 2017) the U.S. GDP is $19.391 Trillion according to the World Bank. The Chinese economy is $12.238 Trillion. This is 63% of the U.S. economy. No economy has been that close to the U.S. economy since Japan leading up to 1995.

It is a rather amazing growth on the part of China. Back in the bad old days, after we had fought a war with them over Korea, they were threatening to invade Taiwan, they were supporting North Vietnam against our ally South Vietnam, and allied with the Soviet Union as part of the Communist Bloc, the difference was much greater. The U.S. GDP in 1960 was 543.3 Billion, while China’s was 59.716, meaning the U.S. economy was 9 times greater. Now it is only 1.6 times greater.

Of course, the two economies are intertwined, with the United States being China’s largest trading partner. This sort of leads to the odd situation where some in the U.S. and China consider the other to be a rival. But, I can’t think of too many cases where major trading partners were opposing hostile players on the world stage. Still, it is a very uncomfortable arrangement with the U.S. nominally the leader of the free world, while China had been known to run over its people with tanks. They are still very much a dictatorship. So the two nations seem to exist as trading partners who are not really friends and not really enemies. They may be rivals in the long run, or may not. There is, of course, an on-going trade dispute between the two nations.

Now….if were extend those lines on the graph out…..it does look like they will cross at some point around 2050 or so. This of course, leads me back to this post:

Demographics of China

It is projected that by 2050 the Chinese population will decline to 1.36 billion by 2050 (it is currently 1.41 billion) while the U.S. will grow to 402 million by 2050 (it is currently 328 million). For a number of reasons, I don’t think we will see the Chinese economy exceed the U.S. economy by 2050.

China versus India

In a blog posts on Indian demographics someone asked “The question is why India (per capita income $6,490-2016) is still so poor compared to China (per capital income $15,000 – 2016).” I have never really examined this, but it is an interesting enough question that I wanted to take a further look at it.

In 1960, the World Bank has China’s GDP at $60 billion. India’s GDP at $37 billion. India’s GDP is around 61% of China’s. Considering that India’s population was smaller, they were clearly at similar levels of development. This is, of course, back in the day when China and India were having border fights in the Himalayas (like in 1962).

Over the next couple of decades, India actually closed in on China. In 1970, India’s GDP was 67% of China’s GDP. In 1980 it was 96%. In 1990, they had separated a little with India’s GDP being 88% of China’s. So for three decades they grew at similar rates. And then as you can see rather clearly from the chart below, China’s economy took off.

By the year 2000, China’s GDP was 2.6 times larger than India’s. India was at 38% of China. By 2010, the disparity widened, with China’s GDP now 3.7 times larger than India’s (27%). As of 2017, the disparity continued to grow with China’s GDP now 4.7 times larger (or 21% for India). This is a pretty significant change over time, with clearly most of the difference developing from 1990 to the present. It has been an amazing three decades for China.

Of course, the last time we saw such amazing growth was with Japan up through 1995. Is China growth permanent and sustainable (like U.S. growth tends to be), or is it a bubble?

See:

Where Did Japan Go?


Japan versus Germany

Comparing Japan and Germany is an interesting exercise….as they kind of started at the same point. Their leaders in World War II were disgraceful incompetents who got their nations into wars they could not win, leading to them being bombed into oblivion and then occupied. They both started at the same point for recovery. In 1970 Japan had a GDP of 212.609 billion while Germany had a GDP of 215.022 billion. They oddly enough, almost ended up at at the same point, for in 2017 Japan had a GDP of 4.872 trillion while Germany had a GDP of 3.677 trillion. Considering that in 2017 the Japanese population is 127 million, and the German population is 82 million, at this stage Germany actually had the higher per capita income, being $44,550 compared to $38,440 (or $50,206 compared to $42,659 using PPP – Purchasing Power Parity, IMF 2017 figures). On the other hand, their trips to these points are very different as shown in this graph, showing their GDP from 1970-2017:

From 1970 through 1977 their economic growth almost parrelled each other. After that Japan’s economy started growing faster, then it boomed and after 1995 it busted. The German economy also declined after 1995, but since then seems to have grown and then stabilized.

While both nations have a fertility rate well below 2.1 (which is the replacement rate) they have reacted differently to immigration. Germany has been far more accepting of immigration than Japan. The end result is that Germany’s population is projected to still be at around 79 million in 2050 while Japan is expected to decline to 109 million. I am probably on safe ground to state that in the long run, Germany will have a higher GDP than Japan, meaning it will probably rise to be the third largest economy in the world.

Where Did Japan Go?

This post is a follow-up to this posting:

Demographics of Japan

In that post, I was talking about that there was a time in the 1980s when Japan’s GNP was 60% of the United States and people were talking about Japan’s economy outgrowing the United States by the year 2000, 2010 or 2020. Now…..we know that did not happen. The following chart, measuring GDP (Gross Domestic Product) shows this change of fortune rather dramatically:

In 1995, Japan’s GDP was $5.449 Trillion while the United States was $7.664 Trillion. Japan’s GDP was 71% of the United States and it looked to be closing. Now, in 2017 it was 25% of the United States ($4.872 versus $19.391). This is a hell of a change in fortune. Not near as bad as the collapse as the Soviet Union, but pretty damn significant in the larger picture.

Let us look how this developed over time (figures are from the World Bank):

Year       Japan GDP     U.S. GDP     Percent

1960         .044307          .5433             8%

1965        .09095             .7437           12%

1970        .212609         1.076             20%

1975        .521542         1.689             31%

1980       1.105              2.863             39%

1985       1.399              4.347             32%

1990       3.133              5.98               52%

1995       5.449              7.664             71%

2000       4.888             10.285            48%

2005       4.755             13.094            36%

2010       5.7                 14.964            38%

2015       4.395             18.121            24%


That is a trip. If the percentages were graphed out, it might start looking like a bell curve. I don’t have the depth of knowledge on the Japanese economy to pontificate as to why this developed this way.

So, we have seen a political and military challenge after World War II from the Soviet Union. They went from claiming that “We will bury you” (1956) to dissolving (1991). We have seen an economic challenge from our ally Japan, and it certainly impacted our car industry and consumer electronics. This has gone in only two decades from a point where the economic growth trajectory lines of Japan seemed to be on track to surpassing the United States to a point now where Japan’s economy is a quarter of our economy. And…..it still does not appear to be growing much. It makes you wonder about the next political, military or economic challenge…..and how that will play out.